. 2024 Jan 4;15(1):7.
doi: 10.1038/s41419-023-06371-1.

Nuclear pore protein POM121 regulates subcellular localization and transcriptional activity of PPARγ

Affiliations

Nuclear pore protein POM121 regulates subcellular localization and transcriptional activity of PPARγ

Yanxiong Yu et al. Cell Death Dis. .

Abstract

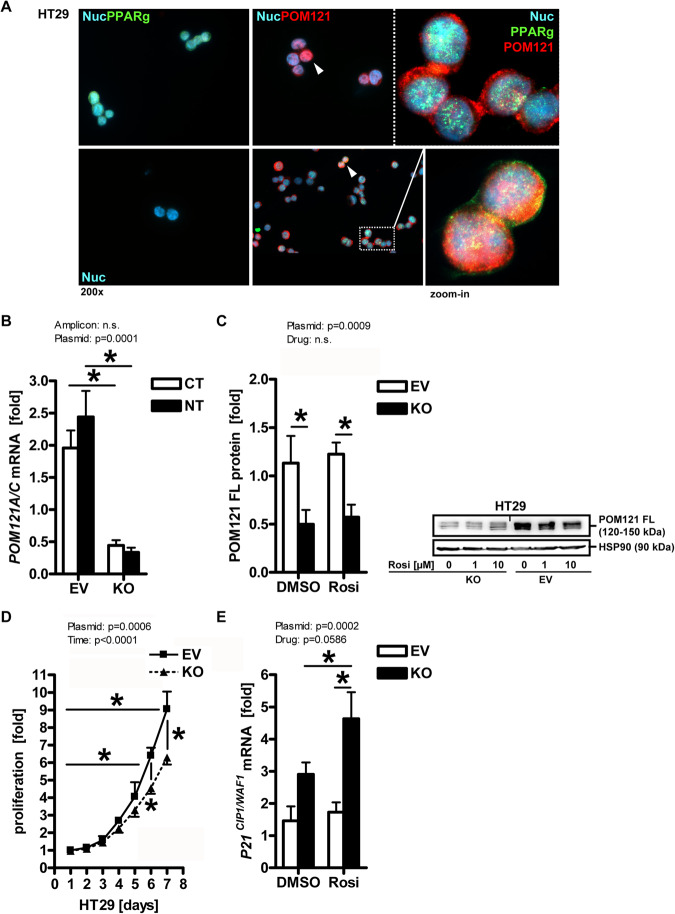
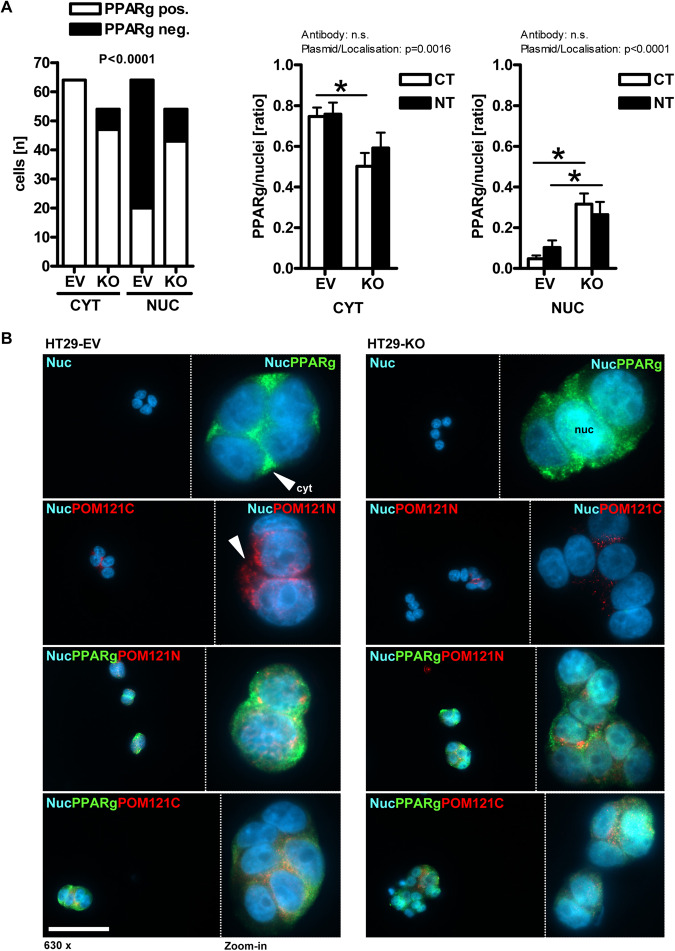
Manipulation of the subcellular localization of transcription factors by preventing their shuttling via the nuclear pore complex (NPC) emerges as a novel therapeutic strategy against cancer. One transmembrane component of the NPC is POM121, encoded by a tandem gene locus POM121A/C on chromosome 7. Overexpression of POM121 is associated with metabolic diseases (e.g., diabetes) and unfavorable clinical outcome in patients with colorectal cancer (CRC). Peroxisome proliferator-activated receptor-gamma (PPARγ) is a transcription factor with anti-diabetic and anti-tumoral efficacy. It is inhibited by export from the nucleus to the cytosol via the RAS-RAF-MEK1/2-ERK1/2 signaling pathway, a major oncogenic driver of CRC. We therefore hypothesized that POM121 participates in the transport of PPARγ across the NPC to regulate its transcriptional activity on genes involved in metabolic and tumor control. We found that POM121A/C mRNA was enriched and POM121 protein co-expressed with PPARγ in tissues from CRC patients conferring poor prognosis. Its interactome was predicted to include proteins responsible for tumor metabolism and immunity, and in-silico modeling provided insights into potential 3D structures of POM121. A peptide region downstream of the nuclear localization sequence (NLS) of POM121 was identified as a cytoplasmic interactor of PPARγ. POM121 positivity correlated with the cytoplasmic localization of PPARγ in patients with KRAS mutant CRC. In contrast, POM121A/C silencing by CRISPR/Cas9 sgRNA or siRNA enforced nuclear accumulation of PPARγ and activated PPARγ target genes promoting lipid metabolism and cell cycle arrest resulting in reduced proliferation of human CRC cells. Our data suggest the POM121-PPARγ axis as a potential drugable target in CRC.


Conflict of interest statement

The authors declare no competing interests.

Figures

Fig. 1
Fig. 1. Identification of POM121 as interaction partner of PPARγ.
A Pull-down of peptides by PPARγ Ab. CoIP was performed on cytosolic lysates of SW480 cells using PPARγ Ab or IgG (bead control) followed by detection of precipitated bands by silver staining. MS sequencing of the ~50 kDa band precipitated by PPARγ Ab contained peptides from the internal NLS region (Table S3) of POM121C (Uniprot ID: C9JFL1, A8CG34, P121C_HUMAN). M = protein marker (kDa). B Scheme of POM121 protein isoforms. Legend: aa = amino acid; ER = endoplasmic reticulum, TM = transmembrane (domain); sPOM121 = soluble POM121 (truncation variant); NLS = nuclear localization sequence (K + /R + ); PPARγ (binding site) = POM121 peptides precipitated by PPARγ Ab and identified by MS in A; FG = phenylalanine and glycine-rich (domain), NT = N-terminus; CT = C-terminus. NCBI BlastP alignment of POM121A and POM121C gene products (Uniprot IDs: P121A_HUMAN vs. P121C_HUMAN) is presented in S1. C, D POM121A/C mRNA and protein expression. HEK293T non-cancer control and human CRC cell lines (HT29, HCT116, SW480) were cultivated until subconfluency followed by RNA or protein extraction. Quantitative analyses (left) and representative images (right) from Western blots or ethidium bromide-stained agarose gels visualizing bands for a common amplification product shared by POM121A/C cDNAs (Table S2). C RT-qPCRs. Ct-values normalized to B2M are -fold ± S.E. D Western blots. O.D. values of bands normalized to HSP90 are -fold ± S.E. (n.s., Kruskal-Wallis test with Dunn post-tests, n = 3 per cell line and method). E In situ expression of POM121 and PPARγ proteins in CRC tissues. FFPE sections from patients’ TMAs were stained with Abs by immunohistochemistry (IHC). Left: Dichotome analysis grouped by negative (scores 0/1) vs. positive (scores 2/3) staining for each protein in both tumor/epithelial and stroma cells (*p < 0.0001, test of symmetry and Mc Nemar test, n = 205 cases) (Tables S5, 6). Middle: Correlation plot of graded scores for each protein (linear regression, r2 = 0.3658, non-zero slope = *p < 0.0001, n = 154 cases). Data points represent cumulative overlays of patients with the same numerical score as depicted in the graph. Right: Representative pictures of tumor tissues with pos. vs. neg. staining; scale bar = 50 µm; original magnifications 200x. F Subcellular distribution of PPARγ correlates with POM121 positivity and the KRAS gene mutation status of CRC tissues. Patients were stratified into KRAS mutant (mut) vs. wildtype (wt) cases and grouped by high (Abbrev. “H”, scores 2/3) vs. low (Abbrev. “L”, scores 0/1) POM121 protein expression (Tables S5, 6). Left: Data were analyzed as in E (*p < 0.05, Fisher Exact test, n = 208). Right: Representative pictures of tumor tissues with cytoplasmic vs. nuclear staining; scale bar = 50 µm; original magnifications 200x.
Fig. 2
Fig. 2. POM121 knockout reduces proliferation of human CRC cells.
A Subcellular localization of POM121 and PPARγ proteins. Subconfluent HT29 cells were subjected to immunofluorescence (IF) microscopy. Representative images are shown. Color code: yellow = POM121/PPARγ (overlay); red = POM121; green = PPARγ; blue = nuclei (DAPI); scale bar = 50 µm; original magnifications 200x (zoomed-in 630x). Note the perinuclear distribution of POM121 and partial colocalization with PPARγ as marked by white arrows. B POM121 knockout (KO) reduces POM121A/C mRNA. HT29 cells were subjected to stable transfection with POM121A/C targeting CRISPR/Cas9 sgRNA plasmid (KO) or empty vector (EV), followed by clonal selection and RNA extraction. Ct-values from RT-qPCRs using primers against NT or CT amplicons normalized to B2M are -fold ± S.E. (*p < 0.05 vs. EV, 2way-ANOVA with Bonferroni post-test, n = 3 per clone). C POM121 KO reduces POM121 protein. Clonal cells were treated with vehicle (DMSO) or rosi (1–10 µM) for 48 h and then subjected to extraction of total cell lysate (TCL). Representative images (right) and quantitative analyses (left) from Western blots using Abs against the NT or CT domains. O.D. values of bands in gels normalized to HSP90 are -fold ± S.E. (*p < 0.05 vs. EV, 2way-ANOVA with Bonferroni post-test, n = 3 per clone). D POM121 KO reduces cell proliferation. Viability of clonal cells from B was measured by colorimetric MTT assay. O.D. values were calculated as -fold ± S.E. compared with day 0 (*p < 0.05 vs. EV or day, 2way-ANOVA with Bonferroni post-tests, n = 3 per clone). E POM121 KO increases basal- and ligand-mediated mRNA expression of cyclin-dependent kinase inhibitor P21 CIP1/WAF1. Clonal cells were treated with vehicle (DMSO) or rosi (1–10 µM) for 48 h, followed by RNA extraction. Ct-values from RT-qPCRs normalized to B2M are -fold ± S.E. (*p < 0.05 vs. vehicle or EV, 2way-ANOVA with Bonferroni post-tests, n = 3 per clone).
Fig. 3
Fig. 3. POM121 alters expression of PPARγ target genes.
A POM121 KO reduces basal- and ligand-mediated protein expression of luciferase enzyme encoded on episomal reporter plasmids driven by DNA-binding motifs for PPARγ protein. HT29 clonal cells were transfected with a plasmid containing 3xPPREs from the enhancer region of the ACOX1 gene followed by incubation with vehicle (DMSO) or rosi (1–10 µM) for 48 h. Luciferase activity was normalized to protein content and expressed as -fold ± S.E. (*p < 0.05 vs. vehicle or EV, 2way-ANOVA with Bonferroni post-tests, n = 3 per clone). B POM121 KO decreases basal- and ligand-mediated protein expression of PPARγ target genes. Clonal cells were treated as in (A), followed by extraction as total cell lysate (TCL). Quantitative analyses (left) and representative images (right) from Western blots. O.D. values from gels normalized to HSP90 are -fold ± S.E. (*p < 0.05 vs. EV, 2way-ANOVA with Bonferroni post-tests, n = 3 per clone). C POM121 KO increases basal- or ligand-mediated mRNA expression of PPARγ target genes. Clonal cells were treated as in (A), followed by RNA extraction. Ct-values from RT-qPCRs normalized to B2M are -fold ± S.E. (*p < 0.05 vs. vehicle or EV, 2way-ANOVA with Bonferroni post-tests, n = 3 per clone). D POM121 KO and PPARγ agonist alter the subcellular distribution of PPARγ protein. Clonal cells were treated with vehicle (DMSO) or 10 µM rosi for 48 h and subjected to subcellular fractionation (SCF). Representative images (top right) and quantitative analyses (bottom) from Western blots. O.D. values of bands in gels normalized to HSP90 or lamin A/C are -fold ± S.E. (*p < 0.05 vs. vehicle or EV, 2way-ANOVA with Bonferroni post-tests, n = 3 per clone). Legend: CYT = soluble cytoplasm; NUC = soluble nucleoplasm; INS = insoluble fraction (cytoskeleton and membrane proteins).
Fig. 4
Fig. 4. POM121 regulates nuclear transport of PPARγ.
A POM121 KO promotes nuclear translocation of PPARγ. Clonal cells were subjected to IF microscopy using PPARγ and Abs directed against the NT or CT of POM121. Data are mean numbers of  PPARγ+ signals per cell (= DAPI+ nucleus) ± S.E. (n ≥ 5 cells per field, n ≥ 15 fields; *p < 0.05 vs. EV, Fisher Exact test and 2way-ANOVA with Bonferroni post-tests, n = 2 per clone). B Representative images. Color code: yellow = POM121/PPARγ (overlay); green = PPARγ; red = POM121; blue = nuclei (DAPI); scale bar = 50 µm; original magnifications 630x (with zoom-in). Arrows mark cytoplasmic (abbrev. “cyt”) PPARγ in EV vs. nuclear (abbrev. “nuc”) PPARγ in KO cells and perinuclear POM121+ punctae.
Fig. 5
Fig. 5. siRNA and transport inhibitors phenocopy sgRNA-mediated POM121 knockout.
A POM121 knockdown (KD) by siRNA increases mRNA expression of PPARγ target genes but reduces protein levels. Parental HT29 cells were transiently transfected with POM121A/C siRNA or control siRNA for 48 h followed by extraction of RNA or total cell lysate (TCL). Left: Quantitative analyses from RT-qPCRs. Ct-values normalized to B2M are -fold ± S.E.; Right: Quantitative analyses and representative images from Western blots. O.D. values from gels normalized to lamin A/C are -fold ± S.E. (*p < 0.05 vs. control siRNA, 2way-ANOVA with Bonferroni post-tests, n = 3 per method). B Inhibitors of NPC transport mitigate the transcriptional activity of PPARγ. Clonal cells from Fig. 4 were treated with importazol, leptomycin B, vehicle (DMSO) or rosi (1–10 µM) for 48 h, followed by RNA extraction. Ct-values from RT-qPCRs normalized to B2M are -fold ± S.E. (*p < 0.05 vs. vehicle or EV, 2way-ANOVA with Bonferroni post-tests, n = 3 per clone). C Model of POM121-mediated transport of PPARγ. POM121 (FL, 120–150 kDa) as an essential integral transmembrane protein of the NPC is overexpressed in cancers and gives rise to soluble N- and C-terminal truncation variants. It has been identified to bind to PPARγ via amino acids C-terminal to its NLS and to disrupt bi-directional traffic of transcription factors (e.g., NFκB, MYC) across the nuclear pore. POM121 gain of function (GOF) reduced transcription in the nucleus and enhanced translation of PPARγ target genes/proteins in the cytosol, whereas POM121 loss of function (LOF) had the opposite effect. We propose that changes in the availability of POM121 FL protein and/or its soluble variants tip the balance between import and export of PPARγ. This “dysbalance” may be caused by competition for transport factors (importins, exportins) between POM121 and known PPARγ transport motifs: (i) the NLS in the DBD and the adjacent hinge region [73, 74] and (ii) the MEK1-binding NES-like motifs in the LBD [37, 38]. Color legend: Blue circles = ribosome; Blue cyclinders (with TM, NLS and FG domains) = POM121 (FL); Orange full circle = PPARγ-ligand (e.g., rosi); Orange quarter = PPARγ DNA-binding domain (DBD); Green quarter = PPARγ ligand-binding domain (LBD); Blue arrow = Transport nucleus-to-cytosol (mRNA translation); Orange arrow = Transport cytosol-to-nucleus (mRNA transcription).
Fig. 6
Fig. 6. Structure prediction models of POM121 holo protein.
A I-TASSER query of FL POM121 protein [UniProt ID: Q96HA1 (P121A_HUMAN)]. Top 5 theoretical 3D models are listed (Table S13) with C-scores [-5 (low) to +2 (high)] for model confidence: Model (Rank A) -1.19 [3gavA] is shown. Putative sequences of TM (red), NLS (green), PPARγ-binding (blue) and FG-rich (orange) domains of POM121 were mapped to model Rank A. Note the ordered N-terminal (NT) domains vs. the disordered/unspecified (low confidence) structure of the C-terminus (CT, black brackets). B B-Factor graph of FL POM121 protein [UniProt ID: Q96HA1 (P121A_HUMAN)] in the top theoretical model (Rank A) with confidence [y-axis: - (ordered) to + (disordered)]. B-Factor was lowest (most reliable) along the N-terminal TM domain, whereas peaked (most disordered) toward the C-terminus (aa 1225–1249), corresponding to the elongated irregular shape of the model in (A), consistent with the FG-repeats of the hydrophilic “basket” of the NPC protein. C Local Quality Estimate plot of FL POM121C protein [UniProt ID: A8CG34 (P121C_HUMAN)] for the theoretical model AF-A8CG34-F3 given by SWISS-MODEL (alpha-fold DB: average model confidence = 43.19). Legend: TM = G27 to W67 (helical); NLS (partial) = E287 to D306 (helical), PPARγ-binding peptides = M371 to S477 (disordered). D 3D model of FL POM121C protein [UniProt ID: A8CG34 (P121C_HUMAN)] given by SWISS-MODEL (alpha-fold DB in C). Model Confidence: Light blue = very high (pLDDT > 90); Dark blue = confident (90 > pLDDT > 70); Gray = low (70 > pLDDT > 50); Orange = very low (pLDDT < 50). N-terminal TM and NLS helices are highlighted as shaded blue rectangles, the N-terminus orientated towards the ER cisterna side in yellow. Note that the sequence consecutive of the NLS was predicted to be mostly disordered, including the PPARγ-peptide binding regions identified by MS (Table S3) (S1). The third high-confidence helix did not overlap with the putative PPARγ-binding peptides.

Similar articles

Cited by

References

    1. Sung H, Ferlay J, Siegel RL, Laversanne M, Soerjomataram I, Jemal A, et al. Global Cancer Statistics 2020: GLOBOCAN estimates of incidence and mortality worldwide for 36 Cancers in 185 Countries. CA Cancer J Clin. 2021;71:209–49. doi: 10.3322/caac.21660. - DOI - PubMed
    1. Guinney J, Dienstmann R, Wang X, de Reynies A, Schlicker A, Soneson C, et al. The consensus molecular subtypes of colorectal cancer. Nat Med. 2015;21:1350–6. doi: 10.1038/nm.3967. - DOI - PMC - PubMed
    1. Ge W, Yue Y, Xiong S. POM121 inhibits the macrophage inflammatory response by impacting NF-kappaB P65 nuclear accumulation. Exp Cell Res. 2019;377:17–23. doi: 10.1016/j.yexcr.2019.02.021. - DOI - PubMed
    1. Rodriguez-Bravo V, Pippa R, Song WM, Carceles-Cordon M, Dominguez-Andres A, Fujiwara N, et al. Nuclear pores promote lethal prostate cancer by increasing POM121-Driven E2F1, MYC, and AR nuclear import. Cell. 2018;174:1200–15.e20. doi: 10.1016/j.cell.2018.07.015. - DOI - PMC - PubMed
    1. Beck M, Hurt E. The nuclear pore complex: understanding its function through structural insight. Nat Rev Mol Cell Biol. 2017;18:73–89. doi: 10.1038/nrm.2016.147. - DOI - PubMed

Publication types

MeSH terms