. 2024 Jan 4;15(1):17.
doi: 10.1038/s41467-023-44432-3.

Muscle abnormalities worsen after post-exertional malaise in long COVID

Affiliations

Muscle abnormalities worsen after post-exertional malaise in long COVID

Brent Appelman et al. Nat Commun. .

Abstract

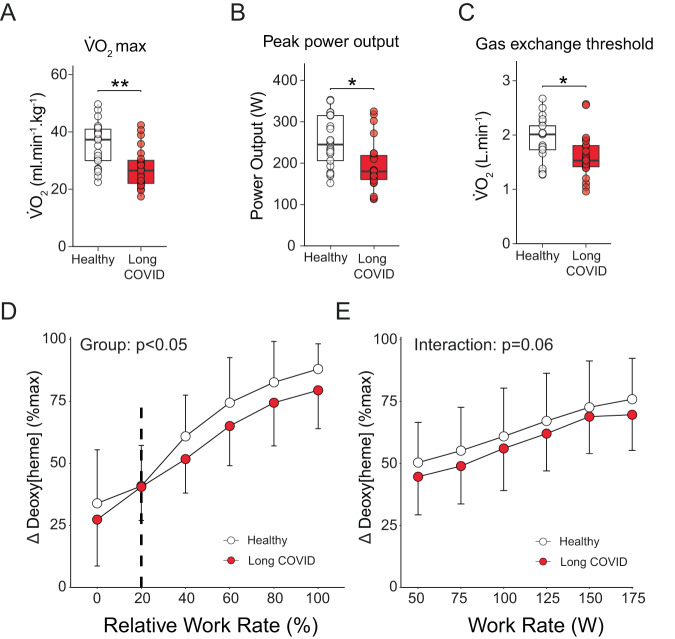
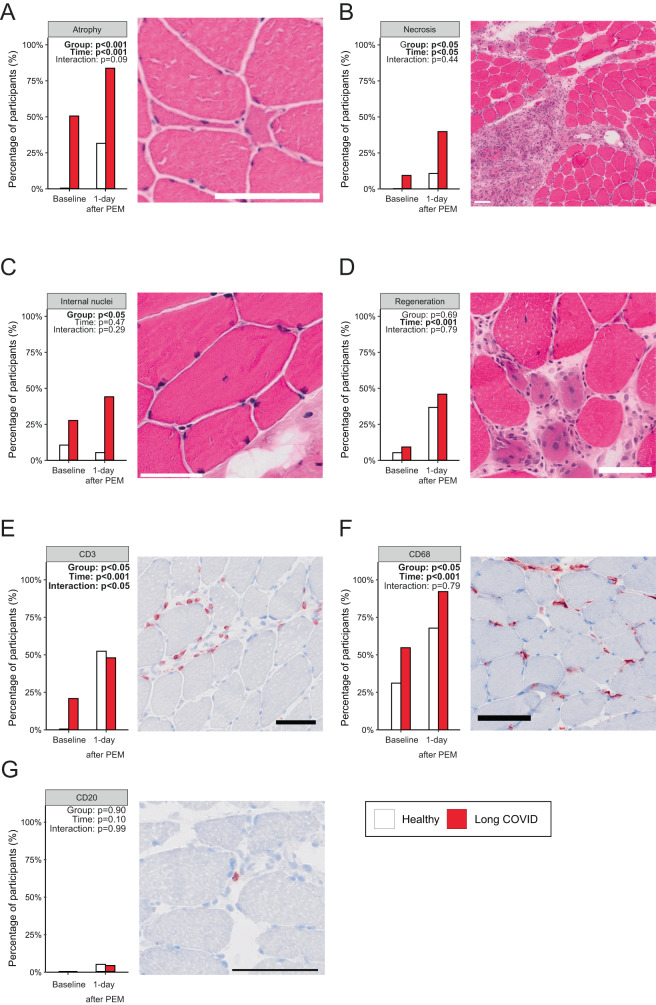
A subgroup of patients infected with SARS-CoV-2 remain symptomatic over three months after infection. A distinctive symptom of patients with long COVID is post-exertional malaise, which is associated with a worsening of fatigue- and pain-related symptoms after acute mental or physical exercise, but its underlying pathophysiology is unclear. With this longitudinal case-control study (NCT05225688), we provide new insights into the pathophysiology of post-exertional malaise in patients with long COVID. We show that skeletal muscle structure is associated with a lower exercise capacity in patients, and local and systemic metabolic disturbances, severe exercise-induced myopathy and tissue infiltration of amyloid-containing deposits in skeletal muscles of patients with long COVID worsen after induction of post-exertional malaise. This study highlights novel pathways that help to understand the pathophysiology of post-exertional malaise in patients suffering from long COVID and other post-infectious diseases.


Conflict of interest statement

The authors declare no competing interests.

Figures

Fig. 1
Fig. 1. Lower exercise capacity in patients with long COVID.
Maximal pulmonary oxygen uptake (V̇O2max, A, n = 23 long COVID, n = 21 healthy control), peak power output (B, n = 25 long COVID, n = 21 healthy control) and gas exchange threshold (C, n = 23 long COVID, n = 21 healthy control) were all lower (p < 0.0001, p = 0.001 and p = 0.014, respectively)in patients with long COVID compared to healthy controls. D and E Muscle deoxygenated [heme] responses (mean ± SD) measured by near-infrared spectroscopy were lower (p = 0.023) in long COVID (n = 16), indicative of lower peripheral oxygen extraction during exercise compared to healthy controls (n = 18; excessive adipose tissue precluded data analysis in remaining participants). Continuous parametric data were analyzed using a two-sided t-test (panels A–C). Continuous parametric longitudinal data (mean ± SD; panels D and E) were analyzed with a generalized linear mixed model. p-values for panel D, E were determined with a two-sided ANOVA test. Dashed line (D) represents the average starting point of the exercise test. *p < 0.05; **p < 0.001. Box plots show the median (centerline), the first and third quartiles (the lower and upper bound of the box), and the whiskers show the 1.5× interquartile range. Source data are provided in the Source Data File.
Fig. 2
Fig. 2. Skeletal muscle alterations are associated with exercise capacity in patients with long COVID.
A and B examples of skeletal muscle capillaries; no group-differences in capillary density (p = 0.11) or capillary:fiber ratio (p = 0.08) were observed (n = 26 long COVID, n = 21 healthy control). C A significant association was found between capillary-to-fiber ratio and V̇O2max for both groups (n = 23 long COVID, p-value: 0.048, n = 21 healthy control, p-value: 0.007). D Patients with long COVID (n = 25) had a higher percentage (p-value: 0.036) of glycolytic type IIx compared to healthy controls (n = 21). E For a given fiber cross-sectional area (FCSA), patients with long COVID (n = 25) had a significantly lower peak power output (p-value: 0.045) as compared to healthy individuals (n = 21). F Succinate dehydrogenase (SDH) activity in sections (see also Fig. 3) was associated with maximal oxygen uptake consumption (V̇O2max) in healthy controls (n = 21, p-value: 0.0014), but not in long COVID patients (n = 23, p-value: 0.66), with significant different correlation coefficients. Continuous parametric data were analyzed using a two-sided t-test (B, D). Correlations were calculated using two-sided Pearson (C, E, F). The difference in intercept was calculated with a linear regression using a two-sided ANOVA (E). Correlation coefficients were compared using the R package cocor. *p < 0.05; **p < 0.001. Bar: 100 μm. Box plots show the median (centerline), the first and third quartiles (the lower and upper bound of the box), and the whiskers show the 1.5× interquartile range. Source data are provided in the Source Data File.
Fig. 3
Fig. 3. Metabolic and mitochondrial dysfunction in long COVID patients worsens with post-exertional malaise.
A Oxidative phosphorylation (OXPHOS) capacity was significantly lower in patients with long COVID (n = 25) compared to healthy controls (n = 21), and remained lower one day after induction of post-exertional malaise (PEM) in patients (Group: p = 0.003, Time: p < 0.001). B Succinate dehydrogenase (SDH) activity, a marker for mitochondrial density, was not different between groups (p = 0.06) and only reduced (p = 0.0083) after induction of post-exertional malaise in long COVID patients (n = 25) compared to healthy controls (n = 21). A typical example of the SDH activity is shown in panel C. Skeletal muscle (D) and venous (E) metabolome pathways indicate slightly higher levels of metabolites related to glycolysis, and a lower abundance of metabolites related to purine synthesis and the tricarboxylic acid (TCA) cycle, indicative of a lower reliance on oxidative metabolism in patients with long COVID (n = 25, both timepoints) as compared to healthy (n = 19, both timepoints). Faded names were not measured and shown for clarity. A higher effect size in long COVID is shown in red, lower effect size in blue. Continuous parametric longitudinal data (panels A, B, D, E) were analyzed with a generalized linear mixed model with a two-sided ANOVA. Post-hoc tests comparing each group were performed when the interaction term was significant and was performed using emmeans with BH adjustment (panels A and B). Effect sizes (D and E) were calculated with Hedges‘ g *p < 0.05; **p < 0.001; p < 0.05 indicates a significant interaction effect. Bar: 50 μm. PEM post-exertional malaise. Box plots show the median (centerline), the first and third quartiles (the lower and upper bound of the box), and the whiskers show the 1.5× interquartile range. Source data are provided in the Source Data File.
Fig. 4
Fig. 4. More amyloid-containing deposits in skeletal muscle, but not located inside capillaries or lymphatic vessels.
A Typical example of amyloid-containing deposits in skeletal muscle. Pre-SARS-CoV-2 pandemic skeletal muscle sections stained with Thioflavin T showed similar levels of amyloid-containing deposits as healthy controls. B The concentration of amyloid-containing deposits in skeletal muscle in long COVID patients (n = 24) was higher (Group: p < 0.001) than in healthy controls (n = 21) and increased in long COVID patients and healthy controls upon exercise (Time: p = 0.008). C Amyloid-containing deposits were not found inside endothelial cells, but rather next to endothelial cells, or in the extracellular matrix between fibers. We performed the amyloid stainings on all patients and show a typical example in the figures. D Amyloid-containing deposits were not located inside lymphatic vessels. Continuous parametric longitudinal data (panel B) were analyzed with a generalized linear mixed model with a two-sided ANOVA. Bar: 100 μm. PEM post-exertional malaise. Box plots show the median (centerline), the first and third quartiles (the lower and upper bound of the box), and the whiskers show the 1.5× interquartile range. Source data are provided in the Source Data File.
Fig. 5
Fig. 5. Pathological features in skeletal muscle in patients with long COVID.
A Very small and angulated atrophic fibers were more abundant in patients with long COVID and in the post-exercise biopsy in both groups (Group: p < 0.001). B Large areas of necrotic fibers were observed in 36% of patients with long COVID after exhaustive exercise (Group p-value: 0.09, as compared to healthy controls. C Internal nuclei, indicative of fiber repair, were significantly more abundant (Group: p = 0.002) in the skeletal muscle of patients with long COVID, but did not increase during post-exertional malaise (PEM). D Regenerative fibers were not different between groups, but were more abundant in the post-exercise biopsy (Time: p < 0.001). E: More patients with long COVID had CD3+ T-cell infiltration (Group: p = 0.046). F The presence of CD68+ macrophages was higher in long COVID patients (Group: p = 0.03). G CD20+ B-cells were not abundantly present in skeletal muscle. All panels: n = 25 long COVID, n = 21 healthy controls. Categorical longitudinal data were analyzed using logistic regression with “time” as a covariate. Post-hoc comparisons (E) were using the Empirical Mean Differences using R package emmeans with BH adjustment. Bar: 100 μm. Abbreviation: PEM; post-exertional malaise. Source data are provided in the Source Data File.
Fig. 6
Fig. 6. Similar concentrations of nucleocapsid protein in skeletal muscle in patients with long COVID as control.
A The SARS-CoV-2 nucleocapsid protein was present in almost all participants, but not more abundant in long COVID (n = 23) compared to healthy controls (n = 19). B Typical examples of SARS-CoV-2 nucleocapsid protein, as a marker for viral persistence, in skeletal muscle. Skeletal muscle biopsies from before the SARS-CoV-2 pandemic showed no signal when stained with polyclonal IgG anti-SARS-CoV-2 nucleocapsid protein, indicating that SARS-CoV-2 nucleocapsid protein was not present in uninfected people which confirmed there was no aspecific binding. Continuous parametric longitudinal data (panel A) were analyzed with a generalized linear mixed model with a two-sided ANOVA. Bar: 100 μm. PEM post-exertional malaise. Box plots show the median (centerline), the first and third quartiles (the lower and upper bound of the box), and the whiskers show the 1.5× interquartile range. Source data are provided in the Source Data File.

References

    1. Davis, H. E., Mccorkell, L., Vogel, J. M. & Topol, E. J. Long COVID: major findings, mechanisms and recommendations. Nat. Rev. Microbiol.21, 133–146 (2023). - PMC - PubMed
    1. Hickie, I. et al. Post-infective and chronic fatigue syndromes precipitated by viral and non-viral pathogens: prospective cohort study. BMJ333, 575–578 (2006). - PMC - PubMed
    1. Ruiz-Pablos, M., Paiva, B., Montero-Mateo, R., Garcia, N. & Zabaleta, A. Epstein-Barr virus and the origin of myalgic encephalomyelitis or chronic fatigue syndrome. Front. Immunol.12, 4637 (2021). - PMC - PubMed
    1. Ursinus, J. et al. Prevalence of persistent symptoms after treatment for lyme borreliosis: a prospective observational cohort study. Lancet Reg. Health—Eur.6, 100142 (2021). - PMC - PubMed
    1. Herridge, M. S. & Azoulay, É. Outcomes after critical illness. N. Engl. J. Med.388, 913–924 (2023). - PubMed

Publication types

Associated data