. 2024 Jan 4;15(1):275.
doi: 10.1038/s41467-023-44237-4.

DCAF1-based PROTACs with activity against clinically validated targets overcoming intrinsic- and acquired-degrader resistance

Affiliations

DCAF1-based PROTACs with activity against clinically validated targets overcoming intrinsic- and acquired-degrader resistance

Martin Schröder et al. Nat Commun. .

Erratum in

  • Author Correction: DCAF1-based PROTACs with activity against clinically validated targets overcoming intrinsic- and acquired-degrader resistance.
    Schröder M, Renatus M, Liang X, Meili F, Zoller T, Ferrand S, Gauter F, Li X, Sigoillot F, Gleim S, Stachyra TM, Thomas JR, Begue D, Khoshouei M, Lefeuvre P, Andraos-Rey R, Chung B, Ma R, Pinch B, Hofmann A, Schirle M, Schmiedeberg N, Imbach P, Gorses D, Calkins K, Bauer-Probst B, Maschlej M, Niederst M, Maher R, Henault M, Alford J, Ahrne E, Tordella L, Hollingworth G, Thomä NH, Vulpetti A, Radimerski T, Holzer P, Carbonneau S, Thoma CR. Schröder M, et al. Nat Commun. 2024 Aug 19;15(1):7109. doi: 10.1038/s41467-024-51317-6. Nat Commun. 2024. PMID: 39160182 Free PMC article. No abstract available.

Abstract

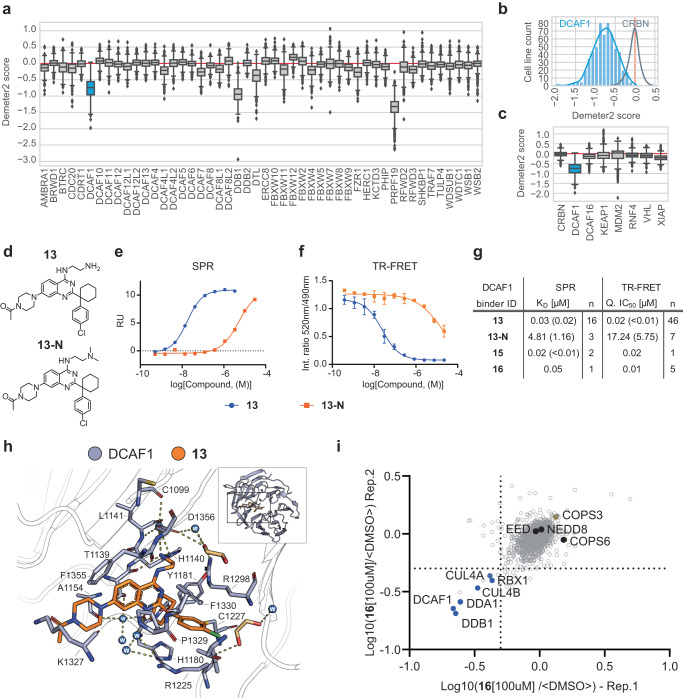
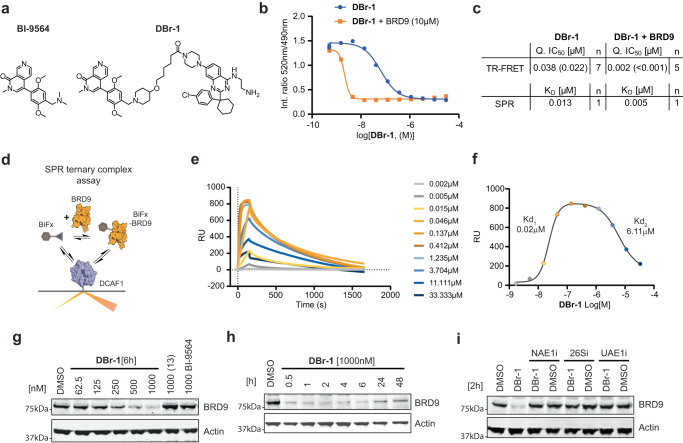
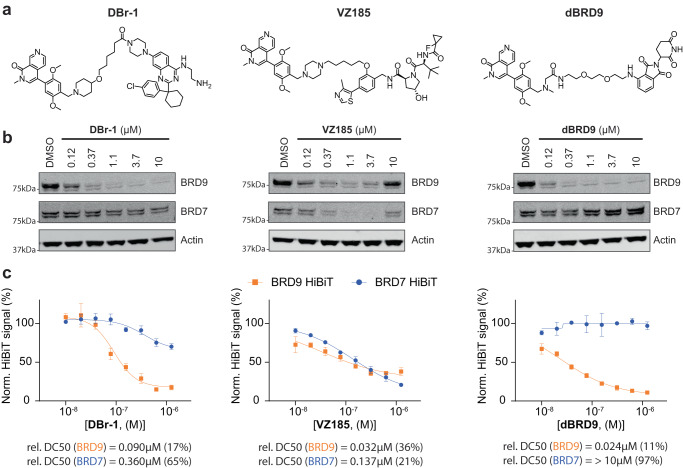
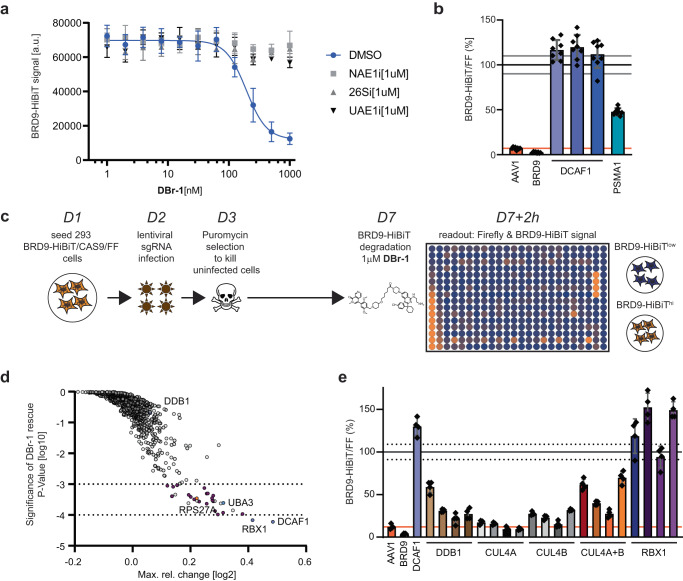
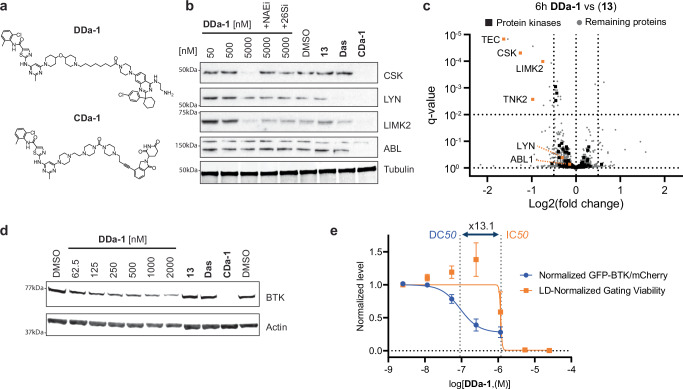
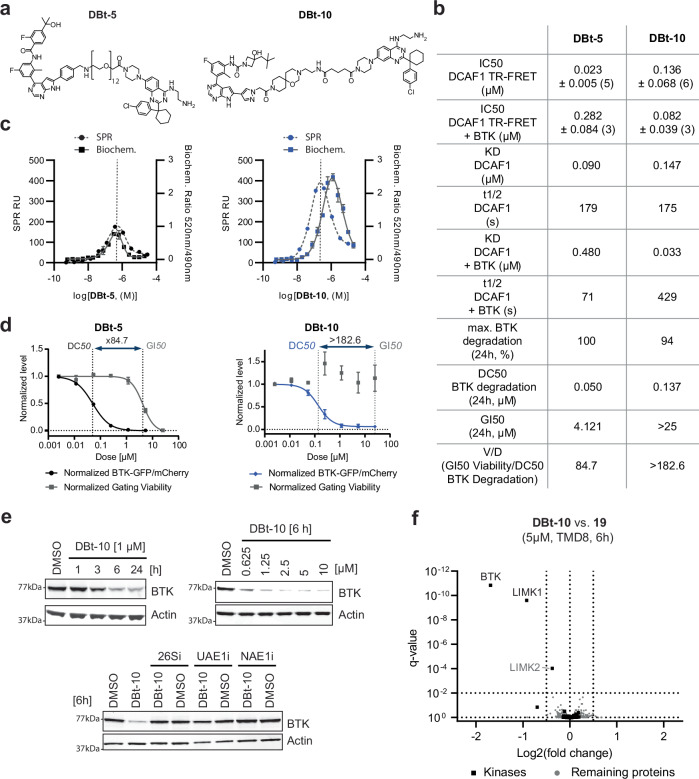
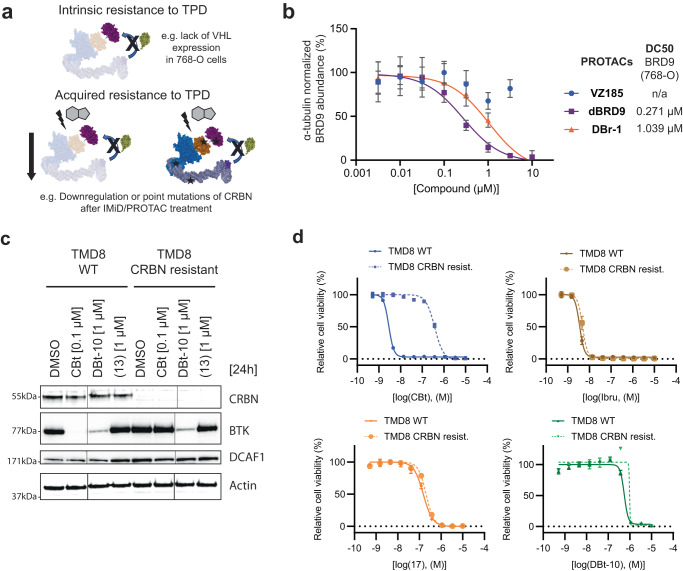
Targeted protein degradation (TPD) mediates protein level through small molecule induced redirection of E3 ligases to ubiquitinate neo-substrates and mark them for proteasomal degradation. TPD has recently emerged as a key modality in drug discovery. So far only a few ligases have been utilized for TPD. Interestingly, the workhorse ligase CRBN has been observed to be downregulated in settings of resistance to immunomodulatory inhibitory drugs (IMiDs). Here we show that the essential E3 ligase receptor DCAF1 can be harnessed for TPD utilizing a selective, non-covalent DCAF1 binder. We confirm that this binder can be functionalized into an efficient DCAF1-BRD9 PROTAC. Chemical and genetic rescue experiments validate specific degradation via the CRL4DCAF1 E3 ligase. Additionally, a dasatinib-based DCAF1 PROTAC successfully degrades cytosolic and membrane-bound tyrosine kinases. A potent and selective DCAF1-BTK-PROTAC (DBt-10) degrades BTK in cells with acquired resistance to CRBN-BTK-PROTACs while the DCAF1-BRD9 PROTAC (DBr-1) provides an alternative strategy to tackle intrinsic resistance to VHL-degrader, highlighting DCAF1-PROTACS as a promising strategy to overcome ligase mediated resistance in clinical settings.


Conflict of interest statement

M.S., X.L., F.M., T.Z., S.F., F.G., X.Li, F.S., S.G., T.-M.S., J.T., D.B., P.L., R.A.-R., B.Y.C., S.C., B.P., A.H., M.Schi, N.S., D.G., K.C., B.B.-P., M.M., M.N., R.M., M.H., J.A., E.A., G.H., L.T., A.V., M.K. are employees and shareholders of Novartis Pharma. M.R., C.R.T., T.R., R.M., and P.I. are former employees of Novartis. N.H.T. receives funding from the Novartis Research Foundation and is a scientific advisory board (SAB) member of Monte Rosa Therapeutics and an advisor to Zenith Therapeutics and Ridgeline. The remaining authors declare no competing interests.

Figures

Fig. 1
Fig. 1. DCAF1 ligand characterization for targeted protein degradation.
a RNAi gene effect score (Demeter2) extracted for WDR domain containing E3 ligases. Sample sizes represented by these scores range from a maximum 711 (DDB1) to a minimum 343 (FBXW12) cell line counts out of a maximum possible 712 cell lines. The complete list of these gene-sample counts is summarized in the Source data file. Box plots representing the interquartile range (IQR). The top and bottom of the box represent the 75 and 25th percentiles of the data, respectively, with a central line representing the median. Whiskers extend to the upper and lower fences: Upper fence = Q3 + (1.5 × IQR), Lower fence = Q1 − (1.5 × IQR). Outliers are depicted as individual diamond-shaped points beyond the upper and lower fences. b Histograms depicting Demeter2 scores per # of cell lines for CRBN (gray) and DCAF1 (blue). c Demeter2 scores for selected E3 ligases. Box size definitions are the same than for (a). d Structure of DCAF1 binder (13) and the control compound (13-N). e SPR binding data of surface immobilized DCAF1(WDR) and (13, blue) and (13-N, orange) as analytes. f TR-FRET assay binding data of DCAF1(WDR) and (13, blue) and (13-N, orange) as analytes. Data represents the average and standard deviation of four replicates. g Affinity (KD) determined by SPR and IC50 determined by DCAF1 TR-FRET for selected DCAF1 binders. h Binding mode of (13) (orange) in DCAF1 (blue, pdb ID: 8OO5). The inlet with the cartoon depiction of DCAF1 highlights the location of the binding site in the WD40 domain of DCAF1. Shown in the remaining part is a detailed view of selected amino acids interacting with the compound. Hydrogen bonds are indicated as dashes. i Chemical proteomics describing the protein interactome of (16) in HEK293T cell lysate: Dot plot depicting competition of proteins from (16) beads by preincubation with free (16) as determined by quantitative proteomics from two independent replicates 1 and 2. Dotted line depicts cut-off at 50% competition. Source data are provided as a Source Data file.
Fig. 2
Fig. 2. DCAF1-BRD9 PROTAC characterization.
a Compound structures of BRD9 BD binder BI-9564 and corresponding DCAF1-BRD9 PROTAC (DBr-1). b TR-FRET assay binding data of DCAF1(WDR) and (DBr-1, blue) and (DBr-1 with additional 10 µM BRD9-BD(130-250), orange). c Affinity (KD) determined by SPR and IC50 determined by DCAF1 TR-FRET for DBr-1 and DBr-1 with additional 10 µM BRD9-BD(130-250). d Schematic description of SPR ternary binding assay. e SPR sensorgrams with surface immobilized DCAF1(WDR) and DBr-1 as analyte in the presence of 0.2 µM BRD9-BD(130-250). f SPR response blotted against DBr-1 concentration. (Displayed values indicate apparent KD values of the two separated sigmoidal transitions, respectively). g Immunoblot analysis of HEK293 BRD9-HiBiT/FF/CAS9 cells treated for 6 h with DBr-1 at various doses as well as (13) and BI-9564 at 1000 nM. h Immunoblot analysis of HEK293 BRD9-HiBit/FF/CAS9 cells treated with 1000 nM DBr-1 for various time points. i Immunoblot analysis of HEK293 BRD9-HiBiT/FF/CAS9 cells pretreated with NEDD8 E1 inhibitor (NAE1i) [1000 nM], proteasome inhibitor Bortezomib (26Si) [1000 nM] and Ubiquitin E1 inhibitor (UAE1i) [1000 nM] for 2 h, followed by DBr-1 treatment [1000 nM] for additional 2 h. Source data are provided as a Source Data file.
Fig. 3
Fig. 3. Comparison of different BRD9 PROTACs.
a Compound structures of the DCAF1-BRD9 PROTAC DBr-1, the VHL-BRD9 PROTAC VZ185 and the CRBN-BRD9 PROTAC dBRD9. b Immunoblot analysis of HEK293 BRD9-HiBiT/FF/CAS9 cells treated for 2 h with DBr-1, VZ185, and dBRD9 at various doses. c BRD9-HiBiT and BRD7-HiBiT signal detection of samples treated for 2 h with DBr-1, VZ185, and dBRD9 at various doses, DC50 values and maximal observed degradation are shown below. Data represents mean ± standard deviation from n = 3 replicates. Source data are provided as a Source Data file.
Fig. 4
Fig. 4. Genetic characterization of the DCAF1-BRD9 PROTAC DBr-1.
a BRD9-HiBiT signal detection of samples pretreated with 1 μM of either NAE1i, 26Si, or UAE1i, followed by 2 h DBr-1 treatment at various doses, DC50 = 193 nM. Data represents mean ± SEM from n = 4 replicates. b Relative BRD9-HiBiT vs Firefly signal ratio normalized to non-treated DMSO ctrl after 2 h of DBr-1 treatment [1000 nM]. Indicated gene editing with sgRNA has been performed as described 6 days before treatment. Data represents mean ± standard deviation from n = 8 replicates. c Schematic representation and timeline for Ubiquitin-sublibrary sgRNA rescue screen for DCAF1-BRD9 PROTAC DBr-1. d Ubiquitin sgRNA sublibrary rescue scores from DBr-1 treatment plotted as significance of rescue P value (y-axis) vs. max. rel. change. Dotted lines at −4 and −3 log10 P value indicate strong and weaker hits with a false-discovery rate of 7%. For detailed description of the statistical procedure see the “Method” section. e Relative BRD9-HiBiT vs Firefly signal ratio normalized to non-treated DMSO ctrl after 2 h of DBr-1 treatment [1000 nM]. Indicated gene editing with individual sgRNAs or a combination of two guides for CUL4A and CUL4B (CUL4A + B) has been performed as described 6 days before treatment. Data represents mean ± standard deviation from n = 4 replicates. Source data are provided as a Source Data file.
Fig. 5
Fig. 5. DCAF1-Dasatinib PROTAC degrades multiple tyrosine kinases.
a Compound structure of the DCAF1-Dasatinib PROTAC DDa-1 and a CRBN-Dasatinib ctrl PROTAC CDa-1. b Immunoblot analysis of HEK293T cells treated for 6 h with DDa-1 at 50, 500, and 5000 nM as well as (13) and Dasatinib (Das) at a dose of 5000 nM as control. Indicated co-treatments with NEDD8 E1 inhibitor (NAE1i) [1000 nM] and proteasome inhibitor Bortezomib (26Si) [1000 nM] are indicated. CRBN-Dasatinib degrader CDa-1 [50 nM] served as an internal ctrl degrader. c Whole proteomics profile comparing differential protein levels between 5 µM DCAF1-Dasatinib PROTAC DDa-1 vs 5 µM DCAF1 binder (13) after 6 h in HEK293T cells (n = 3) plotted as log2 fold change (L2FC, x-axis) versus adjusted p value (q value, y axis). Horizontal dotted line indicates q value 10−2, vertical lines indicate a log2 fold change of 0.5. d Immunoblot analysis of TMD8 cells treated for 24 h with DDa-1 at various doses as well as (13) and Dasatinib (Das) at a dose of 2000 nM as control. CRBN-Dasatinib degrader CDa-1 [50 nM] served as an internal ctrl degrader. e Degradation of BTK-GFP in TMD8 BTK-GFP/mCh cells after 24 h DDa-1 treatment displayed as normalized rel. change of the ratio between BTK-GFP and mCherry (mCh) signals (blue curve), DC50 = 0.09 µM. Viability after 24 h DDa-1 treatment is displayed as rel. change in cellular distribution between viable and apoptotic FSC/SSC gate, GI50 = 1.20 µM. The viability window as the ratio between GI50/DC50 = 13.1 is indicated with dotted vertical lines. Data shown in the graph represents mean ± standard deviation from n = 3 replicates. Source data are provided as a Source Data file.
Fig. 6
Fig. 6. Characterization and discovery of DCAF1-BTK PROTACs.
a Chemical structures of the DCAF1-BTK PROTACS DBt5 and DBt-10. b Characterization summary of various assays profiling the DCAF1-BTK PROTACs DBt5 and DBt-10. c Overlay of SPR ternary complex formation assays (dashed lines, left y-axis) with biochemical ubiquitination rates of DCAF1 measured in ubiquitin-transfer based TR-FRET assay (right y-axis, mean ± standard deviation from n = 3 replicates). d BTK degradation and cellular viability (dashed lines) assessed in BTK-GFP/mCh TMD8 cells after 24 h. The data points have been normalized to DMSO controls and each point represents the average and standard deviation of three independent experiments in triplicates. The viability window as the ratio between GI50/DC50 is indicated with dotted vertical lines. e Immunoblot analysis of TMD8 cells treated with 1 µM DBt-10 for 1, 3, 6, and 24 h time points, treated with various doses of D Bt-10 for 6 h and TMD8 cells pretreated with proteasome inhibitor Bortezomib (26Si) [1000 nM], Ubiquitin E1 inhibitor (UAE1i) [1000 nM] and NEDD8 E1 inhibitor (NAE1i) [1000 nM] for 30 min, followed by DBt-10 treatment [2500 nM] for additional 6 h. f Proteomic analysis of TMD8 cells treated (n = 3) for 6 h either with 5 µM DBt-10 or 5 µM (19). Highlighted are proteins with a log2 fold change <−0.5 and a q value < 0.01. Detected kinases are represented as squares, while all other proteins are shown as dots. Source data are provided as a Source Data file.
Fig. 7
Fig. 7. Characterization of DCAF1-based PROTACs in cells resistant to VHL or CRBN-mediated targeted protein degradation.
a Schematic illustration of examples of intrinsic and acquired resistance mechanisms to targeted protein degradation (TPD). b 768-O cells treated for 2 h with DBr-1, VZ185, and dBRD9 at various doses. Shown is the change of relative BRD9 abundance normalized to the DMSO control. Data represents average ± standard deviation of n = 3 replicates and calculated DC50 values of BRD9 are displayed. c Immunoblot analysis of TMD8 WT and TMD8 CRBN resistant cells after 0.1 µM CBt and 1 µM DBt-10 treatment for 24 h. d Viability measured by CellTiter-Glo for CBt, Ibrutinib (Ibru), BTKi (17) and DBt-10 in WT (solid) vs CRBN resist. (dotted) TMD8 cells. Data represents mean ± standard deviation from n = 3 replicates. Source data are provided as a Source Data file.

References

    1. Békés, M., Langley, D. R. & Crews, C. M. PROTAC targeted protein degraders: the past is prologue. Nat. Rev. Drug Discov.21, 181–200 (2022). 10.1038/s41573-021-00371-6 - DOI - PMC - PubMed
    1. Sakamoto, K. M. et al. Protacs: chimeric molecules that target proteins to the Skp1-Cullin-F box complex for ubiquitination and degradation. Proc. Natl Acad. Sci. USA98, 8554–8559 (2001). 10.1073/pnas.141230798 - DOI - PMC - PubMed
    1. Hughes, S. J. & Ciulli, A. Molecular recognition of ternary complexes: a new dimension in the structure-guided design of chemical degraders. Essays Biochem.61, 505–516 (2017). 10.1042/EBC20170041 - DOI - PMC - PubMed
    1. Buckley, D. L. et al. Targeting the von Hippel-Lindau E3 ubiquitin ligase using small molecules to disrupt the VHL/HIF-1α interaction. J. Am. Chem. Soc.134, 4465–4468 (2012). 10.1021/ja209924v - DOI - PMC - PubMed
    1. Bondeson, D. P. et al. Catalytic in vivo protein knockdown by small-molecule PROTACs. Nat. Chem. Biol.11, 611–617 (2015). 10.1038/nchembio.1858 - DOI - PMC - PubMed

Publication types

MeSH terms