

The 100-protein NMR spectra dataset: A resource for biomolecular NMR data analysis
- PMID: 38177162
- PMCID: PMC10767026
- DOI: 10.1038/s41597-023-02879-5
The 100-protein NMR spectra dataset: A resource for biomolecular NMR data analysis
Abstract
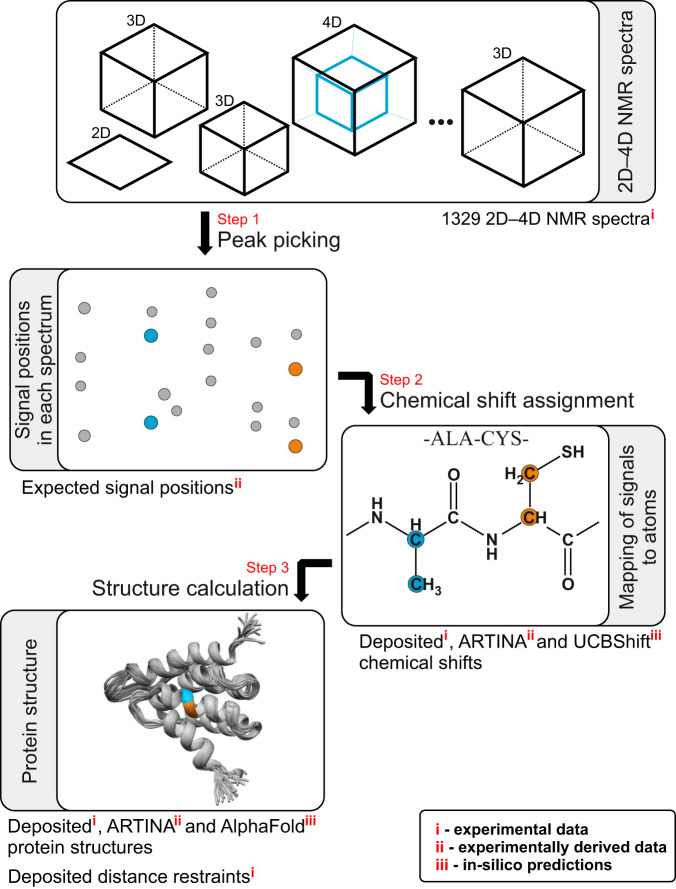
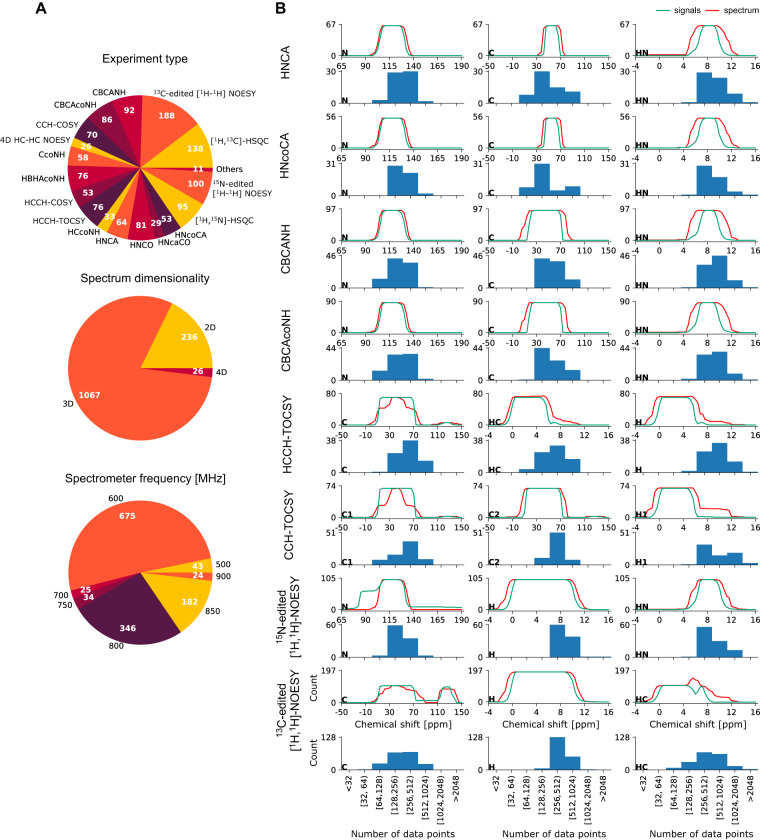
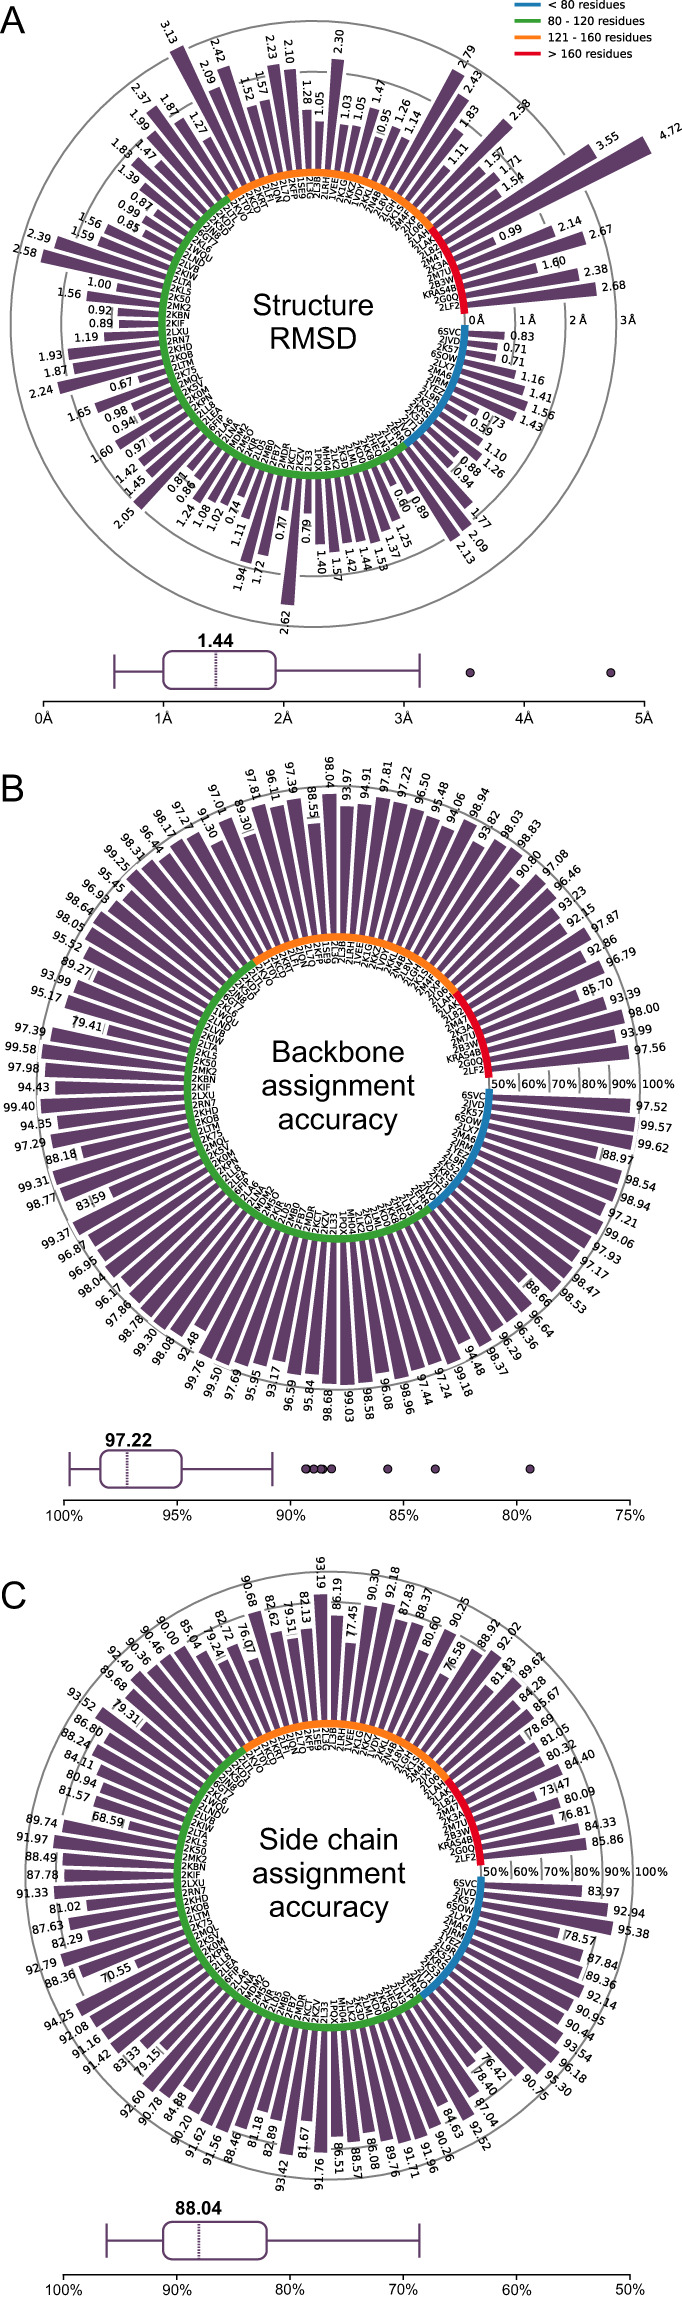
Multidimensional NMR spectra are the basis for studying proteins by NMR spectroscopy and crucial for the development and evaluation of methods for biomolecular NMR data analysis. Nevertheless, in contrast to derived data such as chemical shift assignments in the BMRB and protein structures in the PDB databases, this primary data is in general not publicly archived. To change this unsatisfactory situation, we present a standardized set of solution NMR data comprising 1329 2-4-dimensional NMR spectra and associated reference (chemical shift assignments, structures) and derived (peak lists, restraints for structure calculation, etc.) annotations. With the 100-protein NMR spectra dataset that was originally compiled for the development of the ARTINA deep learning-based spectra analysis method, 100 protein structures can be reproduced from their original experimental data. The 100-protein NMR spectra dataset is expected to help the development of computational methods for NMR spectroscopy, in particular machine learning approaches, and enable consistent and objective comparisons of these methods.
© 2024. The Author(s).
Conflict of interest statement
G.T.M. is a founder of Nexomics Biosciences, Inc. This does not represent a conflict of interest for this study. The other authors declare no competing interests.
Figures


Similar articles
-
Rapid protein assignments and structures from raw NMR spectra with the deep learning technique ARTINA.Nat Commun. 2022 Oct 18;13(1):6151. doi: 10.1038/s41467-022-33879-5. Nat Commun. 2022. PMID: 36257955 Free PMC article.
-
BioMagResBank (BMRB) as a Resource for Structural Biology.Methods Mol Biol. 2020;2112:187-218. doi: 10.1007/978-1-0716-0270-6_14. Methods Mol Biol. 2020. PMID: 32006287 Free PMC article.
-
Automated protein structure determination from NMR spectra.J Am Chem Soc. 2006 Oct 11;128(40):13112-22. doi: 10.1021/ja061136l. J Am Chem Soc. 2006. PMID: 17017791
-
NMR-based automated protein structure determination.Arch Biochem Biophys. 2017 Aug 15;628:24-32. doi: 10.1016/j.abb.2017.02.011. Epub 2017 Mar 2. Arch Biochem Biophys. 2017. PMID: 28263718 Review.
-
Automated structure determination from NMR spectra.Eur Biophys J. 2009 Feb;38(2):129-43. doi: 10.1007/s00249-008-0367-z. Epub 2008 Sep 20. Eur Biophys J. 2009. PMID: 18807026 Review.
Cited by
-
Super-resolution triple-resonance NMR spectroscopy for the sequential assignment of proteins.Sci Adv. 2025 Aug 15;11(33):eadv6246. doi: 10.1126/sciadv.adv6246. Epub 2025 Aug 15. Sci Adv. 2025. PMID: 40815649 Free PMC article.
References
Publication types
MeSH terms
Substances
Grants and funding
LinkOut - more resources
Full Text Sources
Medical
