. 2024 Jan;9(1):55-69.
doi: 10.1038/s41564-023-01560-2. Epub 2024 Jan 4.

Dietary- and host-derived metabolites are used by diverse gut bacteria for anaerobic respiration

Affiliations

Dietary- and host-derived metabolites are used by diverse gut bacteria for anaerobic respiration

Alexander S Little et al. Nat Microbiol. 2024 Jan.

Erratum in

Abstract

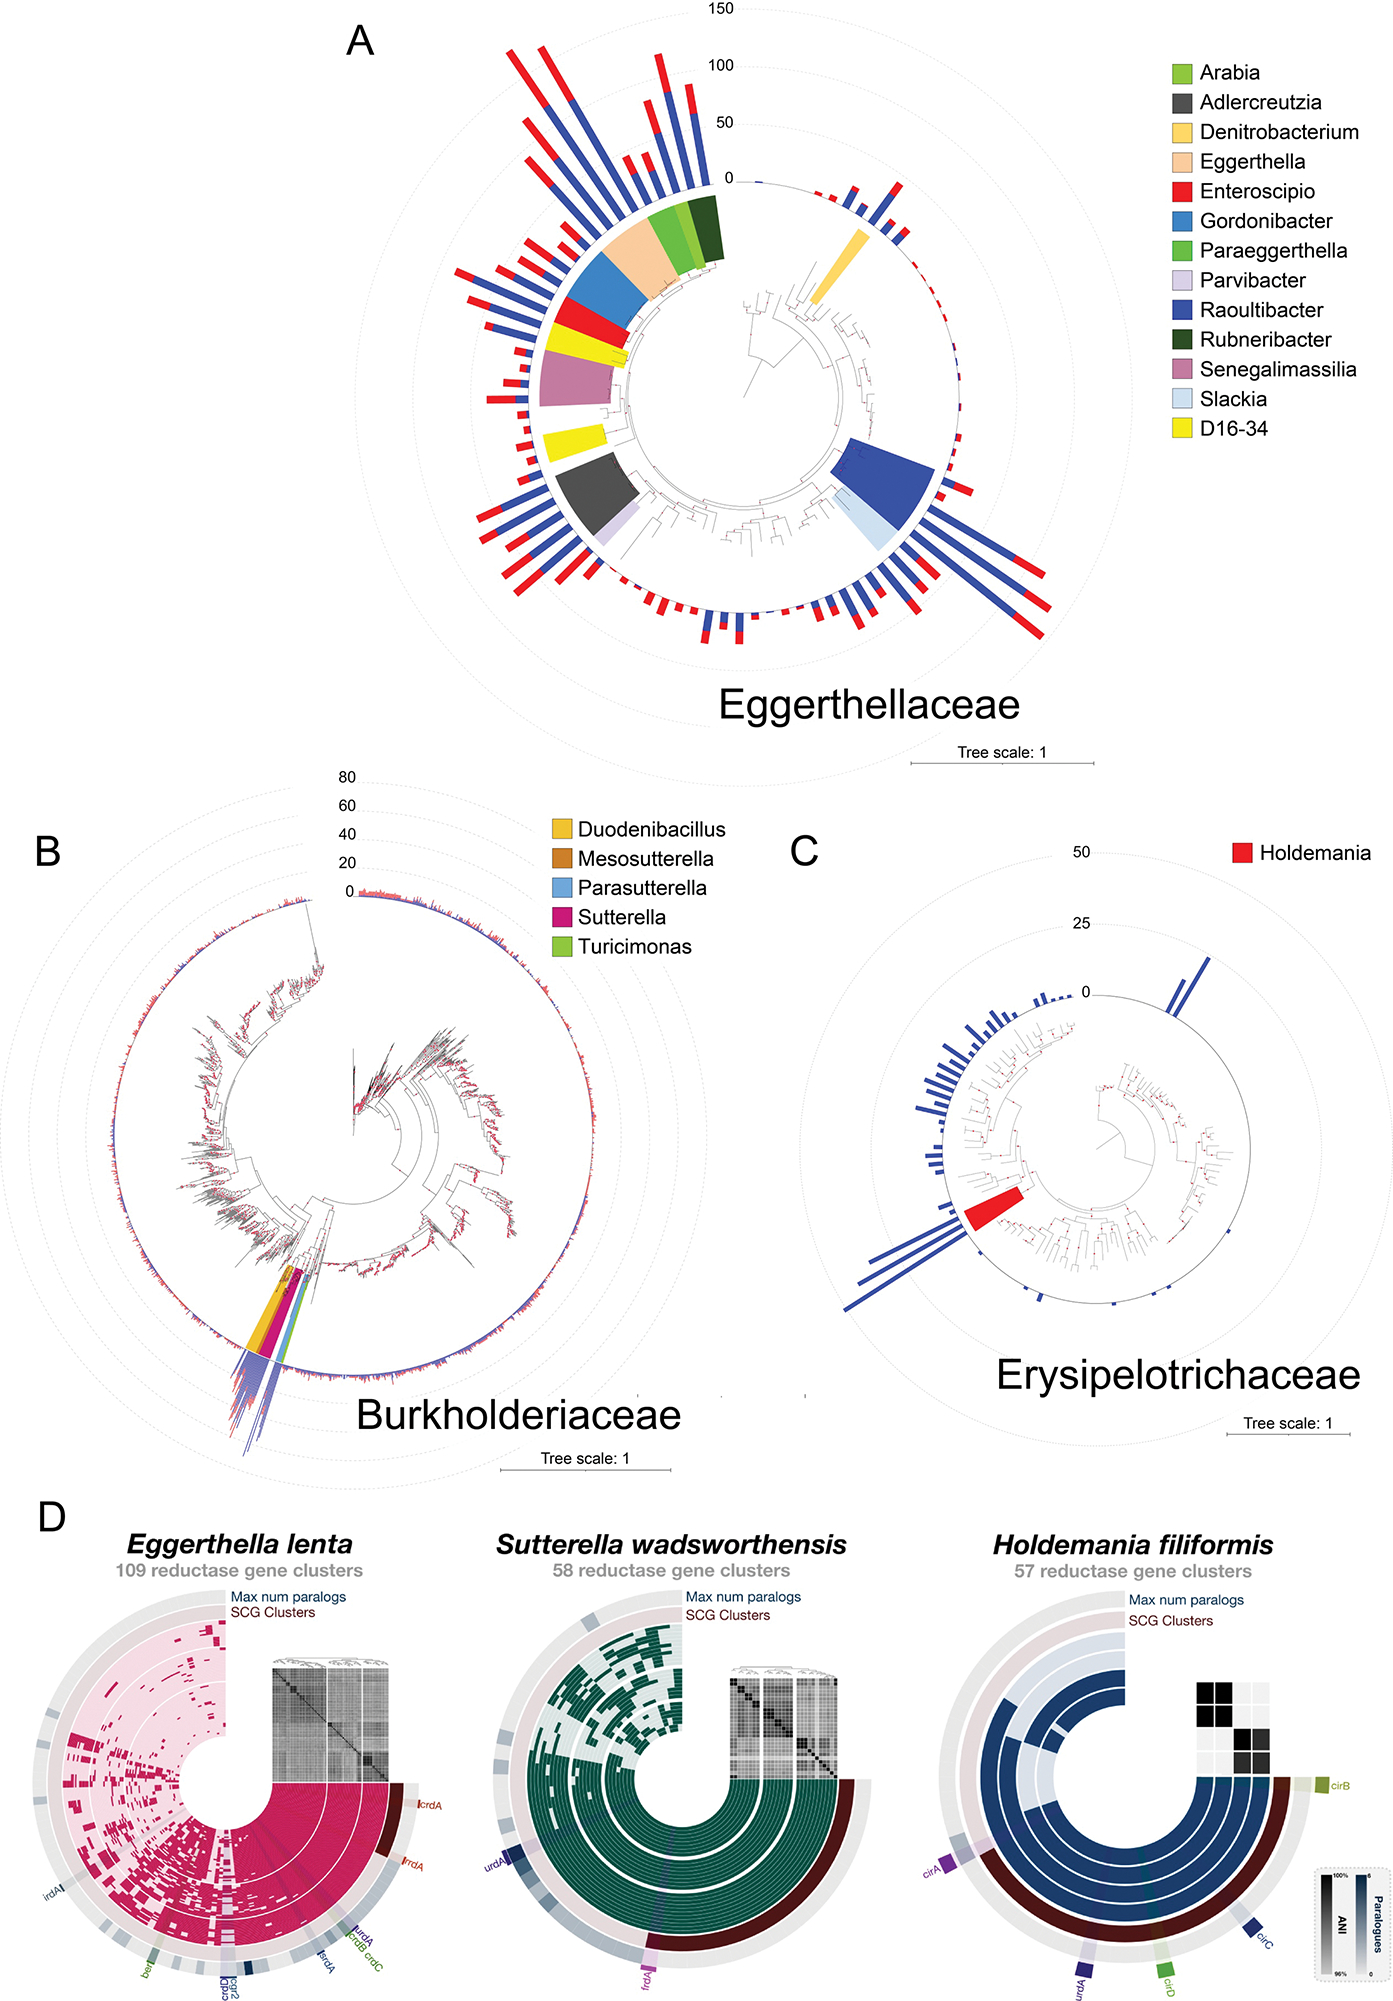
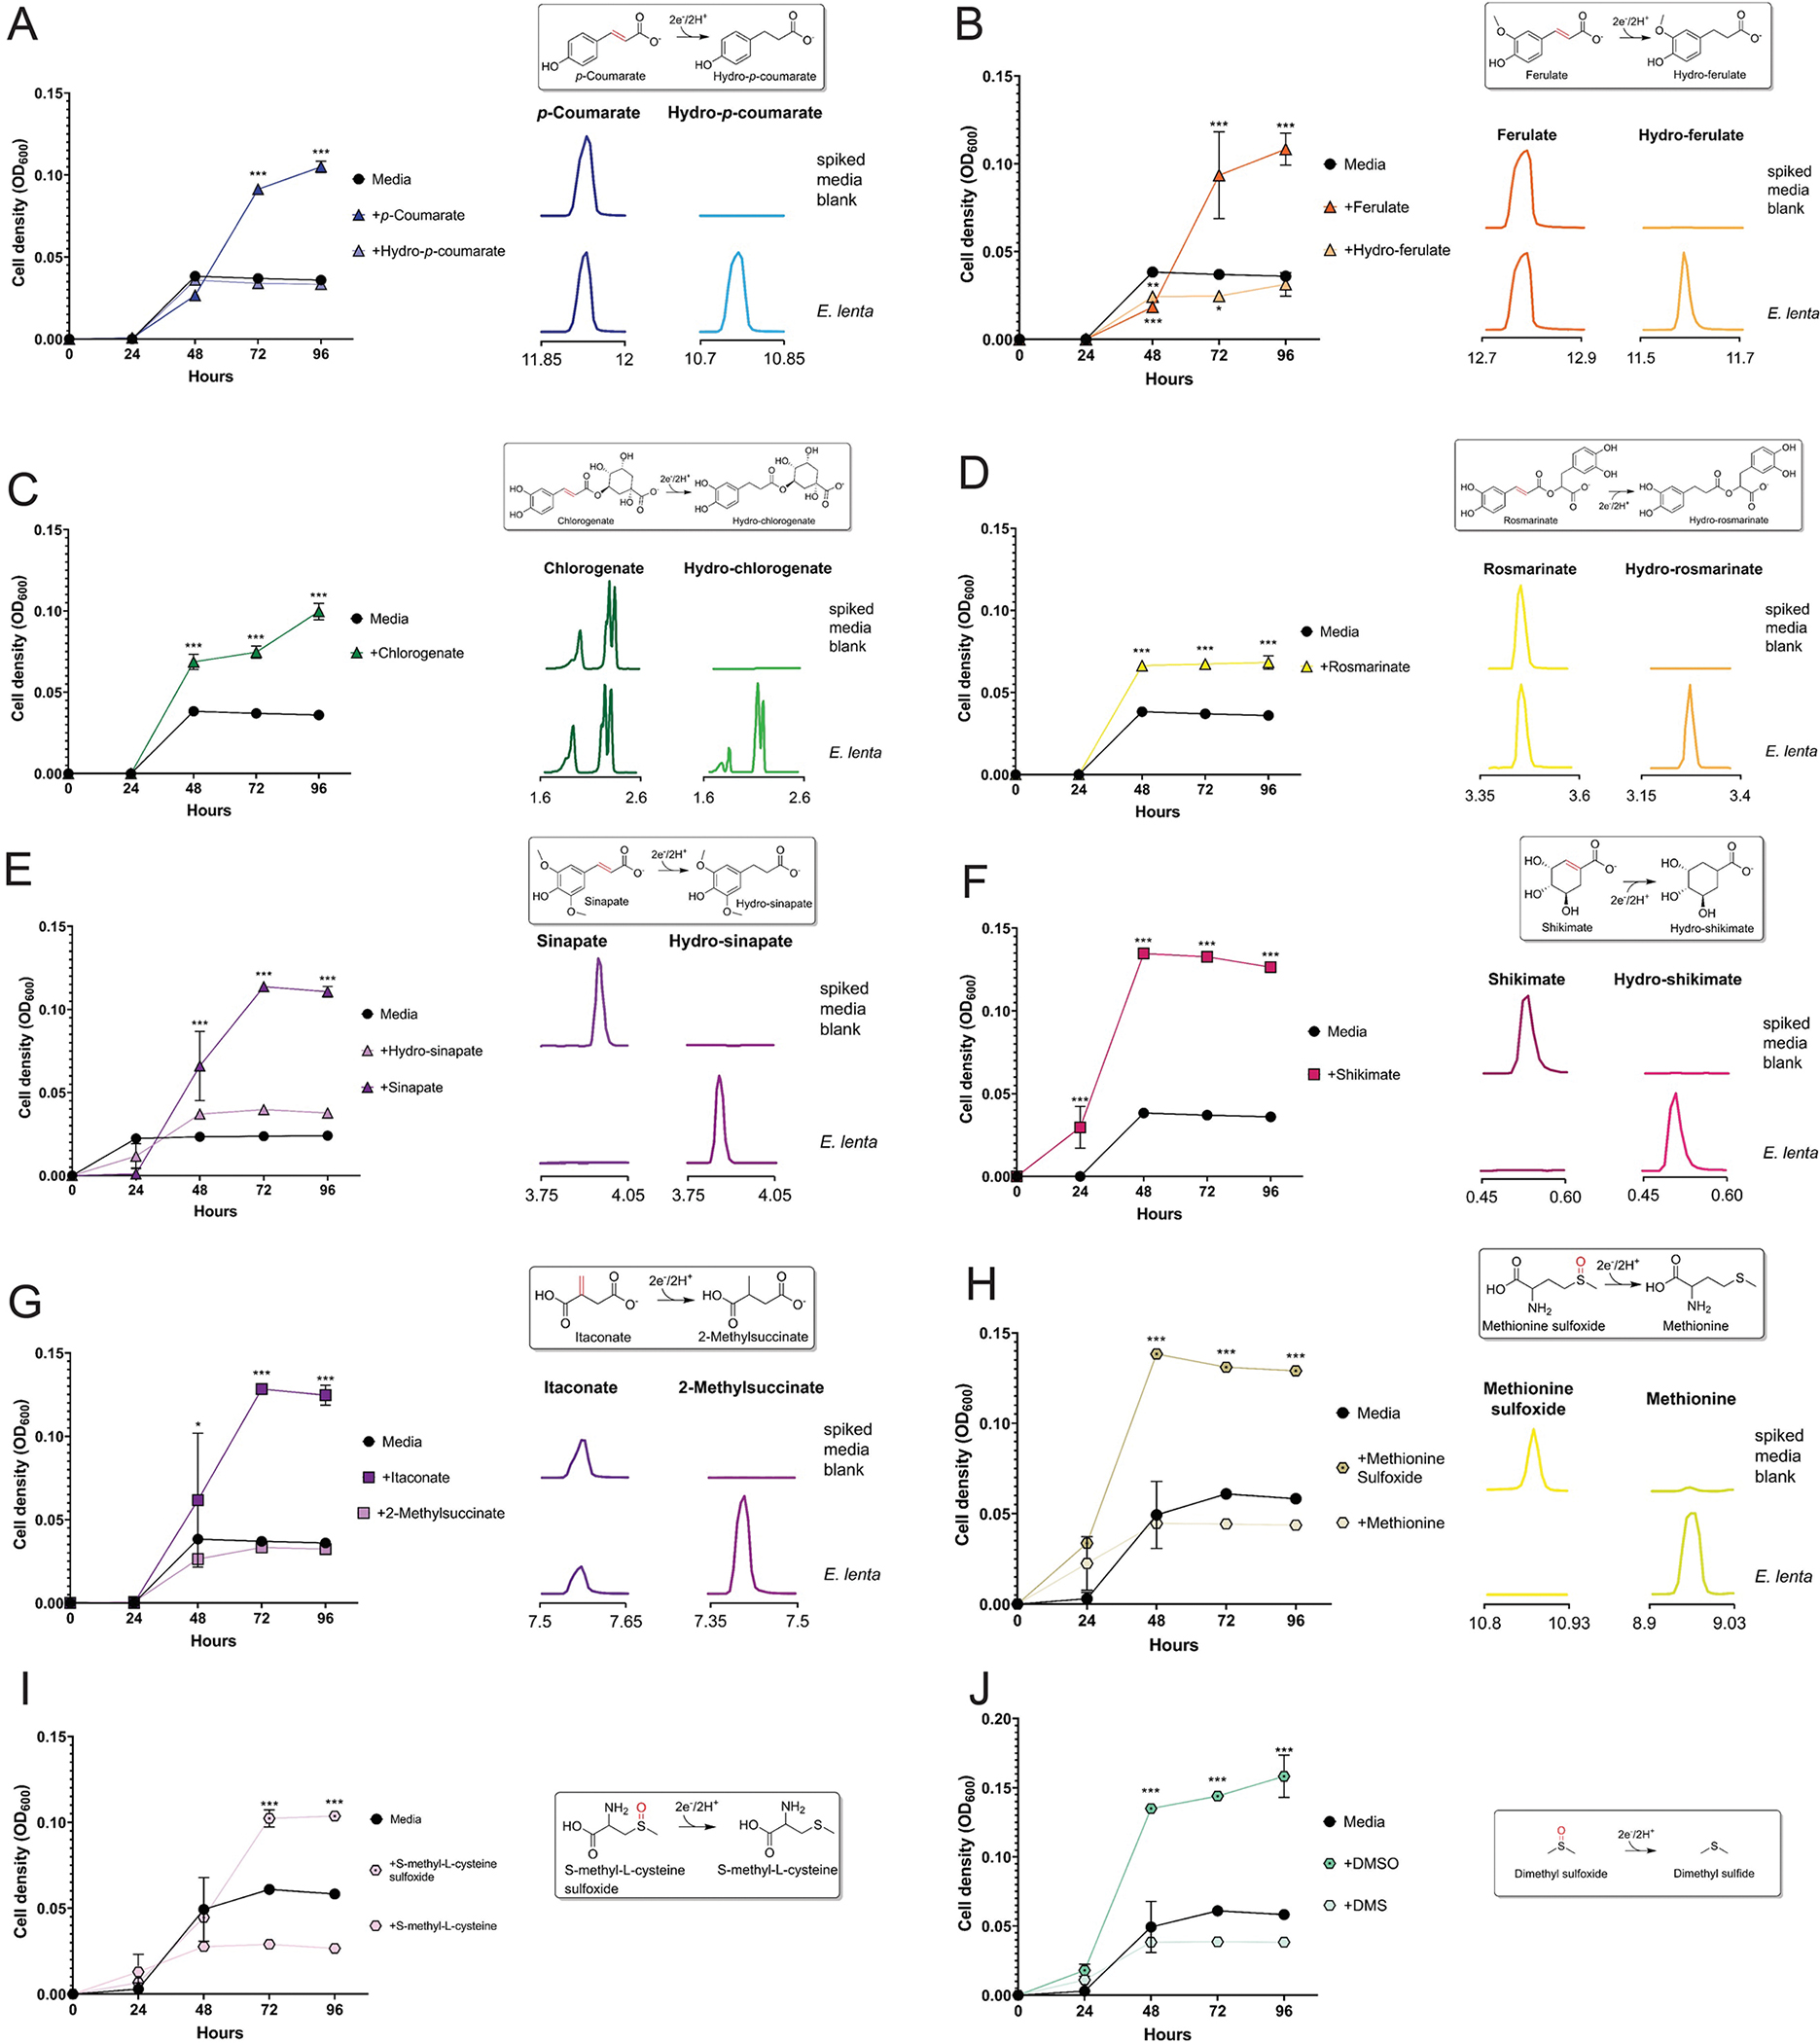
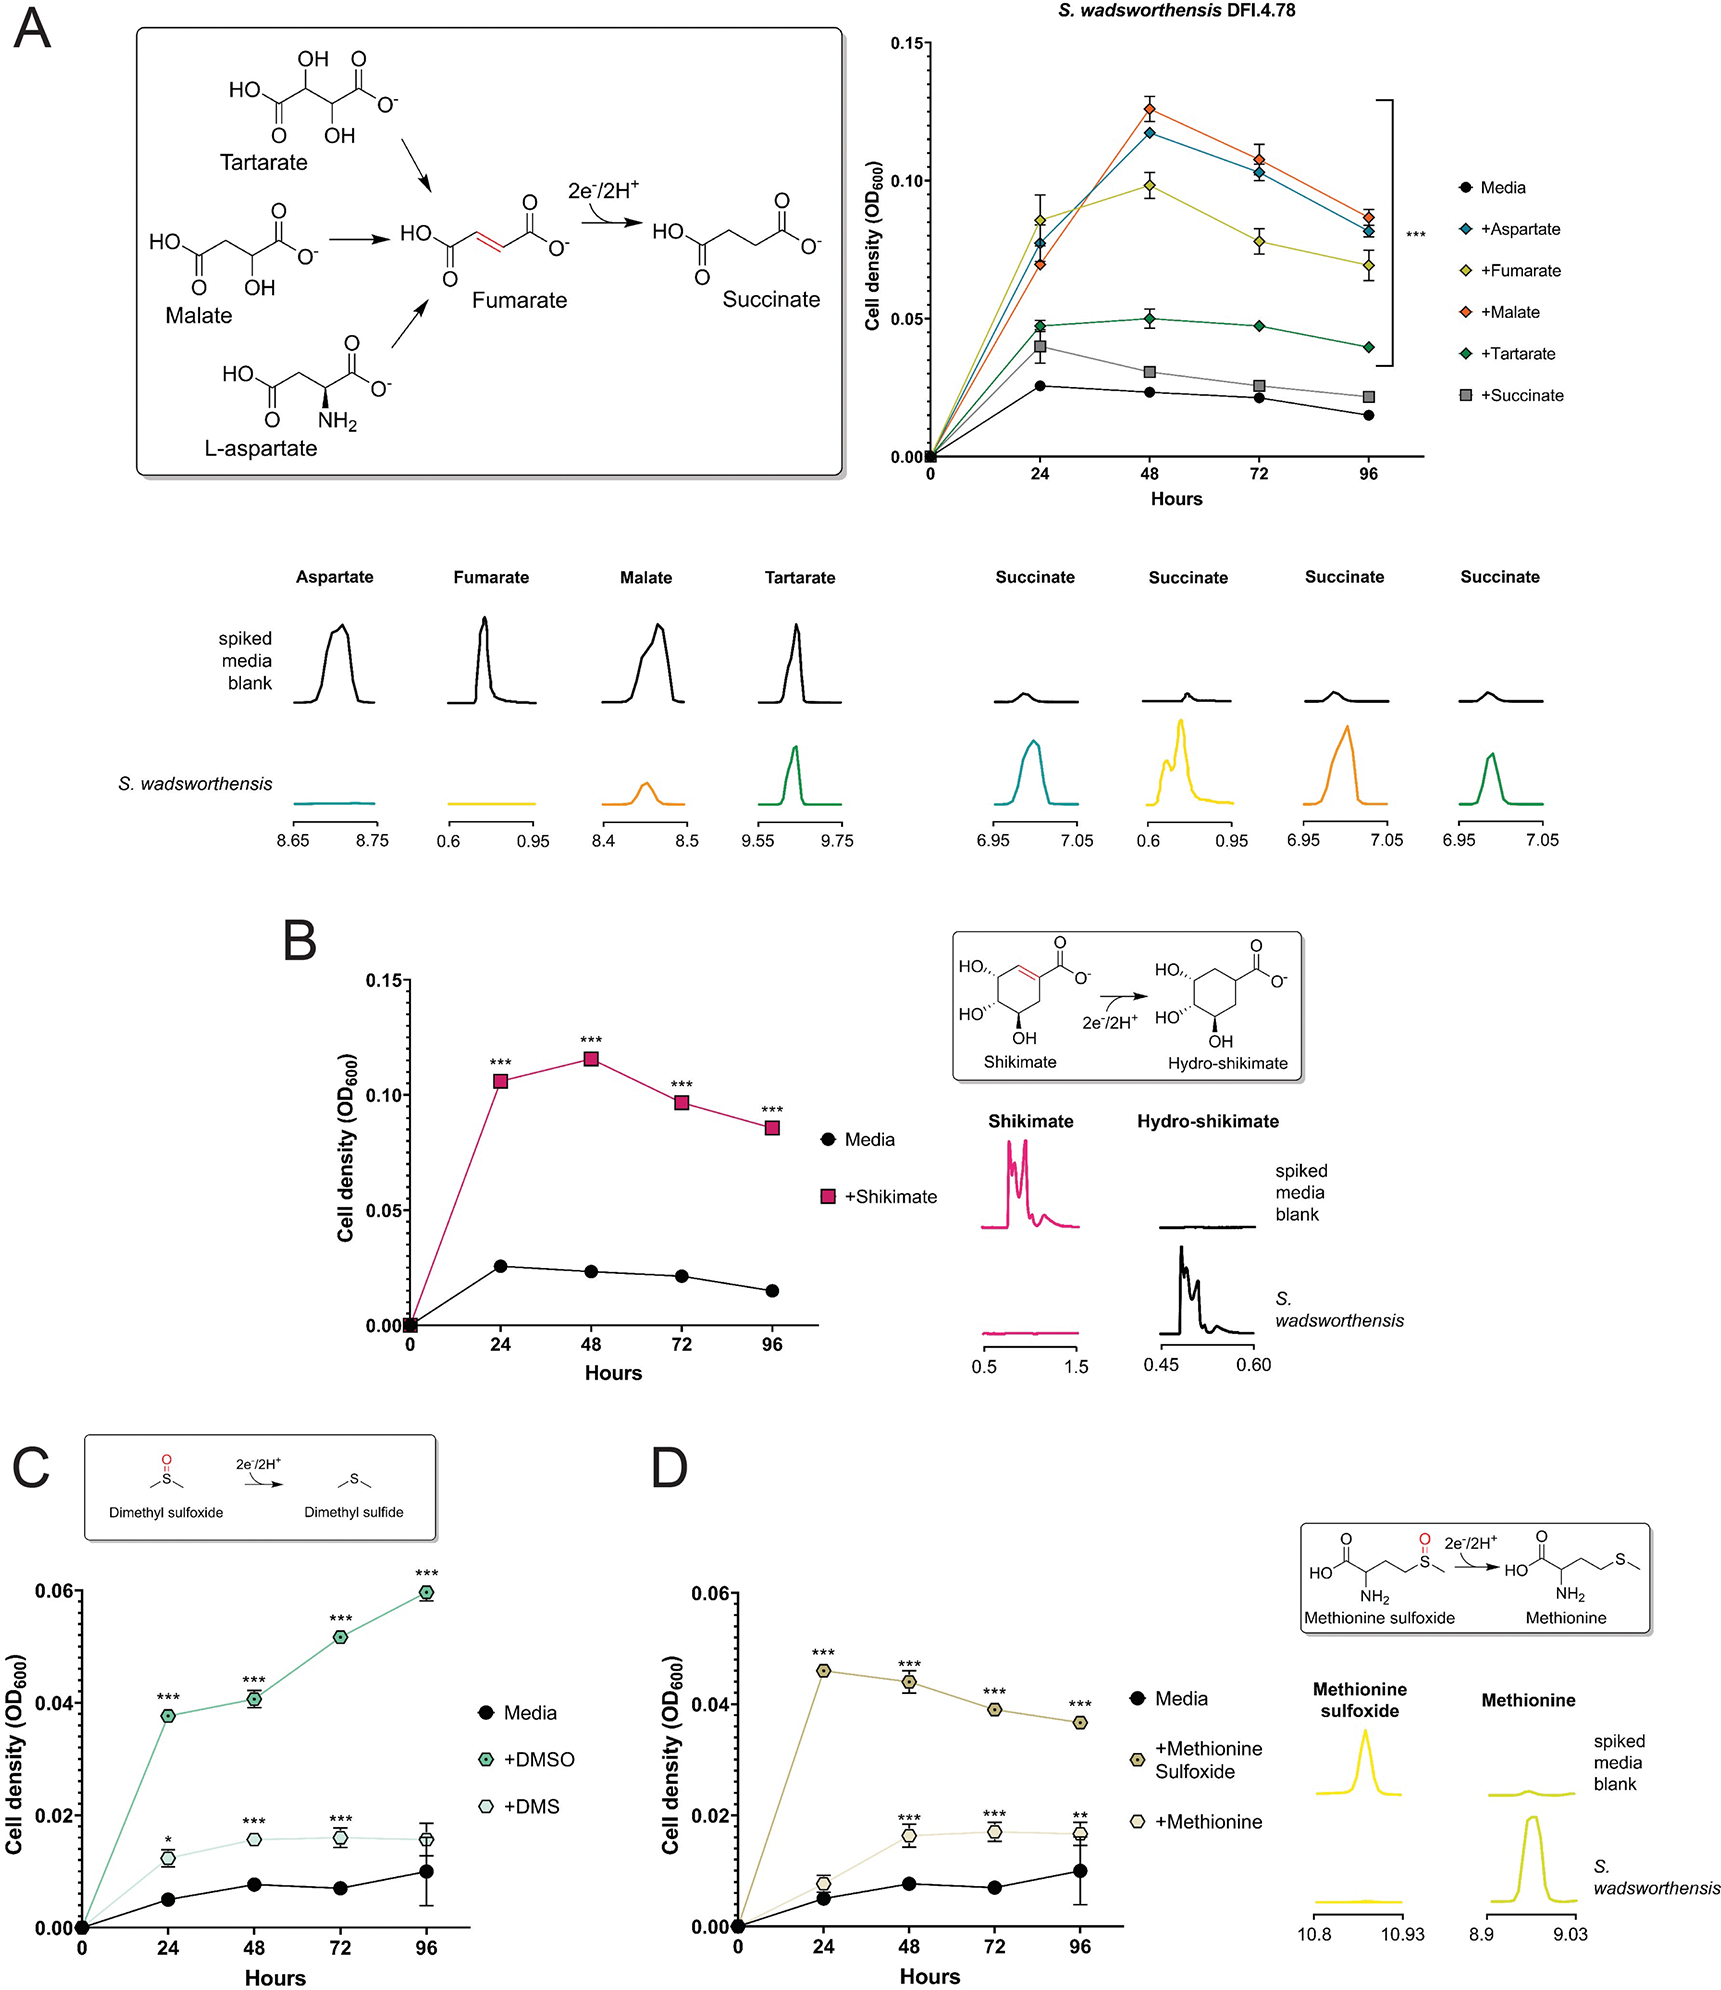
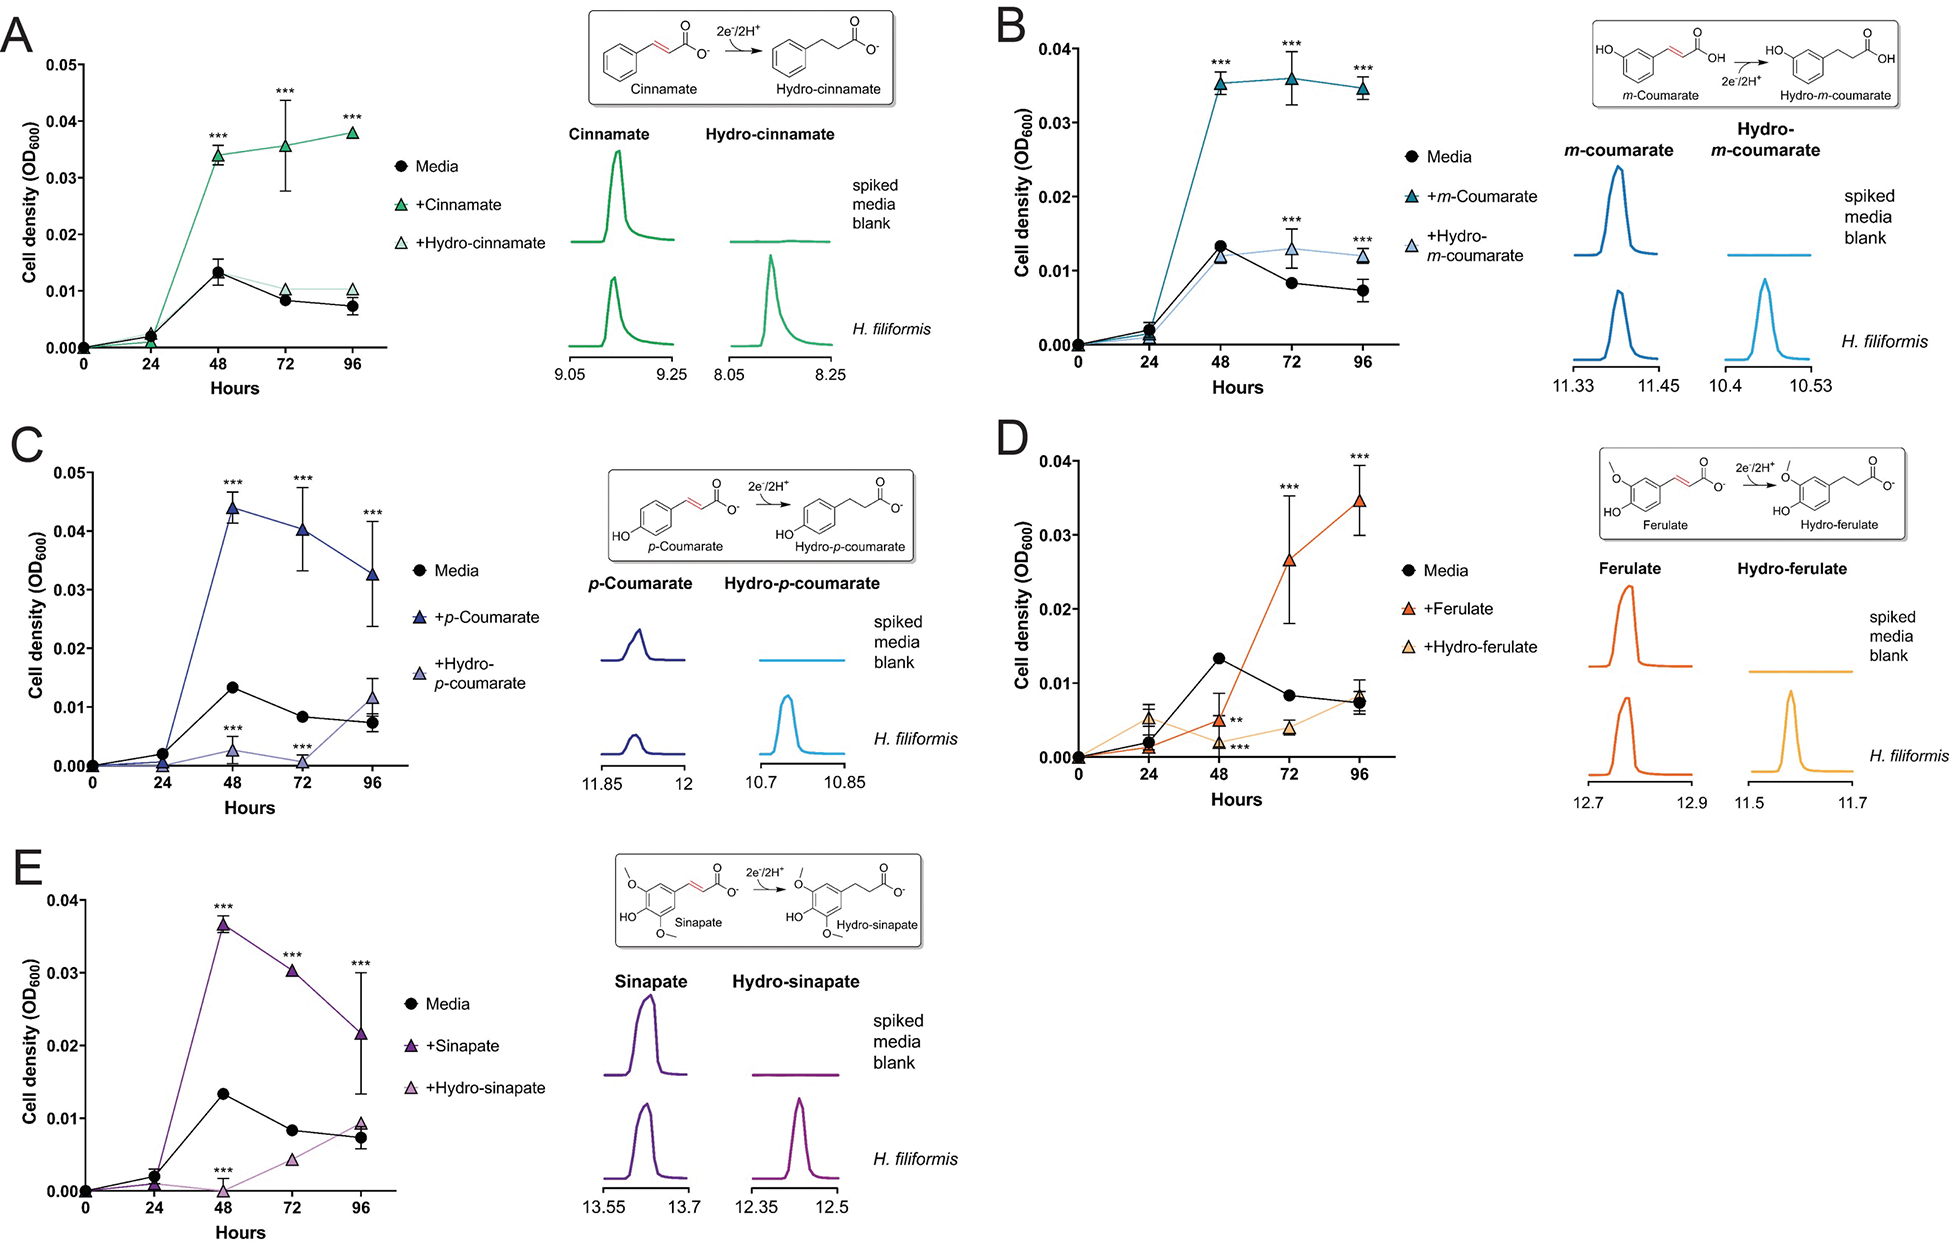
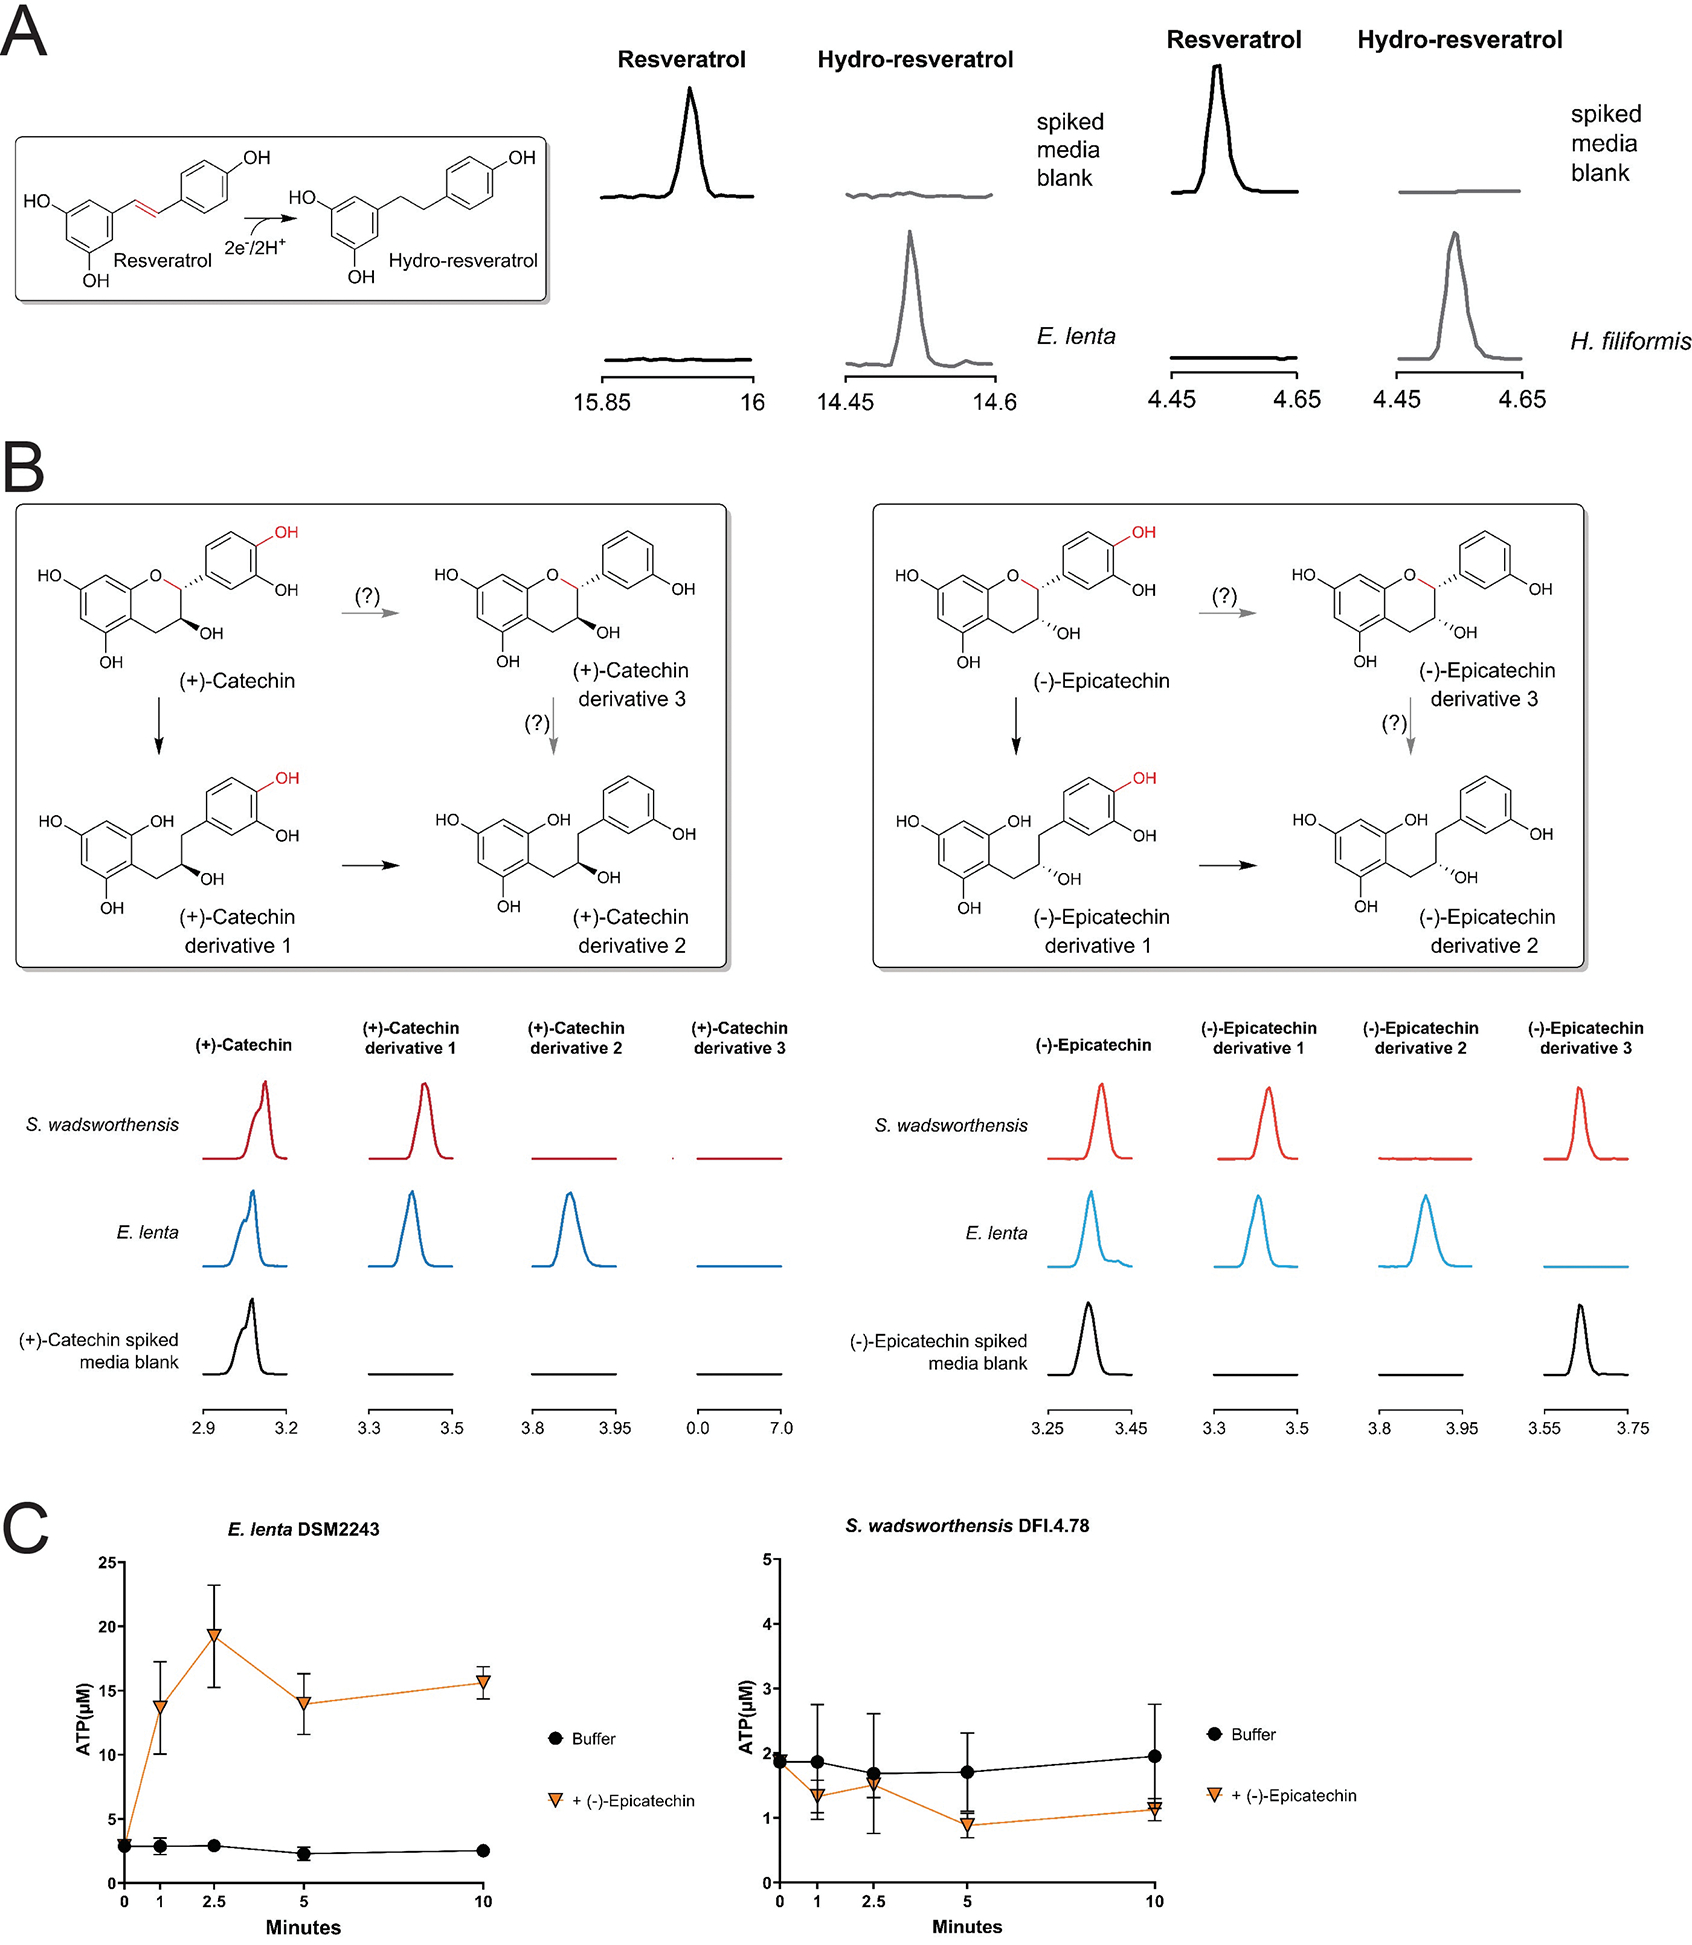
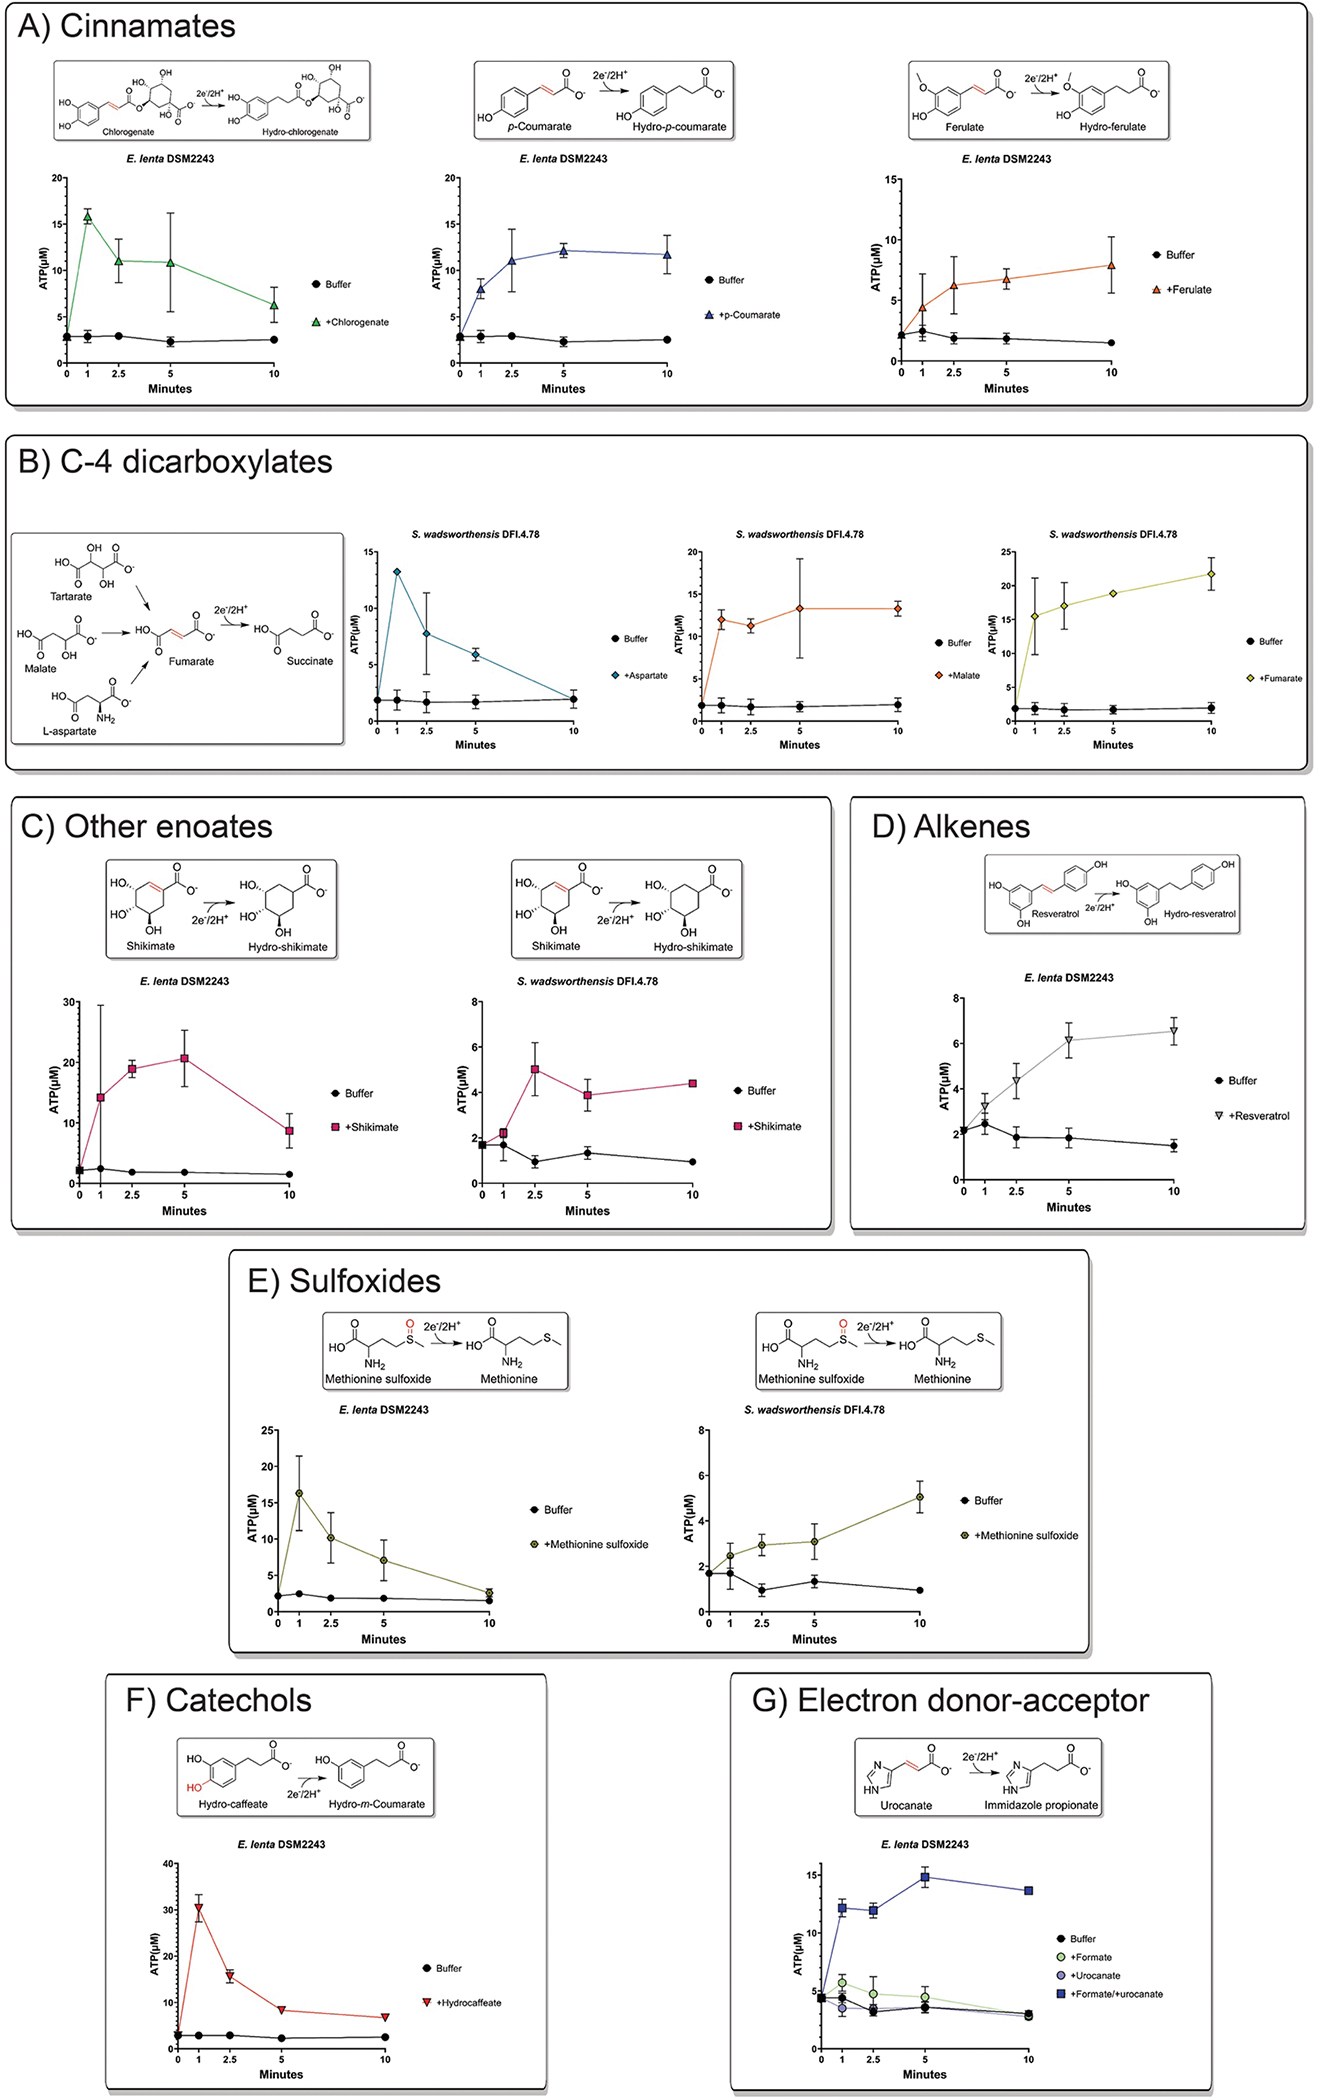
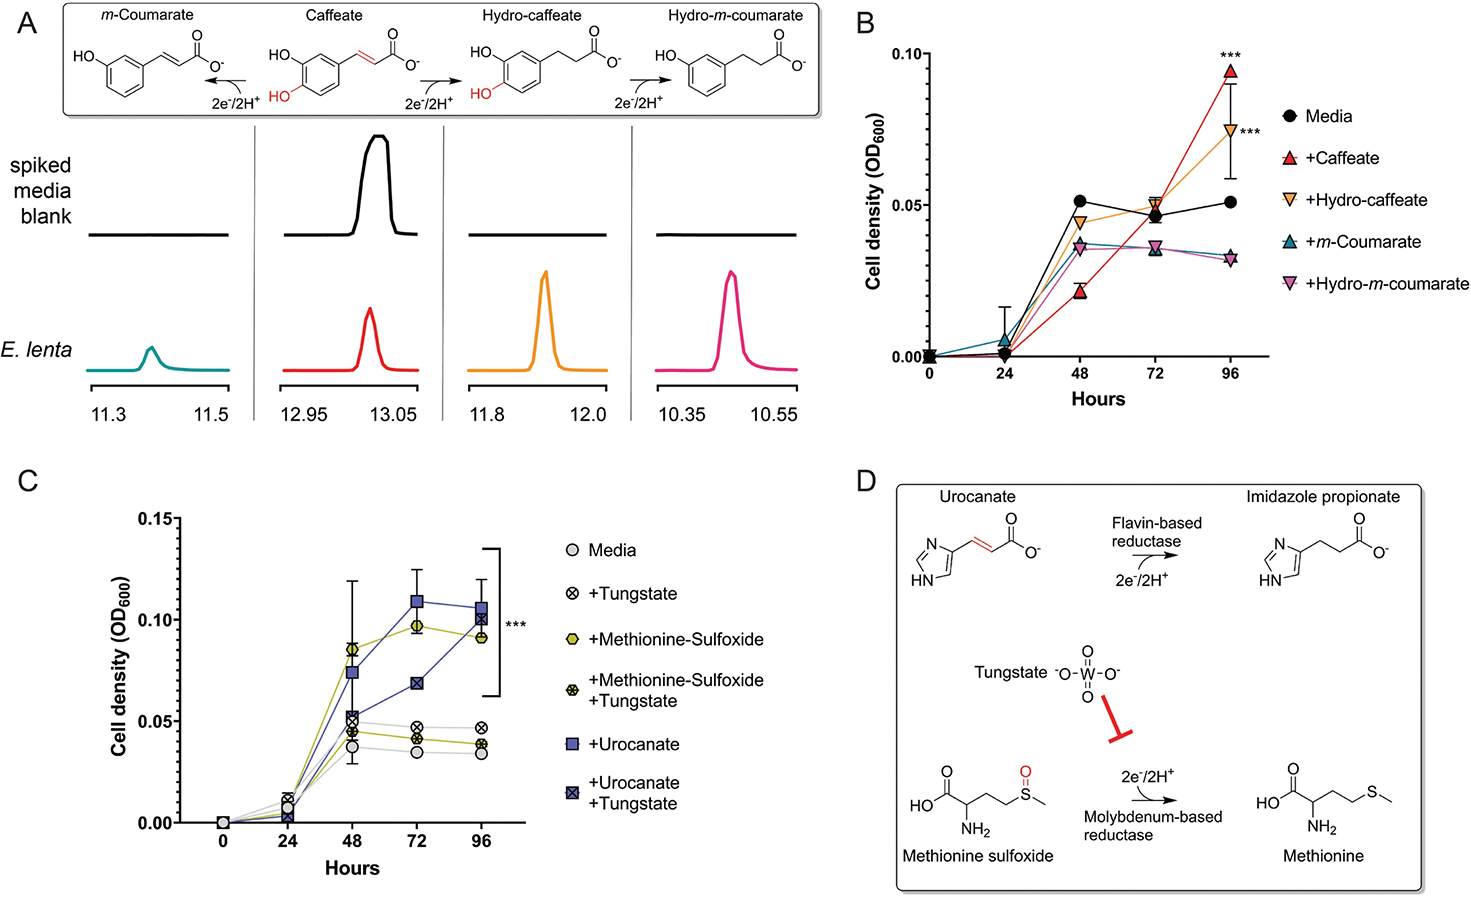
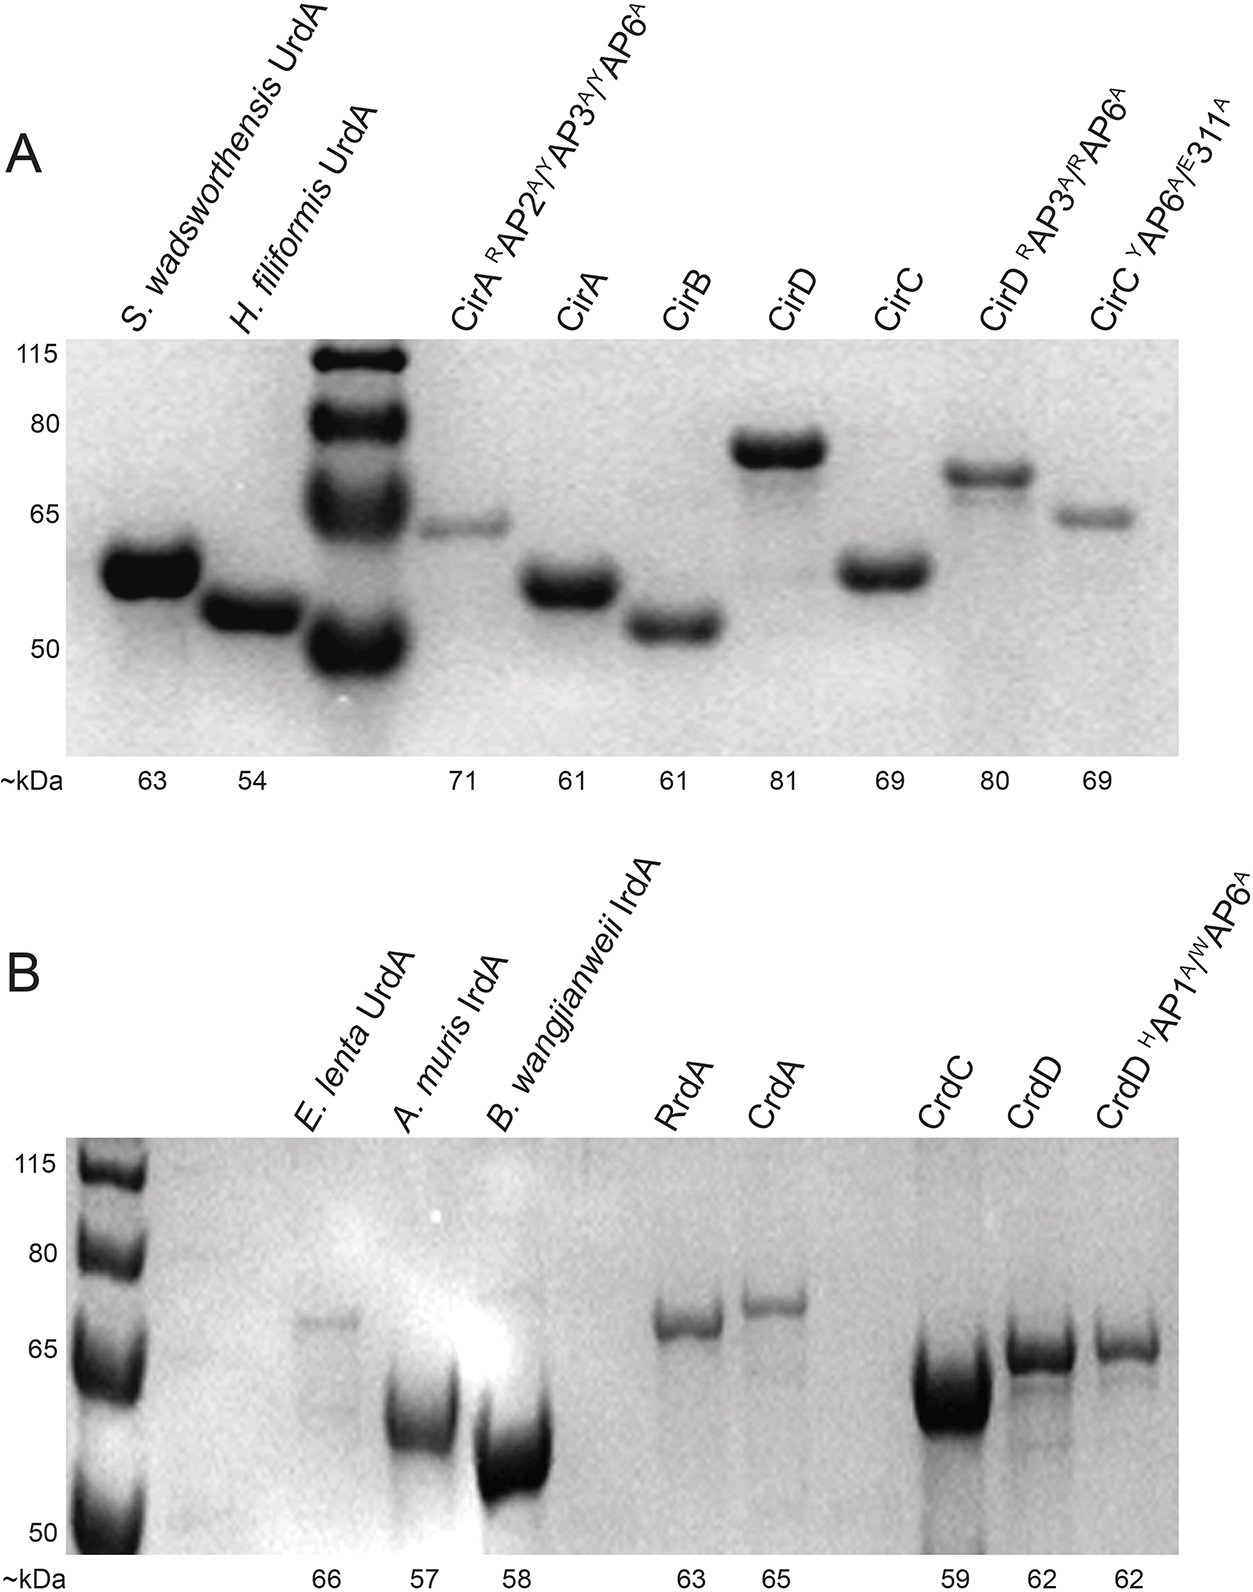
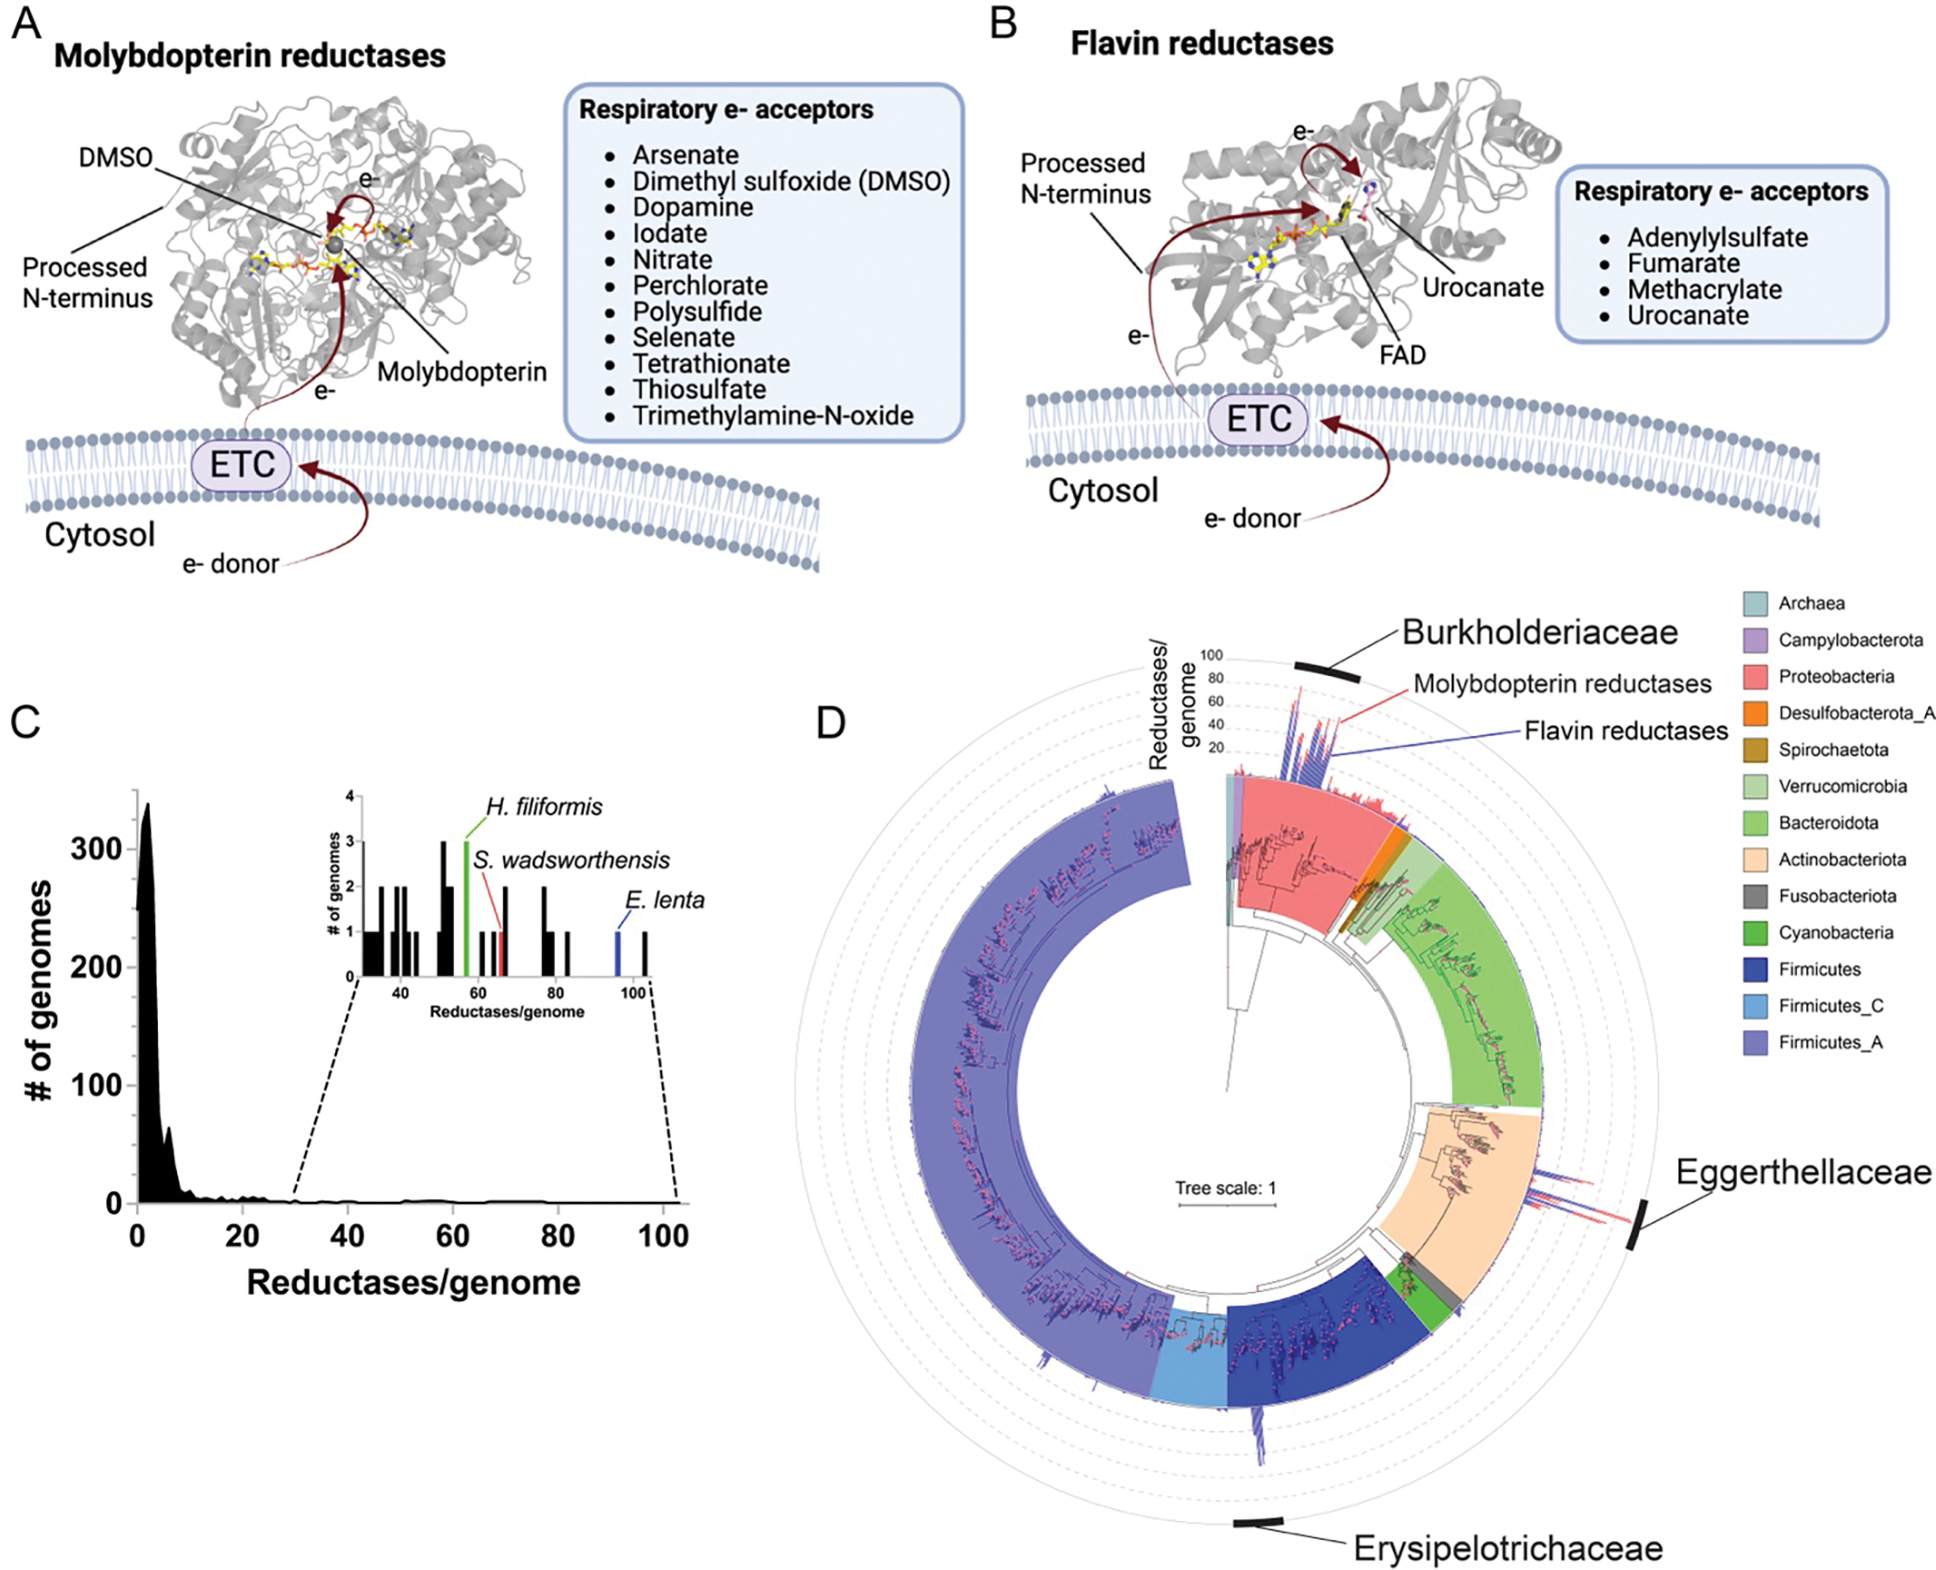
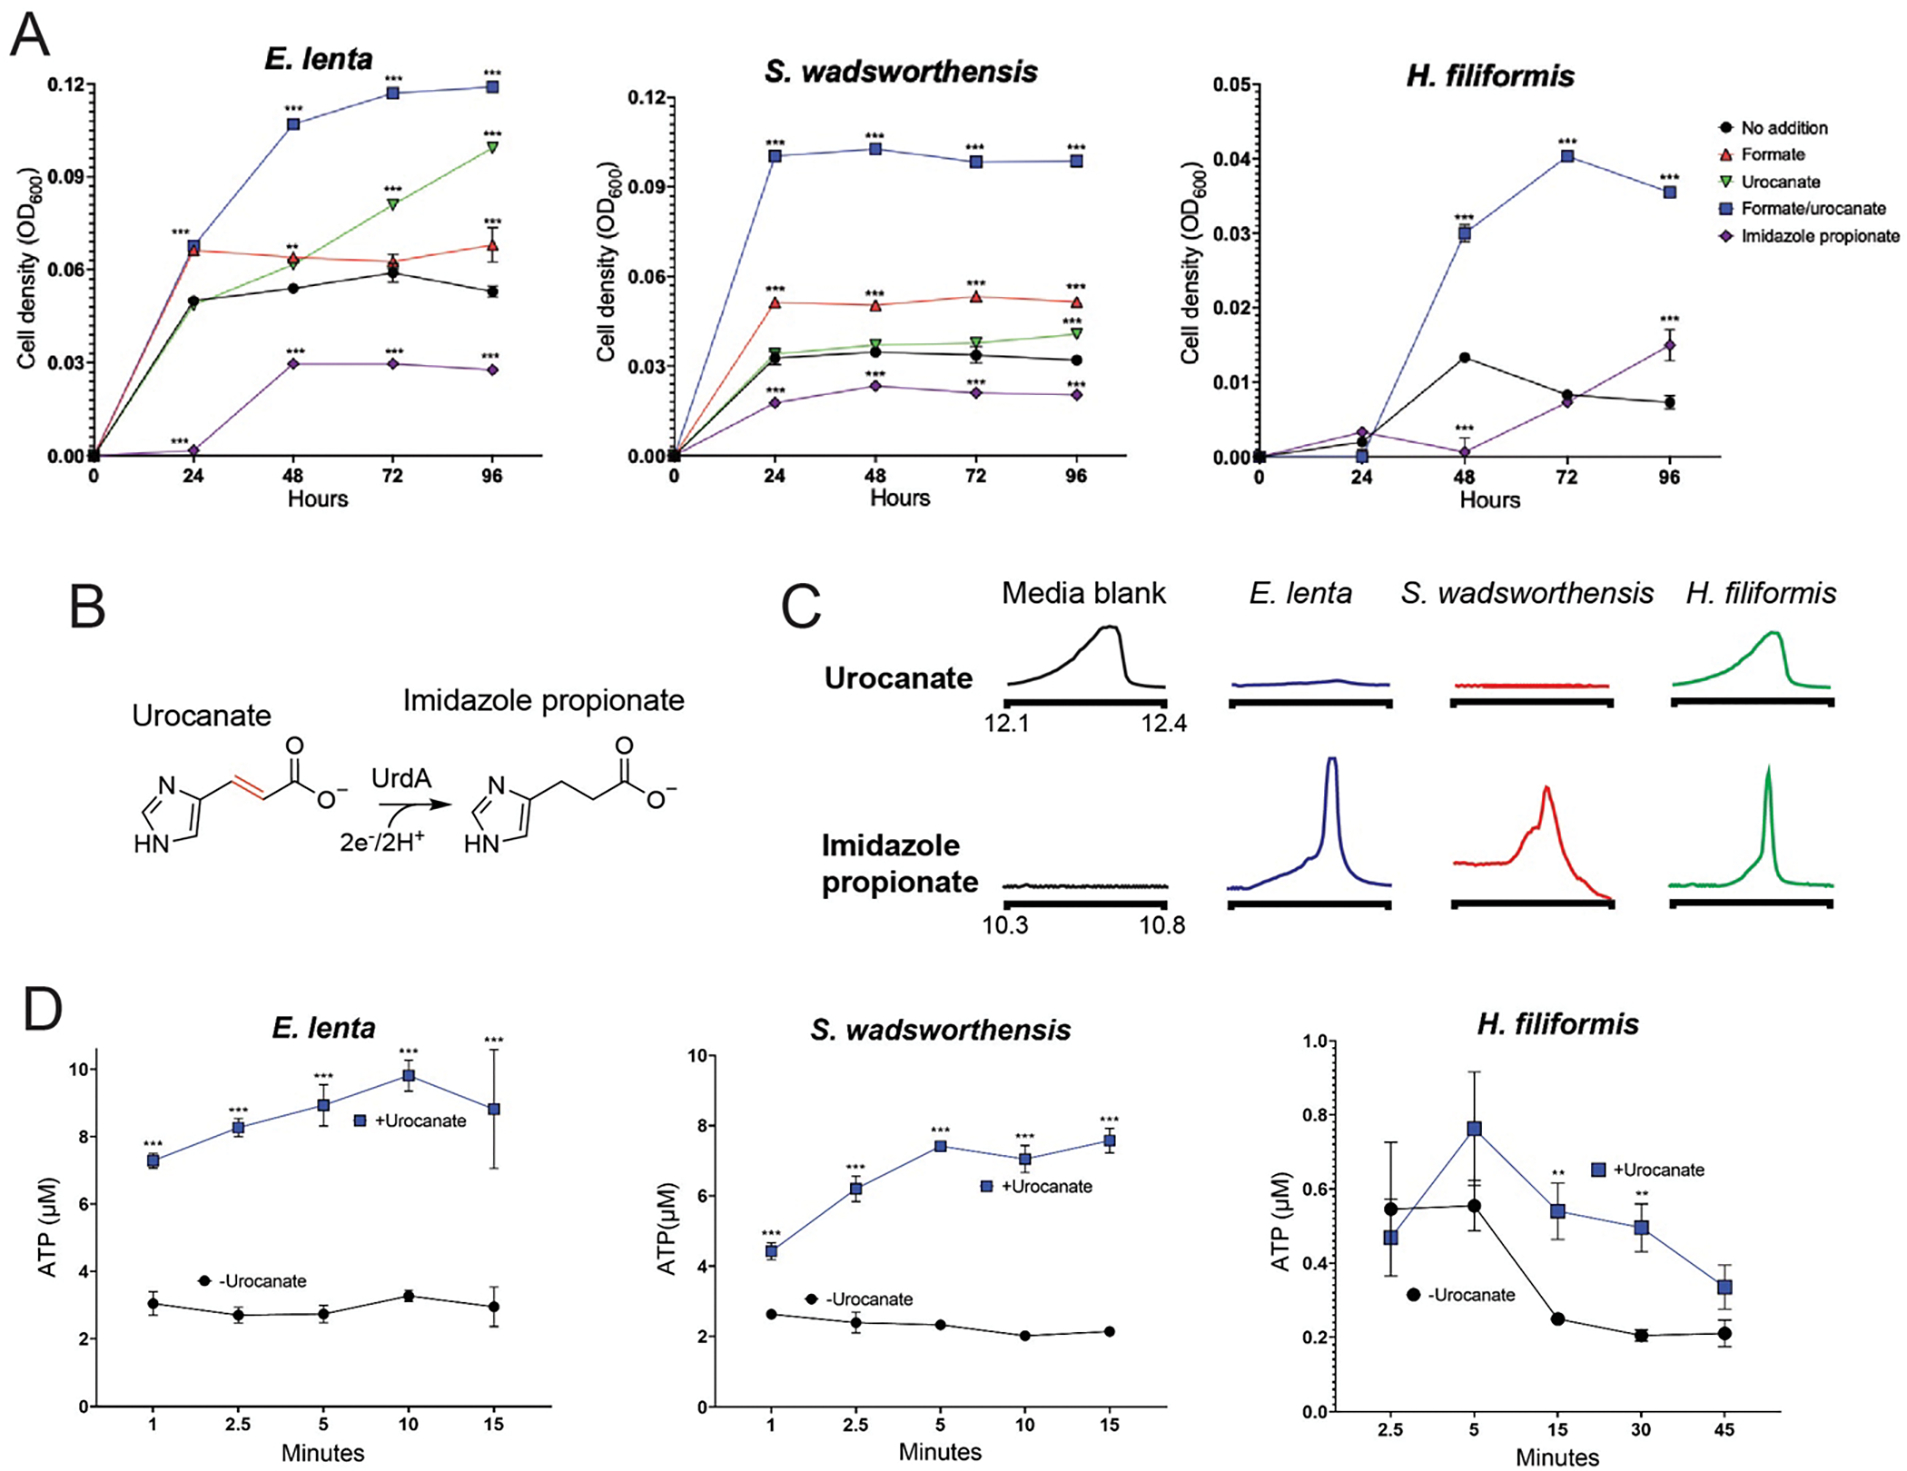
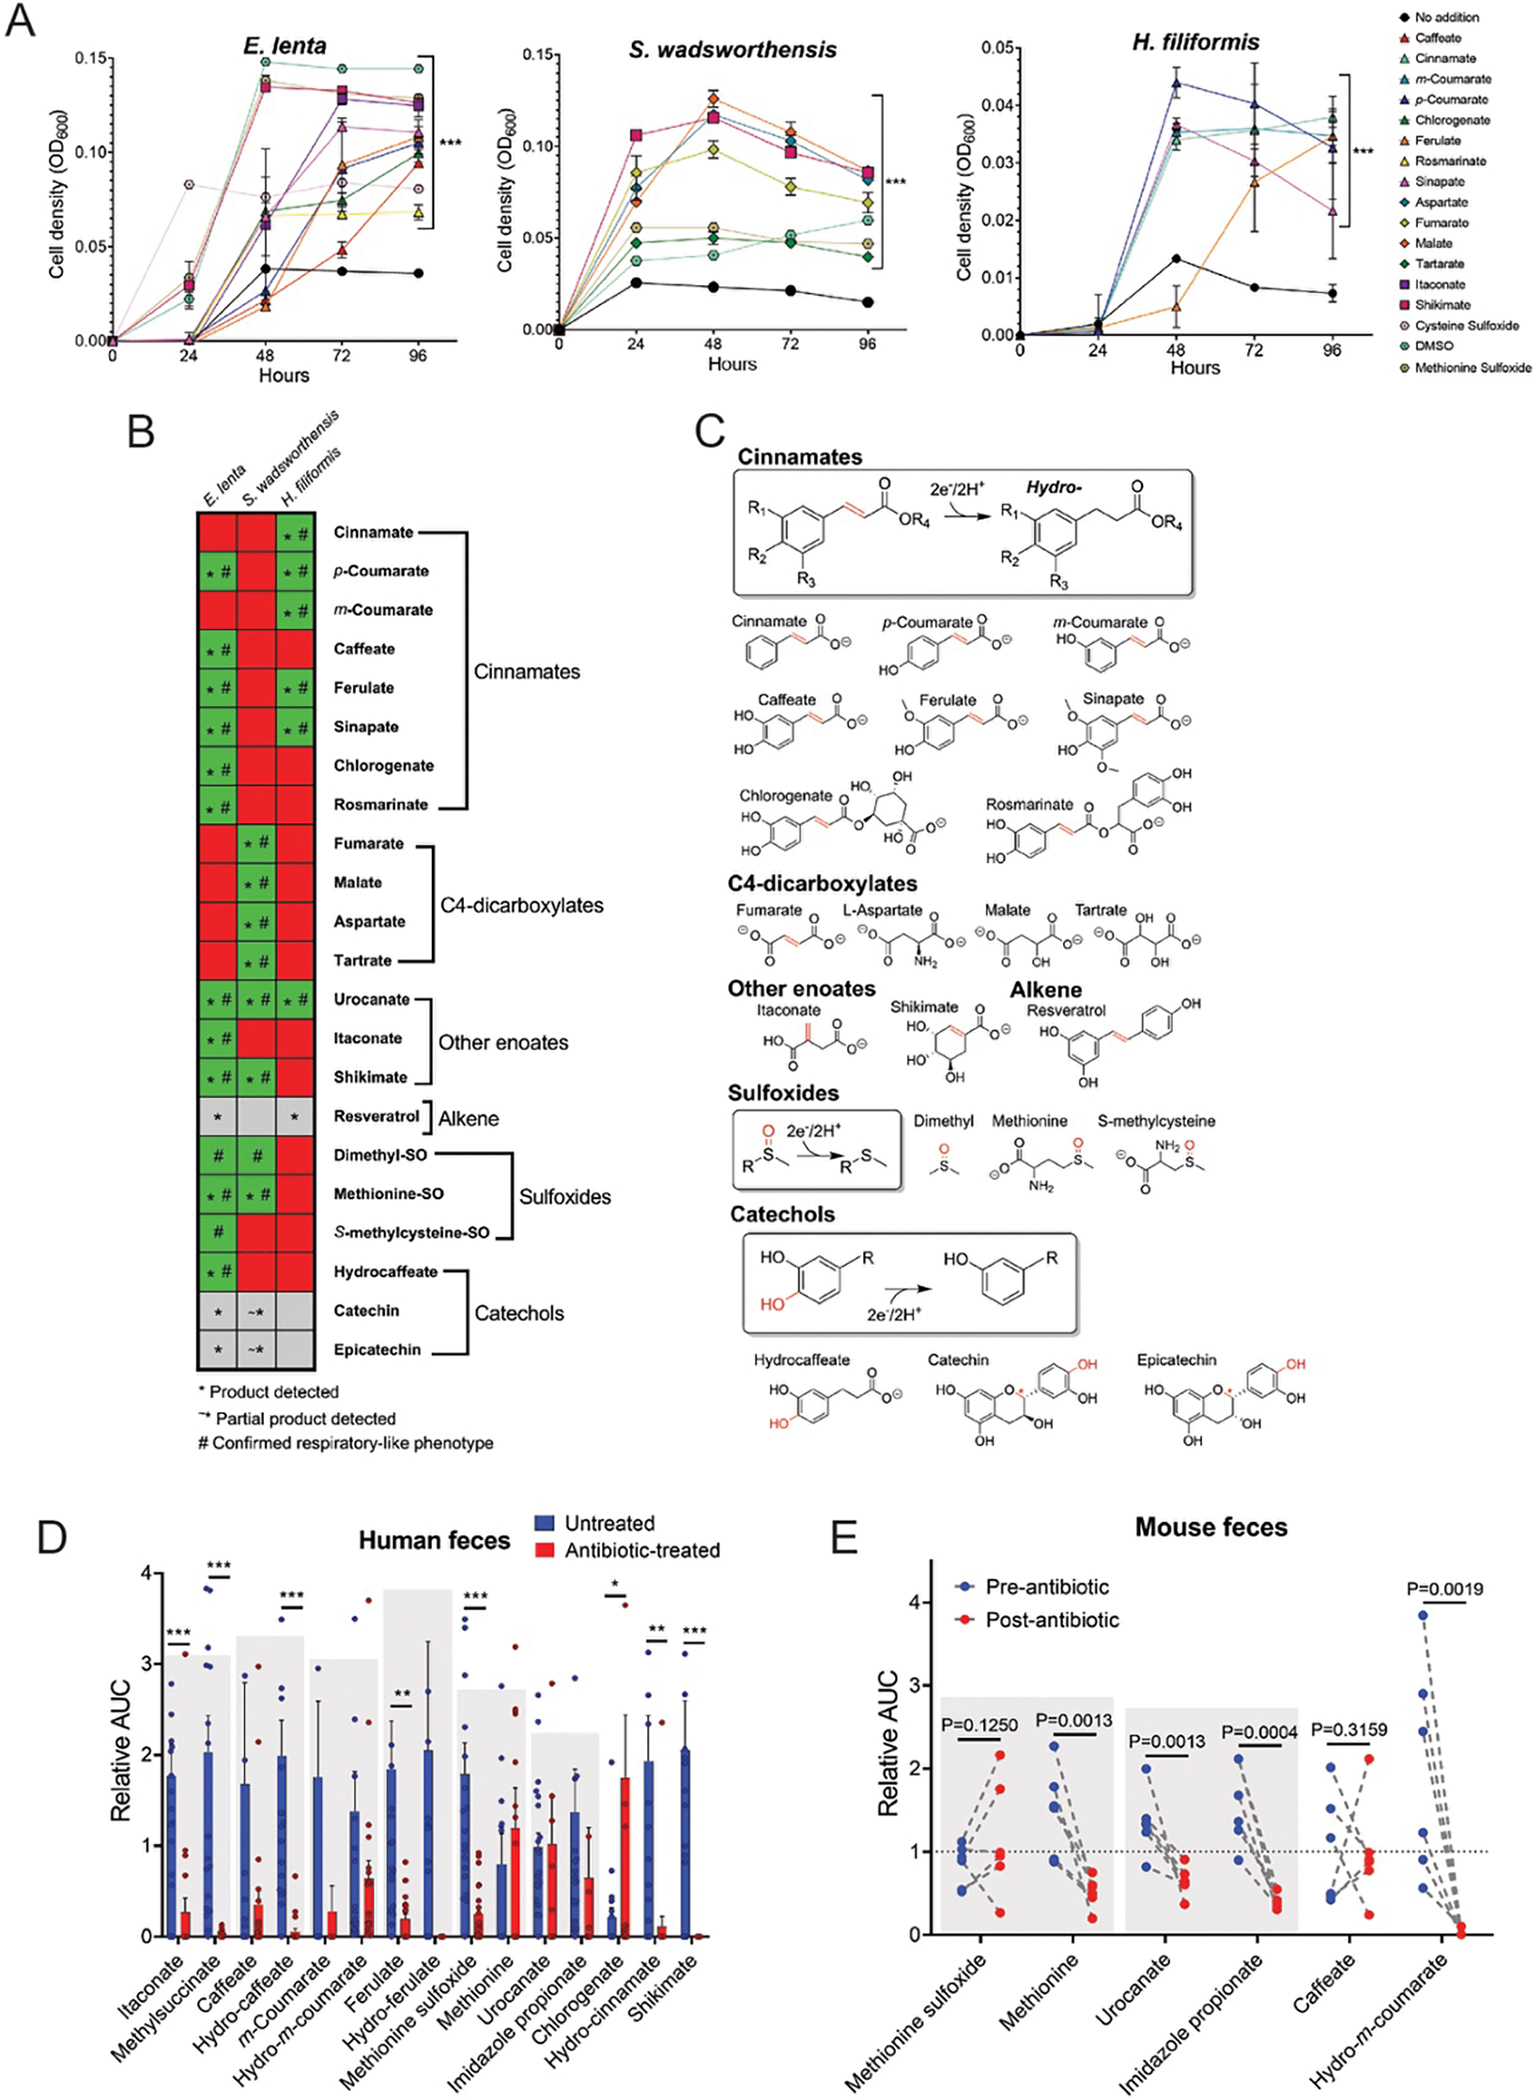
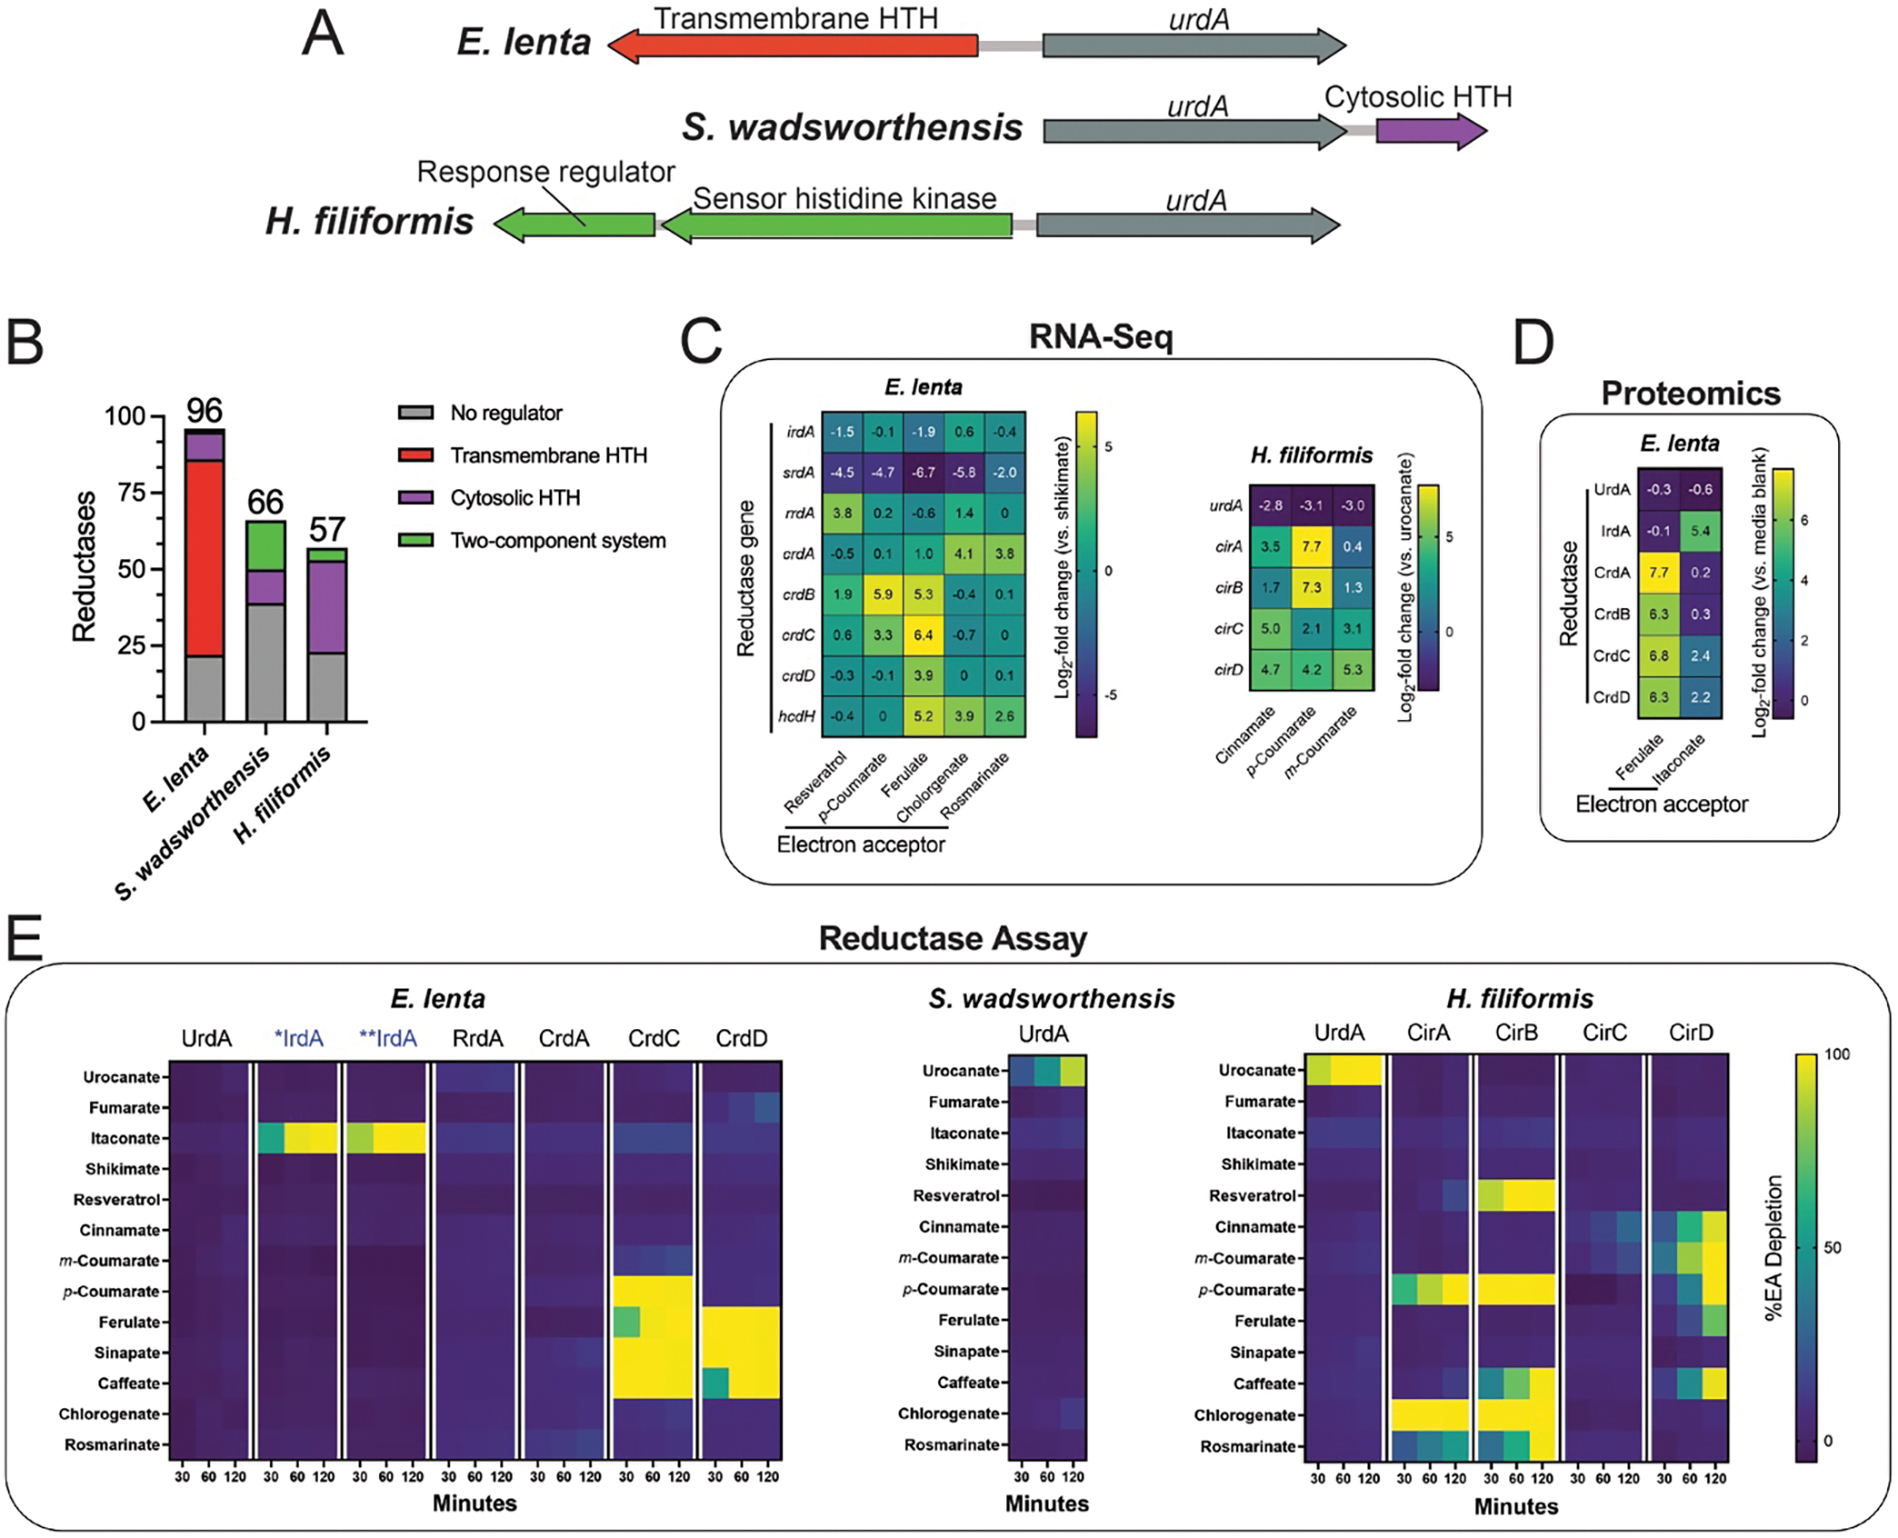
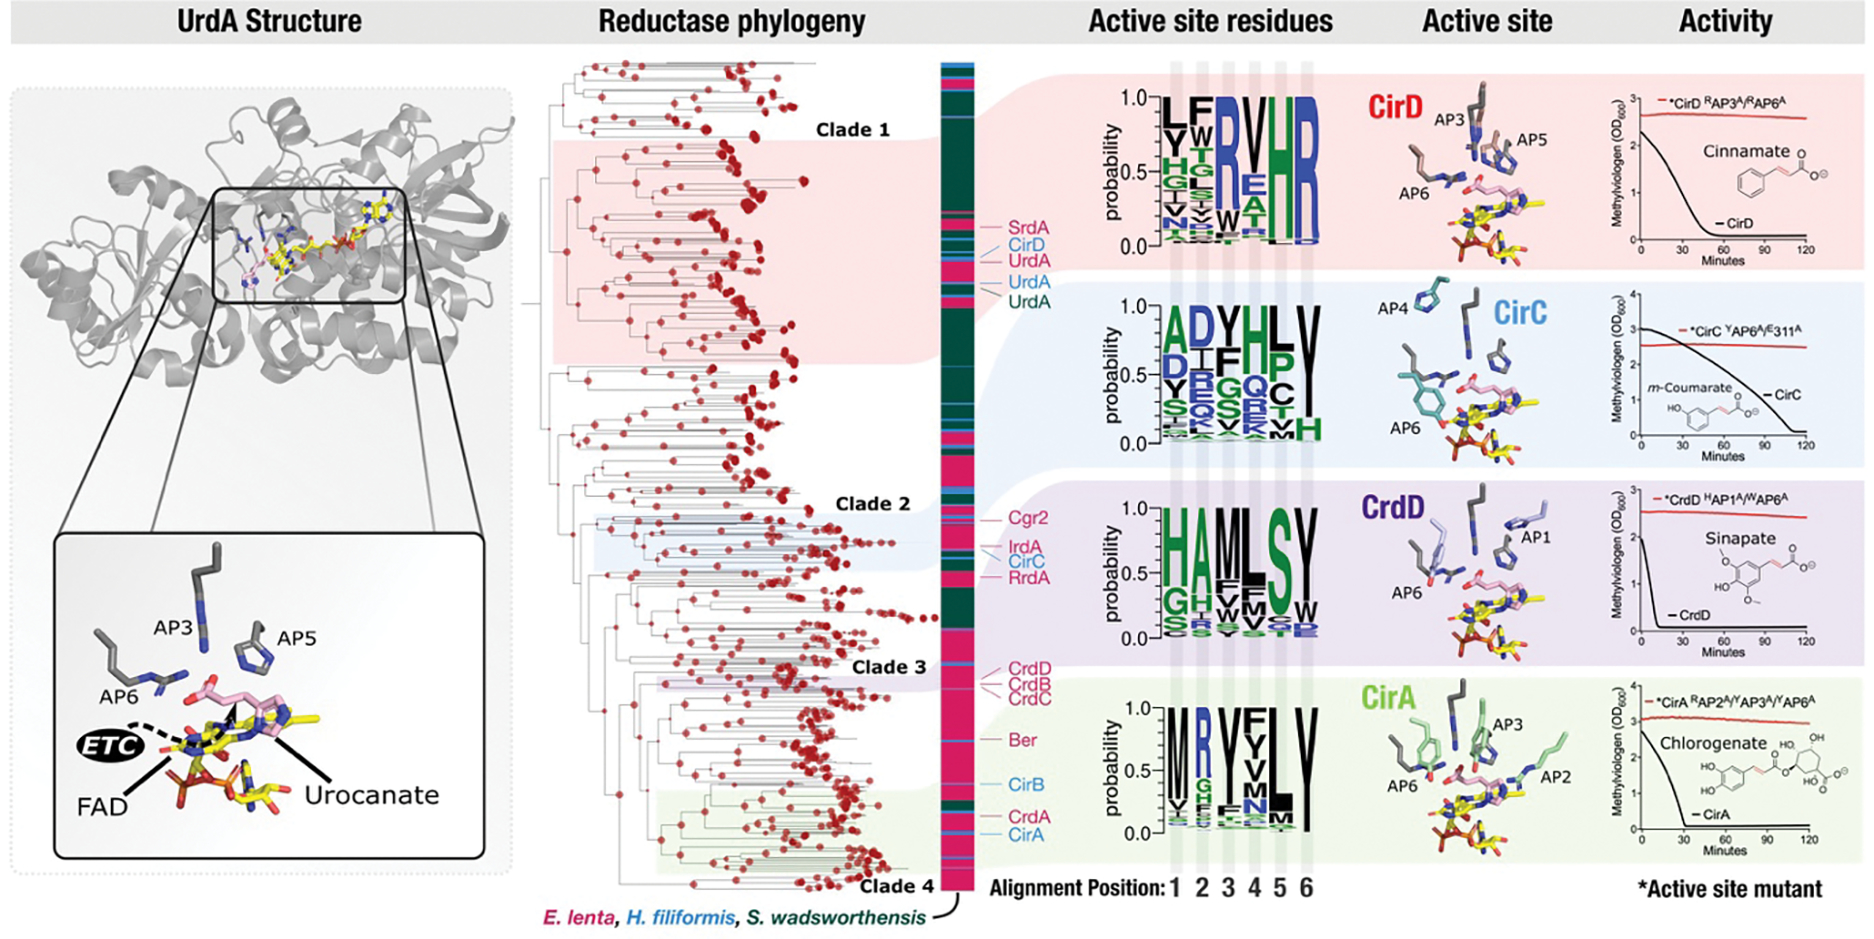
Respiratory reductases enable microorganisms to use molecules present in anaerobic ecosystems as energy-generating respiratory electron acceptors. Here we identify three taxonomically distinct families of human gut bacteria (Burkholderiaceae, Eggerthellaceae and Erysipelotrichaceae) that encode large arsenals of tens to hundreds of respiratory-like reductases per genome. Screening species from each family (Sutterella wadsworthensis, Eggerthella lenta and Holdemania filiformis), we discover 22 metabolites used as respiratory electron acceptors in a species-specific manner. Identified reactions transform multiple classes of dietary- and host-derived metabolites, including bioactive molecules resveratrol and itaconate. Products of identified respiratory metabolisms highlight poorly characterized compounds, such as the itaconate-derived 2-methylsuccinate. Reductase substrate profiling defines enzyme-substrate pairs and reveals a complex picture of reductase evolution, providing evidence that reductases with specificities for related cinnamate substrates independently emerged at least four times. These studies thus establish an exceptionally versatile form of anaerobic respiration that directly links microbial energy metabolism to the gut metabolome.


Conflict of interest statement

Competing interests

The authors declare no competing interests.

Figures

Extended Data Figure 1.
Extended Data Figure 1.. Distribution and identity of flavin and molybdopterin reductases in three taxonomic families.
Phylogenetic trees constructed with representative genomes from each Genome Taxonomy Database (GTDB) species in (A) Eggerthellaceae (88 genomes, 2387 amino acid sites), (B) Burkholderiaceae (1510 genomes, 2379 amino acid sites), and (C) Erysipelotrichaceae (116 genomes, 2464 amino acid sites). Each maximum likelihood tree was constructed based on a concatenated alignment of 16 ribosomal proteins under an LG + I + G4 model of evolution. The numbers of flavin (blue) and molybdopterin (red) reductases with a computationally predicted signal peptide in each genome are graphed on the outer ring of the trees. (D) Flavin reductase pangenomes of E. lenta, S. wadsworthensis, and H. filiformis. For each pangenome, the inner concentric layers represent unique genomes while the radial elements represent gene cluster presence (darker color) or absence (lighter color) across the genomes. The outermost concentric circle, “Max num paralogues,” indicates the maximum number of paralogues (defined as reductases with ~60% sequence identity) one genome contributes to the gene cluster. The second outermost circle, “SCG clusters,” indicates single-copy core reductase i.e., gene clusters for which every genome contributed exactly one gene. Genomes (inner concentric layers) are clustered by the presence/absence of reductase gene clusters. All vs all genome average nucleotide identity is depicted in the heat map above the genome concentric layers.
Extended Data Figure 2.
Extended Data Figure 2.. E. lenta uses multiple respiratory electron acceptors.
E. lenta DSM2243 growth in formate-supplemented media provisioned with electron acceptors: (A) p-coumarate, (B) ferulate, (C) chlorogenate, (D) rosmarinate, (E) sinapate, (F) shikimate, (G) itaconate, (H) methionine sulfoxide, (I) S-methyl-L-cysteine sulfoxide, and (J) dimethyl sulfoxide. A ‘no electron acceptor’ condition and conditions with predicted reduction products are included as controls. Extracted ion chromatograms of peaks (matched to available authentic standards) in uninoculated and inoculated growth media. (A)-(D),(G)-(J) were measured by GC-MS; (E), (F) were measured by LC-MS; support for identification of hydro-shikimate in (F) is provided in Supplementary Fig. 5. Data are mean ±SD (n = 3 independent biological replicates). *p < 0.05, **p < 0.01, *** p < 0.001. Two-way ANOVA, multiple test vs media alone.
Extended Data Figure 3.
Extended Data Figure 3.. S. wadsworthensis growth-stimulating electron acceptors.
S. wadsworthensis growth in formate-supplemented media provisioned with electron acceptors: (A) labeled C4-dicarboxylates, (B) shikimate, (C) dimethyl sulfoxide, and (D) methionine sulfoxide. A ‘no electron acceptor’ condition and conditions with predicted products are included as controls. Extracted ion chromatograms of peaks (matched to available authentic standards) in uninoculated and inoculated growth media. (A) Fumarate and its succinate reduction were measured by LC-MS, the rest of (A) and (D) were measured by GC-MS; (B) was measured by LC-MS; support for identification of hydro-shikimate in (B) is provided in Supplementary Fig. 5. Data are mean ±SD (n = 3 independent biological replicates). *p < 0.05, **p < 0.01, *** p < 0.001. Two-way ANOVA, multiple test vs media alone.
Extended Data Figure 4.
Extended Data Figure 4.. H. filiformis growth-stimulating electron acceptors.
H. filiformis growth in media provisioned with electron acceptors: (A) cinnamate (B) m-coumarate, (C) p-coumarate (D) ferulate, and (E) sinapate. A ‘no electron acceptor’ condition and conditions with predicted products are included as controls. Extracted ion chromatograms of peaks (matched to available authentic standards) in uninoculated and inoculated growth media. Data are mean ±SD (n = 3 independent biological replicates). *p < 0.05, **p < 0.01, *** p < 0.001. Two-way ANOVA, multiple test vs media alone.
Extended Data Figure 5.
Extended Data Figure 5.. Electron acceptors not observed to stimulate growth.
(A) GC-MS analysis of resveratrol-spiked media before and after E. lenta DSM2243 growth and LC-MS analysis of resveratrol-spiked media before and after H. filiformis DFI.9.20 growth. The low solubility of resveratrol hindered experiments to assess whether this electron acceptor supported respiratory growth. (B) Potential modification flow for (+)-catechin and (−)-epicatechin, and GC-MS of media spiked with either (+)-catechin or (−)-epicatechin before and after E. lenta DSM2243 or S. wadsworthensis DFI.4.78 growth. (C) Resting cell suspensions of E. lenta and S. wadsworthensis in buffer supplemented with 1mM formate assayed cellular ATP concentrations after incubation with buffer alone or (−)-epicatechin, data are mean ±SD (n = 3 technical replicates). Support for identification of catechin and epicatechin derivatives in (B) is provided in Supplementary Fig. 2 & 3.
Extended Data Figure 6.
Extended Data Figure 6.. ATP generation facilitated by electron acceptors.
Resting cell suspensions of E. lenta and S. wadsworthensis in buffer supplemented with 1mM formate assayed cellular ATP concentrations after incubation with different classes of electron acceptors, (A) cinnamates, (B) C4-dicarboxylates, (C) other enolates, (D) alkenes, (E) sulfoxides, (F) catechols, and (G) electron donor-acceptor combination dependence. Data are mean ±SD (n = 3 technical replicates).
Extended Data Figure 7.
Extended Data Figure 7.. Caffeate utilization by E. lenta and tungstate inhibition of sulfoxide growth enhancement.
(A) GC-MS analysis of supernatant collected from E. lenta DSM2243 grown in caffeate-spiked media. Extracted ion chromatograms of peaks (matched to authentic standards) in uninoculated and inoculated growth media. Proposed reaction pathways are shown, with peaks for each compound provided beneath its chemical structure. The previously characterized hydrocaffeate dehydroxylase may catalyze the observed dehydroxylation reactions. The observed caffeate reduction to hydrocaffeate provides evidence of a caffeate reductase, while the accumulation of m-coumarate suggests that this enzyme may specifically use caffeate. (B) E. lenta DSM2243 growth in media supplemented with formate and different cinnamates. The pattern of cinnamate-dependent growth enhancement supports the conclusions that: (1) dehydroxylation can support respiratory growth and (2) m-coumarate is a poor electron acceptor for E. lenta. (C) The effect of the molybdopterin reductase inhibitor, tungstate, on E. lenta DSM2243 growth. Media was supplemented with formate and the noted electron acceptor, with or without the addition of tungstate. (D) Reactions catalyzed by urocanate and sulfoxide reductases. Tungstate’s selective growth inhibition is consistent with sulfoxide, but not urocanate, reduction being catalyzed by a molybdopterin reductase. Data are mean ±SD (n = 3 independent biological replicates). *p < 0.05, **p < 0.01, *** p < 0.001. Two-way ANOVA, multiple test vs media alone.
Extended Data Figure 8.
Extended Data Figure 8.. Microbiome composition of fecal samples used for metabolite measurements.
(A) Taxonomy abundance in human fecal samples used for metabolomics analyses assessed by shotgun metagenomics. (B) Taxonomy abundance in mouse fecal samples used for metabolomics analyses assessed by 16S rRNA amplicon sequencing. The Inverse Simpson measure of microbiome diversity is also presented.
Extended Data Figure 9.
Extended Data Figure 9.. Expression of recombinant reductase enzymes.
SDS-PAGE gels of reductase enzymes expressed and purified from E. coli. (A) H. filiformis enzymes, except where indicated. (B) E. lenta enzymes, except where indicated. Proteins run on a 12% acrylamide Bis-Tris gel in a MOPS running buffer, compared to PageRuler Plus prestained protein ladder (Thermo. #26619). Expected kDa for both ladder and proteins are labeled. Experiments (A, B) were repeated twice, with similar results.
Extended Data Figure 10.
Extended Data Figure 10.. Presence of irdA predicts itaconate reductase activity of E. lenta strains.
(A) Schematic diagram of itaconate reduction by IrdA, and sequence identity of the reductase with greatest similarity to IrdA is shown for indicated E. lenta strains strain. (B) Extracted ion chromatograms of authentic standard-matched methylsuccinate peaks from media collected after cultivation with the indicated strain.
Figure 1.
Figure 1.. Respiratory reductase orthologs are highly overrepresented in three distinct lineages of gut bacteria.
(A) General mechanism and electron acceptors used by different previously characterized respiratory molybdopterin reductases (Pfam PF00384). Arrows highlight electron (e) transfer path from the electron transport chain (ETC) to dimethylsulfoxide (DMSO) in the DMSO reductase crystal structure (PDB code 4DMR). (B) Electron acceptors and general electron transfer mechanism used by previously characterized respiratory flavin reductases (Pfam PF00890). Arrows highlight electron transfer to substrate in the S. oneidensis urocanate reductase co-complex crystal structure (PDB code 6T87). (C) Distribution of the number of flavin/molybdopterin reductases in 1533 representative human gut bacteria genomes and metagenome-assembled genomes. (D) Phylogenetic reconstruction of the evolutionary history of genomes analyzed in (C). The maximum likelihood tree was constructed based on a concatenated alignment of 14 ribosomal proteins under an LG + I + G4 model of evolution (2092 amino acid sites). The number of flavin (blue) and molybdopterin (red) reductases with a computationally predicted signal peptide in each genome are graphed on the outer ring of the tree.
Figure 2.
Figure 2.. ‘High reductase’ gut bacteria exhibit respiratory growth properties.
(A) Growth of E. lenta DSM2243, S. wadsworthensis DFI.4.78, and H. filiformis DSM12042 strains in the presence of electron donor (formate), electron acceptor (urocanate), and product of urocanate reduction (imidazole propionate). (B) Reaction catalyzed by urocanate reductase UrdA. (C) GC-MS extracted ion chromatograms in formate/urocanate-supplemented culture supernatants following cultivation of the indicated strains. (D) ATP produced by cells suspended in formate-supplemented buffer. For (A) data are mean ±SD (n = 3 independent biological replicates), for (D) data are mean ±SD (n = 3 technical replicates). *p < 0.05, **p < 0.01, *** p < 0.001. Two-way ANOVA, multiple test vs media alone.
Figure 3.
Figure 3.. ‘High reductase’ gut bacteria utilize diverse respiratory electron acceptors.
(A) E. lenta DSM2243, S. wadsworthensis DFI.4.78, and H. filiformis DFI.9.20 growth in media supplemented with formate and identified growth-stimulating small molecules. (B) Summary of electron acceptor usage findings. Green indicates growth enhancement, red indicates no enhancement, and grey denotes limited solubility. The symbol * indicates the reduced product was detected after growth, and the symbol # indicates a confirmed respiratory phenotype. (C) Summary of identified reductase activities. The electron-accepting bond is highlighted in red. The red symbol * for both catechin and epicatechin denotes the site of benzylic C-O cleavage. (D) Identified metabolites in fecal samples collected from non-antibiotic versus antibiotic treated subjects as measured by LC-MS. Area under the curve (AUC) values are presented relative to each metabolite’s normalized average (normalized to 1) within the dataset as measured by LC-MS. See Supplementary Table 4 for original data. (E) Identified metabolites in mouse feces pre- and post-antibiotic treatment. Area under the curve (AUC) values are presented relative to each metabolite’s normalized average (normalized to 1) within the dataset. Gray boxes highlight reductase substrate and product pairs. See Supplementary Table 5 for original data. For (A) data are mean ±SD (n = 3 independent biological replicates) with two-way ANOVA, multiple test vs media alone. For (D) data are mean ±SEM (n = 21 antibiotic treated, 20 untreated) with multiple unpaired t tests. For (E) n = 6 pre- and 6-post antibiotic treated, with multiple unpaired t tests. *p < 0.05, **p < 0.01, *** p < 0.001.
Figure 4.
Figure 4.. Flavin reductases are induced by their electron acceptors and exhibit relatively narrow substrate specificities.
(A) Genomic context of urdA urocanate reductases in E. lenta DSM2243, S. wadsworthensis DFI.4.78, and H. filiformis DFI.9.20 genomes. Genes encoding predicted transcriptional regulators are noted. (B) Genomic context of flavin and molybdopterin reductases with respect to adjacent regulatory elements. Either no clear element present (grey), two-component system (green), cytosolic regulator (purple), or transmembrane regulator (red). Cytosolic and transmembrane refers to the cellular localization of the putative signal-receiving domain in predicted transcriptional regulators that contain a DNA-binding helix-turn-helix (HTH) domain. The number of flavin and molybdopterin reductases genes that directly neighbor a predicted transcriptional regulator in E. lenta DSM2243, S. wadsworthensis DFI.4.78, and H. filiformis DFI.9.20 genomes. (C) RNA-Seq results from E. lenta DSM2243 and H. filiformis DFI.9.20 cells cultivated in media supplemented with indicated electron acceptors. (D) Proteomics results from E. lenta DSM2243 cells cultivated in media supplemented with indicated electron acceptors. (E) Activity of recombinant reductases in the presence of indicated electron acceptors. For (E), representative data are shown.
Figure 5.
Figure 5.. Independent evolutionary trajectories and distinct active sites distinguish flavin reductases with related electron acceptors.
UrdA structure – previously published crystal structure of the S. oneidensis UrdA in complex with urocanate and flavin adenine dinucleotide (PDB code 6T87). Reductase phylogeny – phylogenetic tree of flavin reductases from E. lenta, S. wadsworthensis, and H. filiformis genomes. Bootstrap support values are indicated by the size of red dots at nodes of the tree and range from 70 to 100. Active site residues – representation of sequence identity of active site amino acids in reductase clades 1–4 scaled to frequency within the multiple sequence alignment. Positions within the multiple sequence alignment have been renumbered to active site alignment position (AP). Active site – AlphaFold models of CirD, CirC, CrdD, and CirA cinnamate reductases superimposed to the UrdA crystal structure. Activity –reductase activity of CirD, CirC, CrdD, and CirA and active site point mutants (indicated by an asterisk). Active site mutations and alignment positions they correspond to: *CrdD H313A (AP1) and W510A (AP6); *CirA R417A (AP2), Y469A (AP3), and Y634A (AP6); *CirC E311A and Y511A (AP6); *CirD R542A (AP3) and R716A (AP6). The y-axis shows the amount of reduced methylviologen in the presence of the indicated electron acceptor.

References

    1. Moodie AD & Ingledew WJ Microbial anaerobic respiration. Adv Microb Physiol 31, 225–69 (1990). - PubMed
    1. Gibson GR, Macfarlane GT & Cummings JH Occurrence of sulphate-reducing bacteria in human faeces and the relationship of dissimilatory sulphate reduction to methanogenesis in the large gut. Journal of Applied Bacteriology 65, 103–111 (1988). - PubMed
    1. Smith NW, Shorten PR, Altermann EH, Roy NC & McNabb WC Hydrogen cross-feeders of the human gastrointestinal tract. Gut Microbes 10, 270–288 (2019). - PMC - PubMed
    1. Butler NL et al. Bacteroides fragilis Maintains Concurrent Capability for Anaerobic and Nanaerobic Respiration. J Bacteriol 205, (2023). - PMC - PubMed
    1. Schubert C & Unden G C4-Dicarboxylates as Growth Substrates and Signaling Molecules for Commensal and Pathogenic Enteric Bacteria in Mammalian Intestine. J Bacteriol 204, e0054521 (2022). - PMC - PubMed

LinkOut - more resources