. 2024 Jan;43(1):32-60.
doi: 10.1038/s44318-023-00006-z. Epub 2023 Dec 15.

The ER membrane protein complex restricts mitophagy by controlling BNIP3 turnover

Affiliations

The ER membrane protein complex restricts mitophagy by controlling BNIP3 turnover

Jose M Delgado et al. EMBO J. 2024 Jan.

Abstract

Lysosomal degradation of autophagy receptors is a common proxy for selective autophagy. However, we find that two established mitophagy receptors, BNIP3 and BNIP3L/NIX, are constitutively delivered to lysosomes in an autophagy-independent manner. This alternative lysosomal delivery of BNIP3 accounts for nearly all its lysosome-mediated degradation, even upon mitophagy induction. To identify how BNIP3, a tail-anchored protein in the outer mitochondrial membrane, is delivered to lysosomes, we performed a genome-wide CRISPR screen for factors influencing BNIP3 flux. This screen revealed both known modifiers of BNIP3 stability as well as a pronounced reliance on endolysosomal components, including the ER membrane protein complex (EMC). Importantly, the endolysosomal system and the ubiquitin-proteosome system regulated BNIP3 independently. Perturbation of either mechanism is sufficient to modulate BNIP3-associated mitophagy and affect underlying cellular physiology. More broadly, these findings extend recent models for tail-anchored protein quality control and install endosomal trafficking and lysosomal degradation in the canon of pathways that tightly regulate endogenous tail-anchored protein localization.

Keywords: BNIP3; EMC; Mitophagy; Secretory Pathway; TA Protein.


Conflict of interest statement

The authors declare no competing interests.

Figures

Figure 1
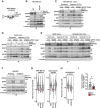
Figure 1. Lysosomal delivery of BNIP3 is independent of autophagy.
(A) Immunoblotting (IB) of MDA-MB-231-derived extracts from cells expressing Cas9 and the indicated sgRNA. Where indicated, cells were treated with 100 nM Baf-A1 for 18 h. Shown are representative images from one biological replicate. Bar graphs represent mean +/− SEM from four independent experiments. All protein levels were normalized to α-tubulin. Statistical analysis was performed using a one-sample t test to the normalized control and an unpaired Student’s t test between experimental samples. Ctrl nontargeting control. ***P <0.001; **P <0.01; ns not significant. (B) Schematic of the tf-BNIP3 reporter. Upon lysosomal delivery, GFP fluorescence is selectively quenched. Thus, corresponding changes in red:green ratio reflect delivery to lysosomes. (C) tf-BNIP3-expressing cells were transduced with the indicated sgRNAs. Cells were subsequently treated with DMSO or Baf-A1 (100 nM) for 18 h before being analyzed by flow cytometry for red:green ratio. Median values for each sample are identified by a black line within each violin. The red dotted line across all samples corresponds to red:green ratio of maximally inhibited conditions (Baf-A1) (n >10,000 cells). (D) Representative confocal micrographs of tf-BNIP3 cells transiently expressing mitoBFP. Cells were treated with vehicle (DMSO) or Baf-A1 (100 nM) for 18 h prior to imaging. Scale bar: 10 µm. (E) Quantification of Pearson’s correlation coefficients from cells in (D). Correlation of RFP with GFP (an anti-correlate of lysosomal delivery) and GFP to mitoBFP (reflective of mitochondrial localization) was calculated using Coloc2. Bar graphs represent mean +/− SEM. Each data point represents a single cell. n = 15 cells. Statistical analysis was performed using an unpaired t test. ****P<0.0001. (F) Representative confocal micrographs of cells transduced with sgRNA constructs targeting ATG9A or a nontargeting control (Ctrl). Cells were fixed 8 days post transduction and immunostained for LAMP1 prior to imaging. Scale bar: 10 µm. Source data are available online for this figure.
Figure 2
Figure 2. Genome-wide CRISPR screening reveals modifiers of BNIP3 flux.
(A) Schematic of the genome-wide CRISPR screening pipeline for modifiers of tf-BNIP3 delivery to the lysosome. Reporter cells were transduced with an sgRNA library, propagated, and sorted to collect the top 30% (enhanced delivery) and bottom 30% (inhibited delivery) of tf-BNIP3 cells based on the red:green fluorescence ratio. (B) Volcano plot of BNIP3 effectors based on average fold change (a proxy for effect strength) and P value from n = 3 experimental replicates. Values were computed from robust rank aggregation (RRA) by the MAGeCK algorithm, a learned mean-variance model. Average log2 fold changes greater than 0.5 and less than −0.5 are indicated vertical dashed lines. The horizontal dashed line indicates a P value of 0.05. Only genes from cellular pathways or protein complexes validated by this study or independent studies are labeled. (C) Effectors and suppressors identified in (B) were mapped against the MitoCarta 3.0 database to identify known mitochondrial factors. (D, E) Unbiased Gene Ontology (GO) term analysis of genes in the effector population.
Figure 3
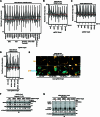
Figure 3. BNIP3 lysosomal delivery is governed by ER insertion and the secretory pathway.
(A) MDA-MB-231 cells expressing tf-BNIP3 and Cas9 were transduced with sgRNAs for the indicated genes. The median red:green ratio of each population was used to generate a heatmap. Darker shades of red indicate greater inhibition, with a red:green ratio of 1 taken as the theoretical maximum inhibition. Genes were clustered by related functions. For underlying data, see Fig. EV2A. (B) Representative confocal micrographs of tf-BNIP3-expressing cells transduced with sgRNAs targeting the indicated genes. Pearson’s correlation coefficient between GFP and mitoBFP (reflective of mitochondrial localization) was calculated using Coloc2. Bar graphs represent mean +/− SEM. Each data point represents a single cell. Statistical analysis was performed using an unpaired t test. Scale bar: 10 µm; n = 15 cells; ***P<0.001. (C) Representative confocal micrographs of tf-BNIP3-expressing cells transduced with indicated sgRNA and shRNA. Scale bar: 10 µm. (D) Immunoblotting (IB) of MDA-MB-231-derived extracts from cells transduced with indicated sgRNAs in both normoxia and hypoxia. Where indicated, cells were treated with 100 nM Baf-A1 for 18 h. Shown are representative images from one biological replicate. Quantification of BNIP3 protein stabilization by Baf-A1 treatment was calculated as: (BNIP3Baf-A1/tubulinBaf-A1)/(BNIP3DMSO/tubulinDMSO). Graphs represent the mean +/− SEM from four independent experiments. Black dashed line indicates fold-stabilization of BNIP3 upon Baf-A1 treatment in control cells. Red dashed line demarcates no stabilization. Statistical analysis was performed a one-way ANOVA with Tukey’s test. ****P<0.0001; ***P< 0.001; **P<0.01. (E) IB of MDA-MB-231-derived extracts from cells treated with Brefeldin-A (BFA) (1 µM), Baf-A1 (100 nM), or bortezomib (BTZ) (100 nM) for 18 h. Shown are representative images from one biological replicate. Bar graphs represent mean +/− SEM from four independent experiments. All protein levels were normalized to α-tubulin. Statistical analysis was performed using a one-sample t test to the normalized control and an unpaired Student’s t test between experimental samples, Veh (DMSO) ***P<0.001; *P< 0.05; ns not significant. Source data are available online for this figure.
Figure 4
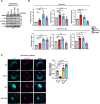
Figure 4. The proteasome is required for efficient BNIP3 degradation, but not lysosomal delivery.
(A) Immunoblotting (IB) of MDA-MB-231-derived extracts from cells treated with vehicle (DMSO), Baf-A1 (100 nM), MLN-4924 (1 µM), and CB-5083 (1 µM) for 18 h. Shown are representative images from one biological replicate (for hypoxia, see Fig. EV3A). Bar graphs represent mean +/− SEM from four independent experiments. All protein levels were normalized to α-tubulin. Statistical analysis was performed using a one-sample t test to the normalized control ***P<0.001, **P< 0.01; ns not significant. (B) Representative confocal micrographs of fixed tf-BNIP3-expressing cells treated with vehicle (DMSO) or bortezomib (BTZ) (100 nM) for 18 h. Scale bar: 10 µm. (C) Pearson’s correlation coefficient between GFP and RFP was calculated using Coloc2. Bar graph represents mean +/− SEM. Each data point represents a single cell. Statistical analysis was performed using an unpaired Student’s t test. Scale bar: 10 µm; n = 15 cells; ****P<0.0001. (D) Immunoblotting (IB) of MDA-MB-231-derived extracts from cells grown in normoxia and hypoxia and treated with DMSO, Baf-A1 (100 nM), and/or bortezomib (BTZ) (100 nM) for 18 h. Shown are representative images from one biological replicate. (E) Quantification of BNIP3 protein accumulation from (D). Bar graphs represent mean +/− SEM from four independent experiments. All protein levels were normalized to α-tubulin. Statistical analysis was performed using a one-way ANOVA with Dunnett test and an unpaired Student’s t test between experimental samples. ****P<0.0001; ***P<0.001; *P<0.05; ns not significant. Source data are available online for this figure.
Figure 5
Figure 5. BNIP3 dimerization determines mode of degradation and is required for lysosomal delivery.
(A) Domain organization of BNIP3 (NP_004043.4) and derived variants. LC3 LC3-interacting region, PEST PEST domain, BH3 BH3 domain, CR conserved region, TMD transmembrane domain. Asterisks in the schematic indicate individual amino acid residue positions. (B) Dot plot representing fold-stabilization of tf-BNIP3 variants in response to Baf-A1. Stabilization was calculated as a ratio of median red:green ratios (DMSO/Baf-A1). A ratio of 1 represents no lysosomal delivery. Plots represent the mean +/− SEM from three independent experiments. Statistical analysis was performed using a one-way ANOVA with Dunnett test. ***P<0.001; **P<0.01. (C) Immunoblotting (IB) of HEK293T-derived extracts transiently expressing the indicated tf-BNIP3 variants. Monomeric and dimeric species are indicated. (D) MDA-MB-231 cells were transduced with the indicated tf-BNIP3 variants. Red:green ratio was analyzed by flow cytometry 48 h post transduction. Cells were incubated with vehicle (DMSO) or Baf-A1 (100 nM) for 18 h before analysis. The red dotted line across all samples corresponds to red:green ratio of wild-type (WT) cells inhibited with Baf-A1 (n >10,000 cells). Bar graphs represent mean +/− SEM from three independent experiments. Statistical analysis was performed using a two-way ANOVA with Dunnett’s test. **P<0.01; ns not significant. (E) Representative confocal micrographs of MDA-MB-231 cells transduced with indicated GFP-BNIP3 variants. Scale bar, 10 µm. (F) Schematic of the DmrB-based inducible dimerization system using the 117-end variant of BNIP3. (G) MDA-MB-231 cells were transduced with the indicated tf-BNIP3117-end variants. Red:green ratio was analyzed by flow cytometry 48 h post transduction. Cells were treated with Baf-A1 (100 nM) and/or B/B homodimerizer (0.5 µM) for 6 h prior to performing flow cytometry. Bar graphs represent mean +/− SEM from three independent experiments. The red dotted line across all samples corresponds to cells inhibited with Baf-A1 (n >10,000 cells). Statistical analysis was performed using a two-way ANOVA with Dunnett’ test. ****P<0.0001; ***P<0.001; **P< 0.01; ns not significant. (H) Schematic of global protein stability (GPS) cassette fused to BNIP3. IRES, internal ribosome entry site. (I) MDA-MB-231 cells were transduced with the indicated [GPS] RFP; GFP-BNIP3 variants. Red:green ratio was analyzed by flow cytometry 48 h post transduction. Cells were treated with vehicle (DMSO), Baf-A1 (100 nM), BTZ (100 nM), CB-5083 (1 µM), TAK-243 (an inhibitor of the ubiquitin-activating enzyme [UAE], 1 µM) for 18 h prior to performing flow cytometry. Bar graphs represent mean +/− SEM from three independent experiments. The black dotted line across each sample group corresponds to the basal red:green ratio of mock-treated cells (n >10,000 cells). Statistical analysis was performed using a two-way ANOVA with Dunnett’ test. ****P< 0.0001; ***P< 0.001; **P<0.01; *P<0.05; ns not significant. Source data are available online for this figure.
Figure 6
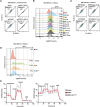
Figure 6. Lysosomal delivery is distinct from BNIP3-mediated mitophagy.
(A) MDA-MB-231 cells expressing mt-Keima were transduced with BFP-empty or BFP-BNIP3 and analyzed by flow cytometry 48 h post transduction. Cells were incubated with vehicle (DMSO) or Baf-A1 (100 nM) for 18 h before analysis. Baf-A1 treatment was used to define “MitoFlux+”, indicative of cells turning over mitochondria. n >10,000 cells. (B) MDA-MB-231 cells expressing mt-Keima were transduced with indicated BFP-BNIP3 variants and BFP-positive cells were analyzed for Mitoflux as in (A). Bar graphs represent mean +/− SEM from three independent experiments. Statistical analysis was performed using a one-way ANOVA with Dunnett’s test. ****P<0.0001; ***P<0.001. (C) MDA-MB-231 cells were transduced with wild-type (WT) tf-BNIP3 or tf-BNIP3(FIS1TMD) and analyzed by flow cytometry 48 h post transduction. Cells were incubated with vehicle (DMSO) or Baf-A1 (100nM) for 6 h before analysis. Bar graphs represent mean +/− SEM from three independent experiments. The red dotted line across all samples corresponds to red:green ratio of wild-type cells inhibited with Baf-A1 (n >10,000 cells). Statistical analysis was performed using a one-way ANOVA with Dunnett’s test. **P<0.01; *P<0.05; ns not significant. (D) MDA-MB-231 cells expressing mt-Keima were transduced with indicated BFP-BNIP3 variants and analyzed for Mitoflux as in (A). Bar graphs represent mean +/− SEM from three independent experiments. The black dotted line across each sample group corresponds to the basal red:green ratio of mock-treated cells (n >10,000 cells). Statistical analysis was performed using a one-way ANOVA with Dunnett’s test. ****P<0.0001; *P<0.05. (E) Representative Seahorse Flux Analyzer graph of MDA-MB-231 cells that were transduced with indicated the BFP-BNIP3 variants and analyzed for oxygen consumption rate (OCR) and extracellular acidification rate (ECAR) 48 h post transduction. Graphs represent the mean +/− SEM from five technical replicates. Values were normalized by BCA protein assay. (F) Quantification of basal respiration, basal glycolysis, spare respiration, and max respiration from (E). Bar graphs represent mean +/− SEM from three independent experiments. Statistical analysis was performed using a one-way ANOVA with Dunnett’s test. **P<0.01; *P<0.05. Source data are available online for this figure.
Figure 7
Figure 7. Endolysosomal and proteasomal systems confine BNIP3 levels to suppress basal mitophagy.
(A) MDA-MB-231 mt-Keima cells treated with vehicle (DMSO), Baf-A1 (100 nM), MLN-4924 (1 µM), and CB-5083 (1 µM) for 24 h prior to analysis by flow cytometry. Bar graphs represent mean +/− SEM from three independent experiments. Statistical analysis was performed using a one-way ANOVA with Dunnett’s test. ****P<0.0001; ***P<0.001. (B) MDA-MB-231 cells expressing mt-Keima were transduced the indicated sgRNAs. Cells were incubated with vehicle (DMSO) or Baf-A1 (100 nM) for 18 h prior to analysis by flow cytometry. (n >10,000 cells). (C) MDA-MB-231 cells expressing mt-Keima were transduced the indicated sgRNAs. Cells were incubated with vehicle (DMSO) or BTZ (100nM) for 18 h prior to flow cytometry. Bar graphs represent mean +/− SEM from three independent experiments. Statistical analysis was performed using two-way ANOVA with Tukey’s post test. **P<0.01; *P<0.05. (D) MDA-MB-231 cells expressing mt-Keima were transduced the indicated sgRNAs and shRNAs. Cells were incubated with vehicle (DMSO) or BTZ (100 nM) for 18 h prior to flow cytometry. Bar graphs represent mean +/− SEM from three independent experiments. Statistical analysis was performed using two-way ANOVA with Tukey’s post test. ****P<0.0001; *P<0.05. (E) Presumptive model for endolysosomal regulation of mitophagy. Kinetic proofreading enforces the ultimate localization profile of BNIP3 despite limited targeting information, with the lysosome and proteasome serving as sinks that regulate available BNIP3. Solid lines represent processes reported in this study. Dashed lines reflect the presumed cycling of TA proteins. Model generated in BioRender (Adapted from McKenna et al, 2020). Source data are available online for this figure.
Figure EV1
Figure EV1. related to Fig. 1.
(A) MDA-MB-231 cells were transduced with V5-BNIP3 variants and lysed 48 h post transduction. The V5 epitope was immunoprecipitated from extracts and treated with buffer alone (lane 1), lambda phosphatase (PP, lane 2), or lambda phosphatase with phosphatase inhibitor cocktail (PIC, lane 3). (B) Immunoblotting of MDA-MB-231-derived extracts from wild-type (WT) and ATG9KO clonal knockout cells. Where indicated, cells were treated with Baf-A1 (100 nM) for 18 h. (C–E) Immunoblotting of MDA-MB-231, K562, U2OS, MDA-MB-453-derived extracts from cells expressing Cas9 and the indicated sgRNA. Cells were subjected to normoxia or hypoxia and/or Baf-A1 treatment (100 nM) for 18 h where indicated. (F) Immunoblotting of extracts derived from parental HEK293T and clonal ATG9KO knockout cells. Where indicated, cells were treated with Baf-A1 (100 nM) for 18 h. (G) Violin plots of MDA-MB-231 cells expressing either the tf-NDP52 or tf-BNIP3 reporter. Cells were treated with DMSO or Baf-A1 (100nM) or PIK-III (10 µM) for 18 h before being analyzed by flow cytometry for red:green ratio. Median values for each sample are identified by a black line within each violin. The red dotted line across all samples corresponds to red:green ratio of maximally inhibited conditions (Baf-A1) (n >10,000 cells). (H) Violin plots of MDA-MB-231 cells expressing tf-BNIP3 transduced with either a control small hairpin RNA (shCtrl) or an shRNA targeting Rab7 (shRab7). Cells were analyzed for red:green ratio 8 days post transduction. Red dotted line (=1) corresponds to the theoretical maximum inhibition of red:green ratio. (n >10,000 cells). (I) Quantification of Pearson’s correlation coefficients from cells in Fig. 1D. Correlation of RFP to mitoBFP (reflective of mitochondrial localization) was calculated using Coloc2. Bar graphs represent mean +/− SEM. Each data point represents a single cell. n = 15 cells. Statistical analysis was performed using an unpaired Student’s t test. *P<0.05.
Figure EV2
Figure EV2. Related to Fig. 3.
(A) MDA-MB-231 cells expressing tf-BNIP3 and Cas9 were transduced with the indicated sgRNAs. Red:green ratio was analyzed by flow cytometry on day 8 post transduction. Median values for a nontargeting control (sgControl1) are identified by a dashed black line. The red dotted line across all samples corresponds to a red:green ratio of 1, the theoretical minimum (n >10,000 cells). (B) MDA-MB-231 cells expressing tf-BNIP3 and Cas9 were transduced with the indicated sgRNAs. Red:green ratio was analyzed by flow cytometry on day 8 post transduction. The red dotted line across all samples corresponds to red:green ratio of Baf-A1-treated control (Ctrl) cells (n >10,000 cells). (C) U2OS cells expressing tf-BNIP3 and Cas9 were transduced with the indicated sgRNAs. Red:green ratio was analyzed by flow cytometry on day 8 post transduction. The red dotted line across all samples corresponds to red:green ratio of Baf-A1-treated control (Ctrl) cells (n >10,000 cells). (D) MDA-MB-231 cells expressing tf-BNIP3 and Cas9 were transduced with the indicated dual sgRNAs. Red:green ratio was analyzed by flow cytometry on day 8 post transduction. The red dotted line across all samples corresponds to red:green ratio of Baf-A1-treated control (Ctrl) cells (n > 10,000 cells). (E) Representative confocal micrographs of MDA-MB-231 cells expressing GFP-BNIP3 and Cas9. Cells were transduced with indicated sgRNAs, propagated for 8 days and fixed for image aquisition. Hoechst stain was used for nuclear staining. Scale bar is 10 µm. (F) Immunoblotting of U2OS-derived extracts expressing Cas9 that were transduced with the indicated sgRNAs. On day 8 post transduction, cells were treated with Baf-A1 (100 nM) and subjected to hypoxia for 18 h prior to lysis. (G) Immunoblotting of MDA-MB-231-derived extracts expressing Cas9 that were transduced with the indicated sgRNAs. Cells were treated with Bortezomib (100 nM) for 18 h on day 8 post transduction, prior to lysis.
Figure EV3
Figure EV3. Related to Fig. 4.
(A) Representative image of one biological replicate quantified in Fig. 4A. Immunoblotting (IB) of MDA-MB-231-derived extracts from cells treated with vehicle (DMSO), Baf-A1 (100 nM), MLN-4924 (1 µM), CB-5083 (1 µM) and subjected to hypoxia for 18 h. (B) Quantification of protein accumulation from Figs. 4D and EV3A. Bar graphs represent mean +/− SEM from four independent experiments. All protein levels were normalized to α-tubulin. Statistical analysis was performed using a one-sample t test to the normalized control. **P< 0.01; *P<0.05; ns not significant. (C) Representative confocal micrographs of tf-BNIP3-expressing cells treated with Baf-A1 (100 nM), MLN-4924 (1 µM), or Bortezomib (100 nM) for 18 h. Pearson’s correlation coefficient between GFP and mitoBFP (reflective of mitochondrial localization) was calculated using Coloc2. Bar graphs represent mean +/− SEM. Each data point represents a single cell. Statistical analysis was performed using an unpaired t test. Scale bar: 10 µm; n = 15 cells; ****P<0.0001, **P<0.01.
Figure EV4
Figure EV4. Related to Fig. 5.
(A) Histograms for expression of tf-BNIP3 variants. MDA-MB-231 cells were transduced with the indicated tf-BNIP3 variants and analyzed by flow cytometry 48 h post transduction. Threshold for mRFP+ cells was determined by a non-transduced control (Ctrl). The percentage of RFP+ cells are indicated for each sample. (n > 10,000 cells). (B) MDA-MB-231 cells were transduced with the indicated tf-BNIP3 variants. Red:green ratio was analyzed by flow cytometry 48 h post transduction. Cells were treated with vehicle (DMSO), Baf-A1 (100 nM), or BTZ (100 nM) for 18 h prior to performing flow cytometry. The red dotted line across each sample group corresponds to the maximum inhibition red:green ratio of the wild-type (WT) Baf-A1-treated sample (n > 10,000 cells). (C) Representative confocal micrographs of U2OS cells transduced with V5-BNIP3 variants. 48 h post transduction, cells were fixed and immunostained for the V5 epitope. Hoechst stain was used for nuclear staining. Scale bar is 10 µm. (D) MDA-MB-231 cells were transduced with the indicated tf-BNIP3117-end variants. Red:green ratio was analyzed by flow cytometry 48h post transduction. Cells were treated with Baf-A1 (100 nM) and/or B/B homodimerizer (0.5 µM) for 6 h prior to performing flow cytometry. Bar graphs represent mean +/− SEM from three independent experiments. The red dotted line across all samples corresponds to cells inhibited with Baf-A1 (n > 10,000 cells). Statistical analysis was performed using a two-way ANOVA with Dunnett’s test. ****P<0.0001.
Figure EV5
Figure EV5. Related to Fig. 6.
(A) MDA-MB-231 cells expressing mt-Keima were transduced with either a nontargeting sgRNA (sgCtrl) or sgATG9A. On day 8 post transduction, cells were incubated with vehicle (DMSO) or Baf-A1 (100 nM) for 18 h and assessed by flow cytometry. (n > 10,000 cells). (B) Histograms for expression of BFP-BNIP3 variants. MDA-MB-231 mt-Keima cells were transduced with the indicated TagBFP-BNIP3 variants and analyzed by flow cytometry 48 h post transduction. Threshold for TagBFP+ cells was determined by a non-transduced control (Ctrl). The percentage of TagBFP+ cells are indicated for each sample. (n > 10,000 cells). (C) MDA-MB-231 cells expressing mt-Keima were transduced with BFP-BNIP3. At 24 h post transduction, cells were incubated in normoxic or hypoxic conditions for 18 h and assessed by flow cytometry. (n > 10,000 cells). (D) Histograms for expression of BFP-BNIP3 variants. MDA-MB-231 mt-Keima cells were transduced with the indicated TagBFP-BNIP3 variants and analyzed by flow cytometry 48 h post transduction. Threshold for TagBFP+ cells was determined by a non-transduced control (Ctrl). Percentage of TagBFP+ cells are indicated for each sample. (n > 10,000 cells). (E) MDA-MB-231 cells were transduced with indicated the BFP-BNIP3 variants and analyzed for oxygen consumption rate (OCR) and extracellular acidification rate (ECAR) 48 h post transduction. Values were normalized by BCA protein assay. Graphs represent the mean +/− SEM from five technical replicates.

References

    1. Abu-Safieh L, Alrashed M, Anazi S, Alkuraya H, Khan AO, Al-Owain M, Al-Zahrani J, Al-Abdi L, Hashem M, Al-Tarimi S, et al. Autozygome-guided exome sequencing in retinal dystrophy patients reveals pathogenetic mutations and novel candidate disease genes. Genome Res. 2013;23:236–247. - PMC - PubMed
    1. Alsina D, Lytovchenko O, Schab A, Atanassov I, Schober FA, Jiang M, Koolmeister C, Wedell A, Taylor RW, Wredenberg A, et al. FBXL4 deficiency increases mitochondrial removal by autophagy. EMBO Mol Med. 2020;12:e11659. - PMC - PubMed
    1. Beilharz T, Egan B, Silver PA, Hofmann K, Lithgow T. Bipartite signals mediate subcellular targeting of tail-anchored membrane proteins in Saccharomyces cerevisiae. J Biol Chem. 2003;278:8219–8223. - PubMed
    1. Bellot G, Garcia-Medina R, Gounon P, Chiche J, Roux D, Pouysségur J, Mazure NM. Hypoxia-induced autophagy is mediated through hypoxia-inducible factor induction of BNIP3 and BNIP3L via their BH3 domains. Mol Cell Biol. 2009;29:2570–2581. - PMC - PubMed
    1. Berardi DE, Bock-Hughes A, Terry AR, Drake LE, Bozek G, Macleod KF. Lipid droplet turnover at the lysosome inhibits growth of hepatocellular carcinoma in a BNIP3-dependent manner. Sci Adv. 2022;8:eabo2510. - PMC - PubMed

MeSH terms