. 2024 Feb;4(2):198-212.
doi: 10.1038/s43587-023-00548-1. Epub 2024 Jan 4.

Autophagy protein ATG-16.2 and its WD40 domain mediate the beneficial effects of inhibiting early-acting autophagy genes in C. elegans neurons

Affiliations

Autophagy protein ATG-16.2 and its WD40 domain mediate the beneficial effects of inhibiting early-acting autophagy genes in C. elegans neurons

Yongzhi Yang et al. Nat Aging. 2024 Feb.

Abstract

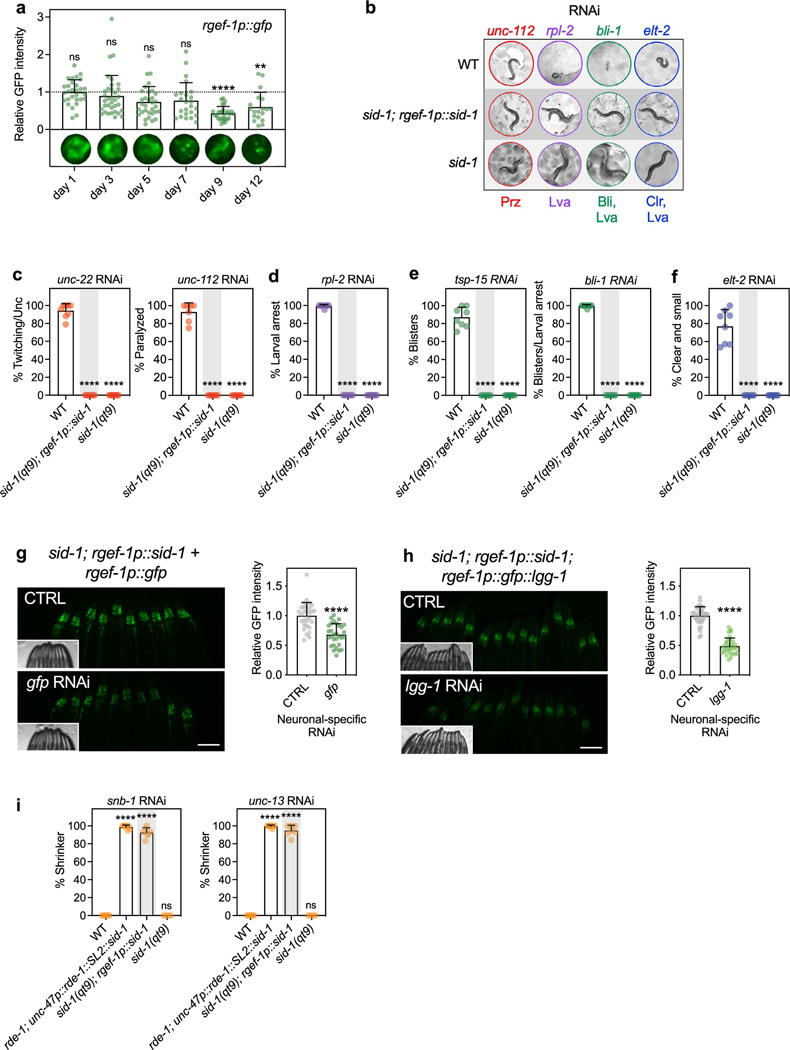
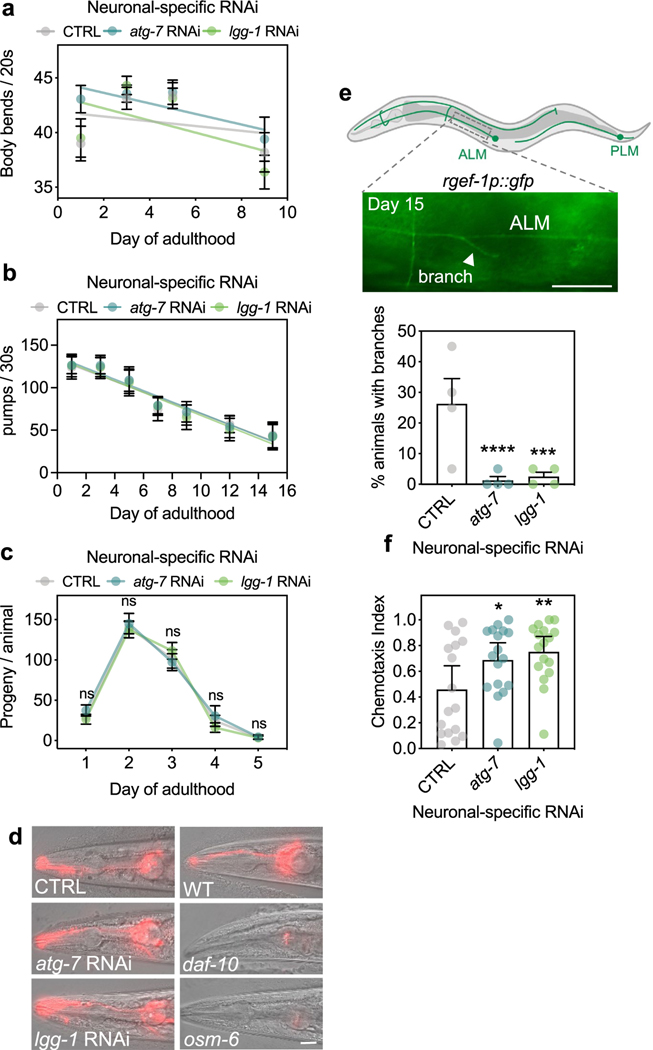
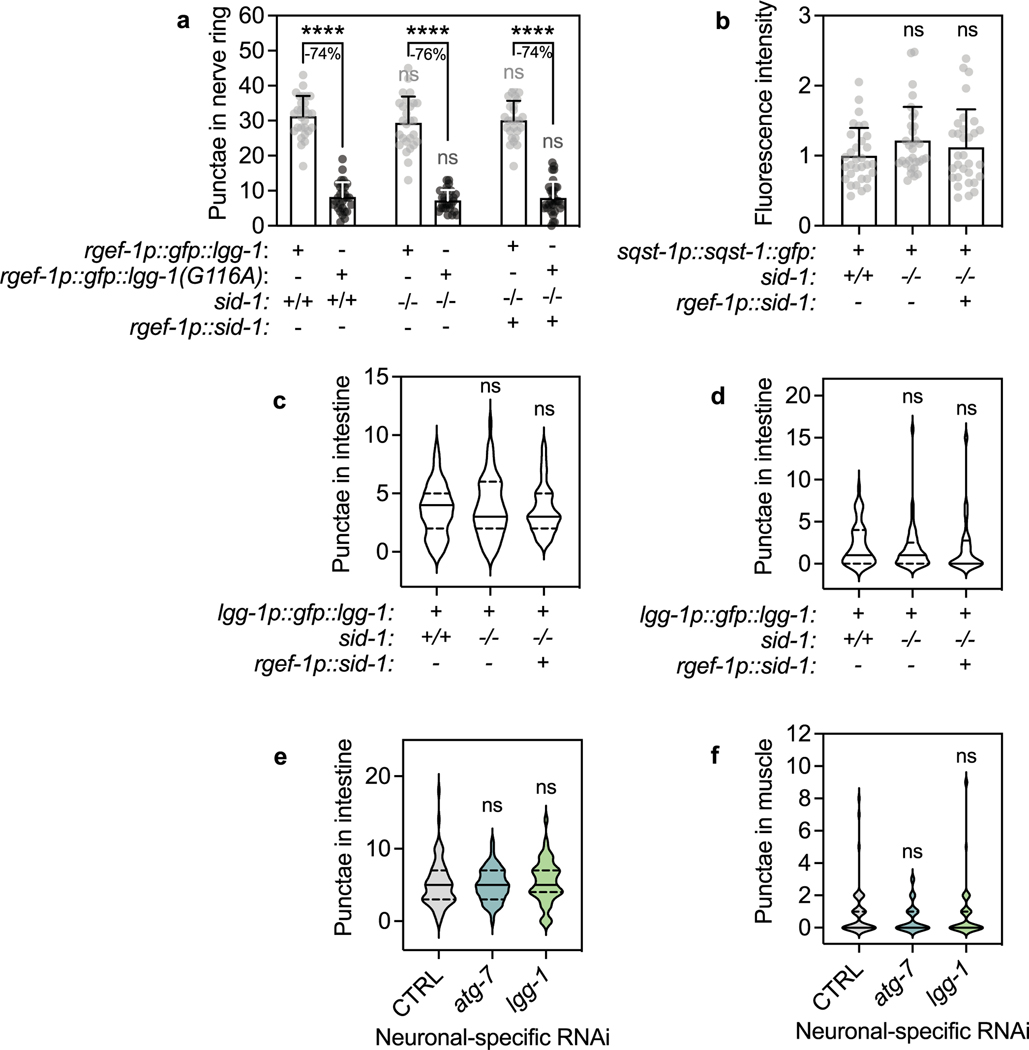
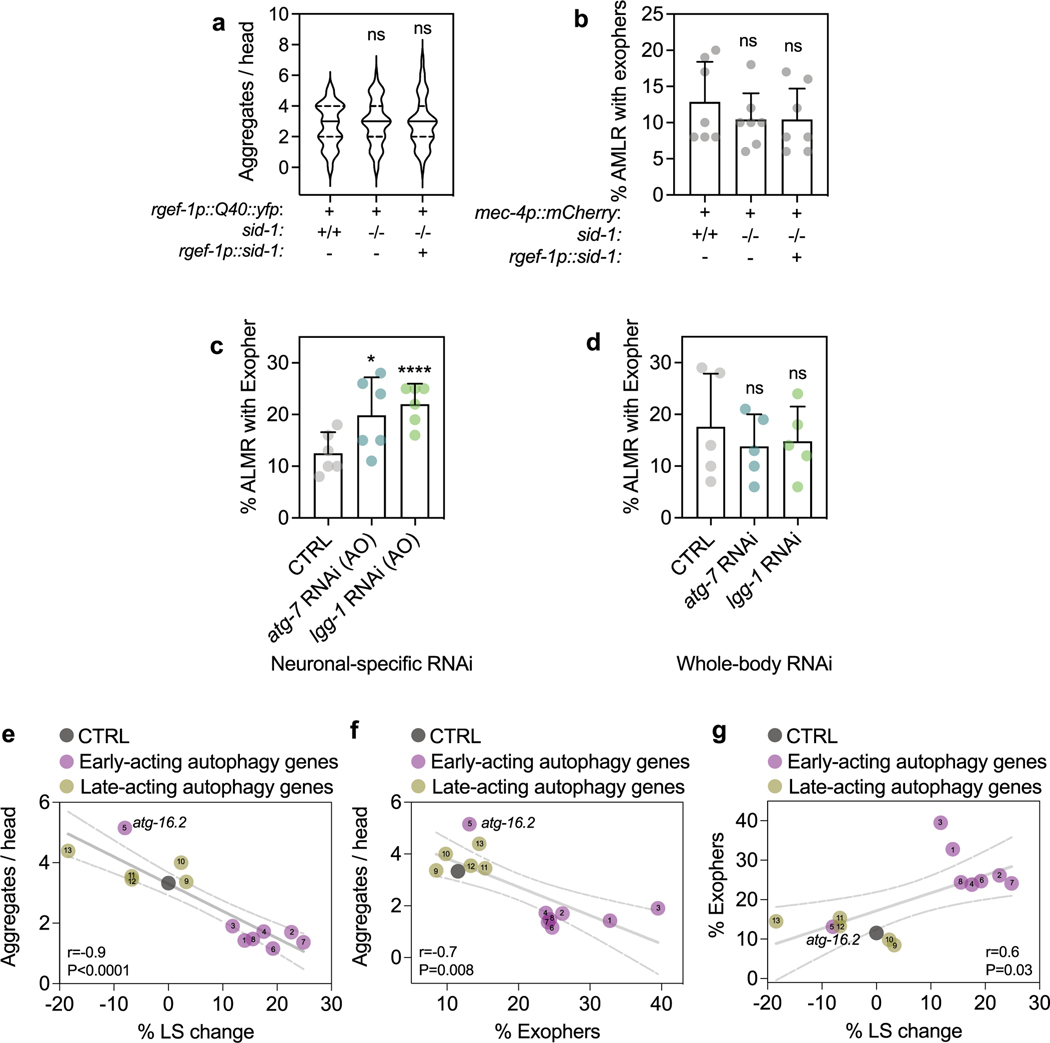
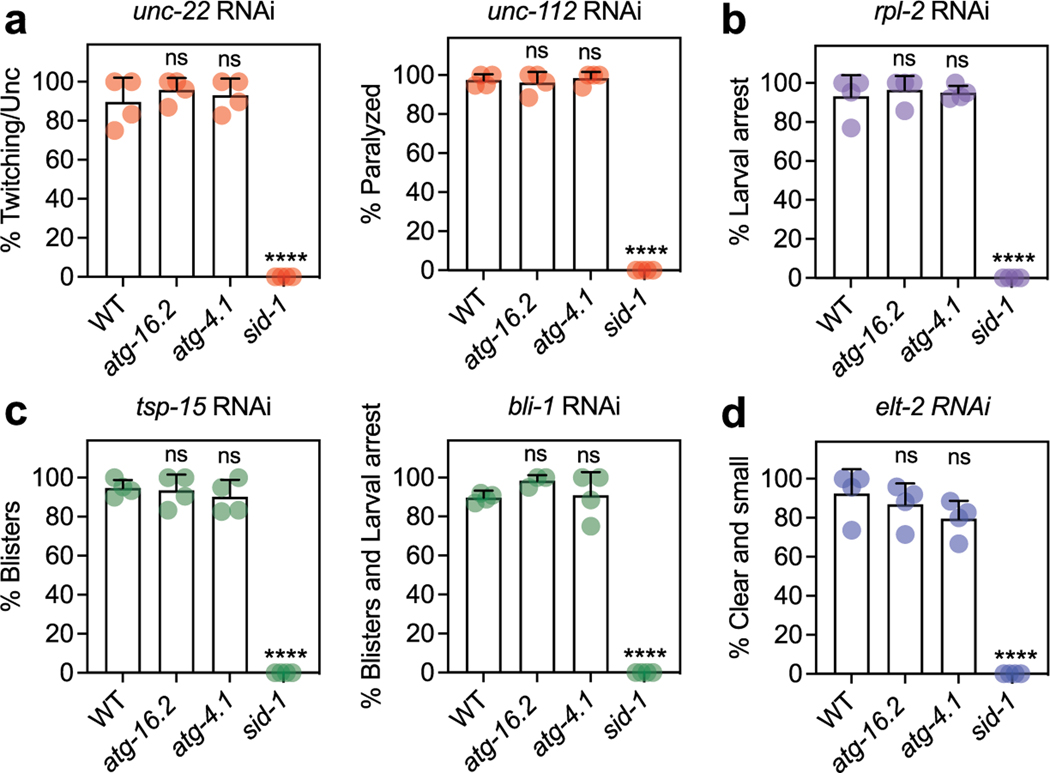
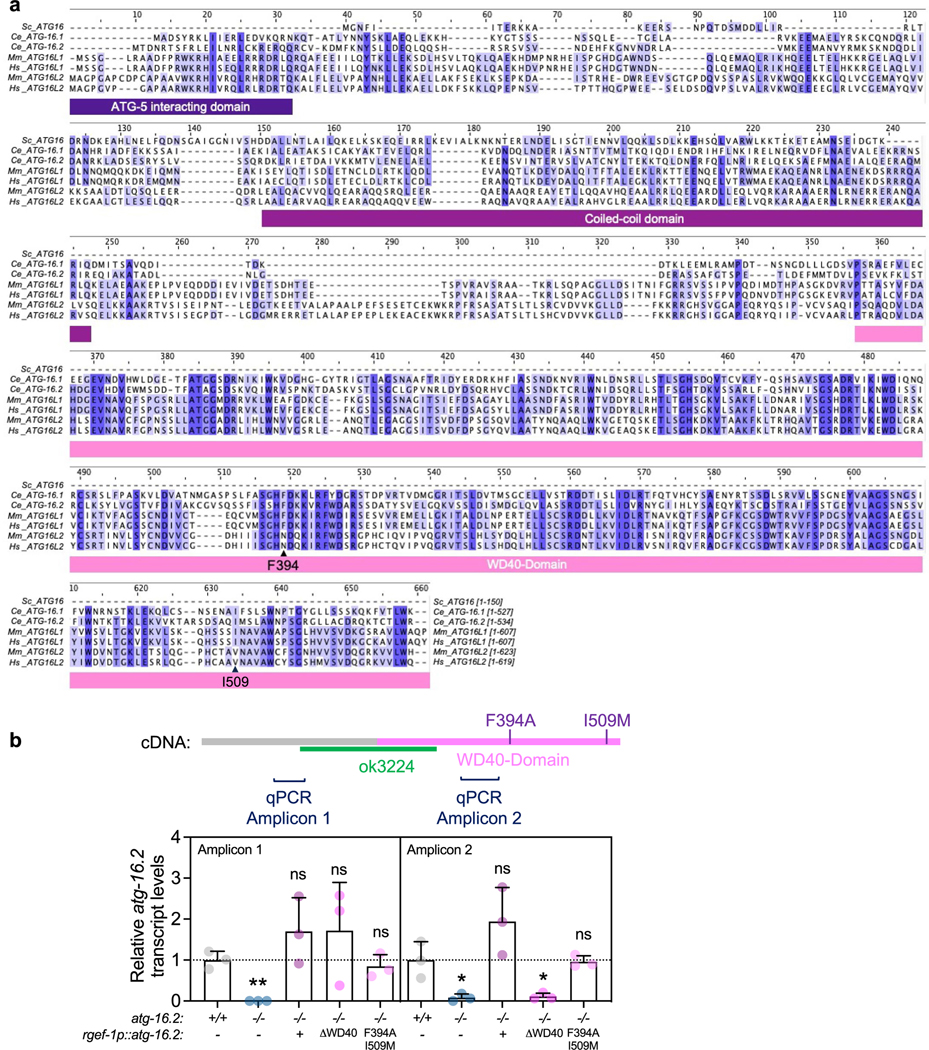
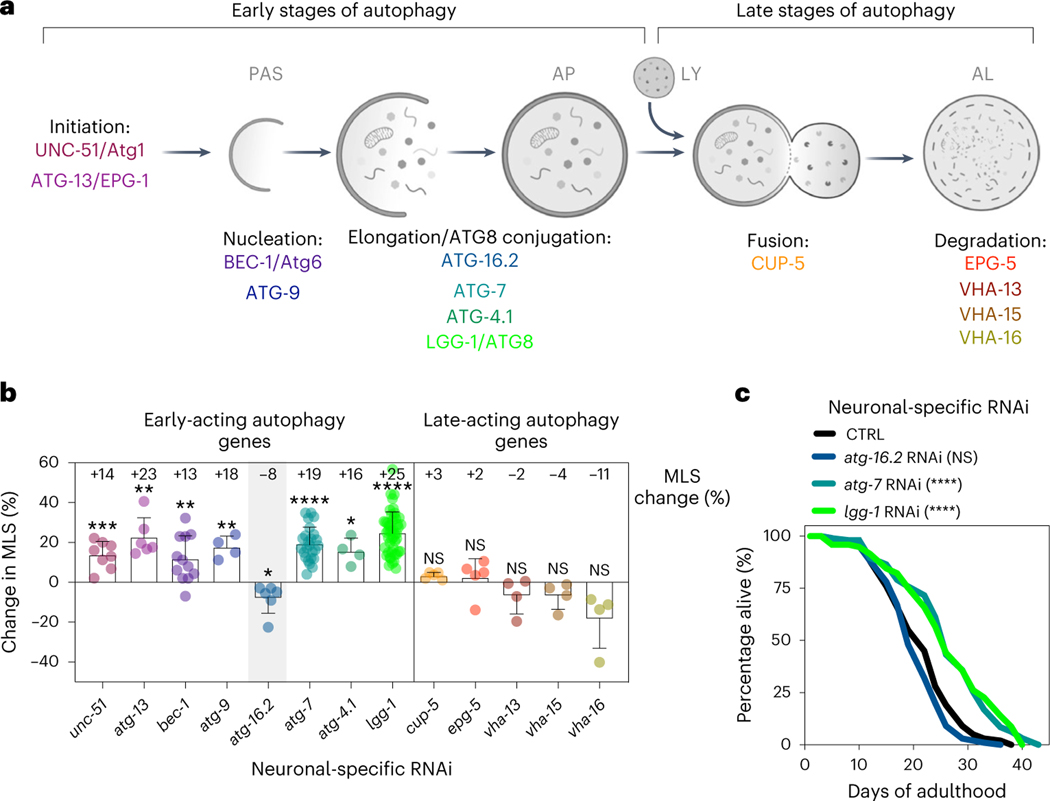
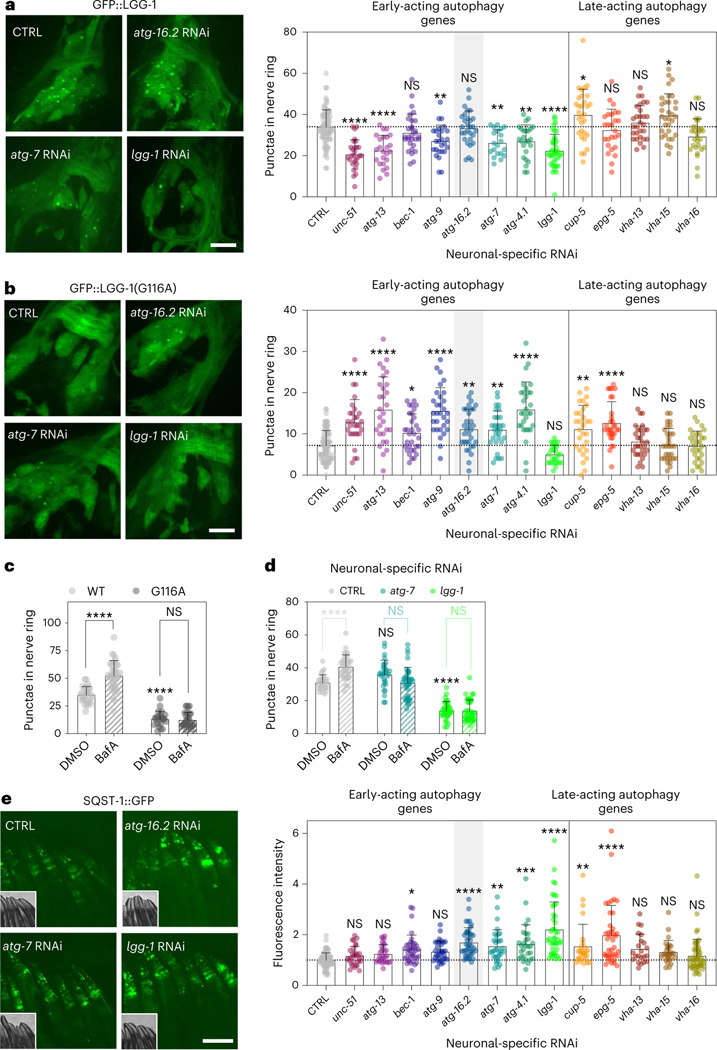
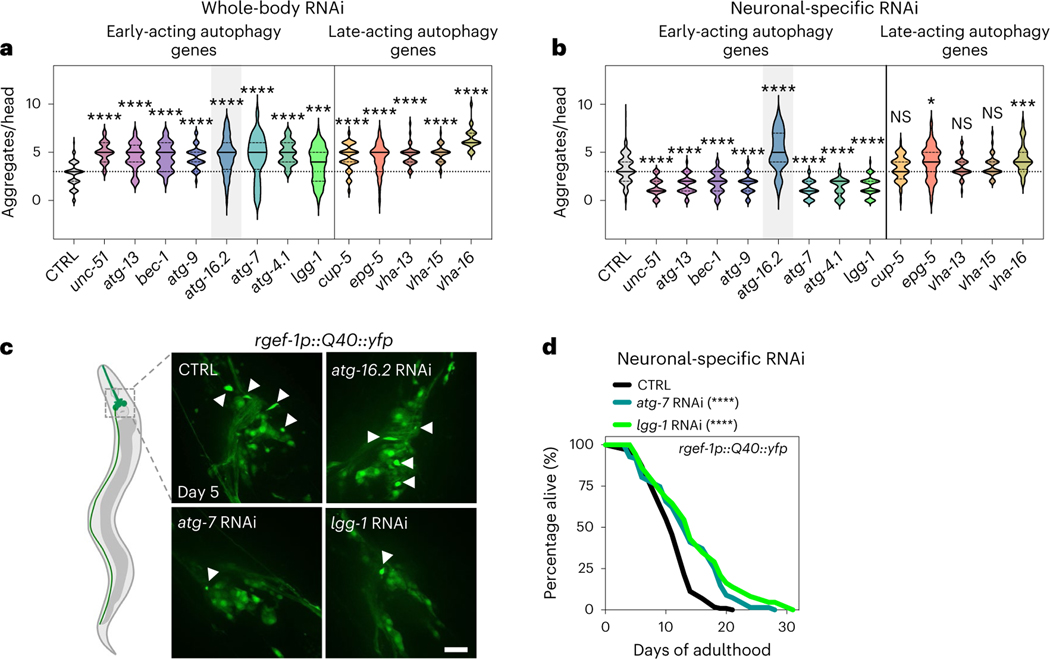
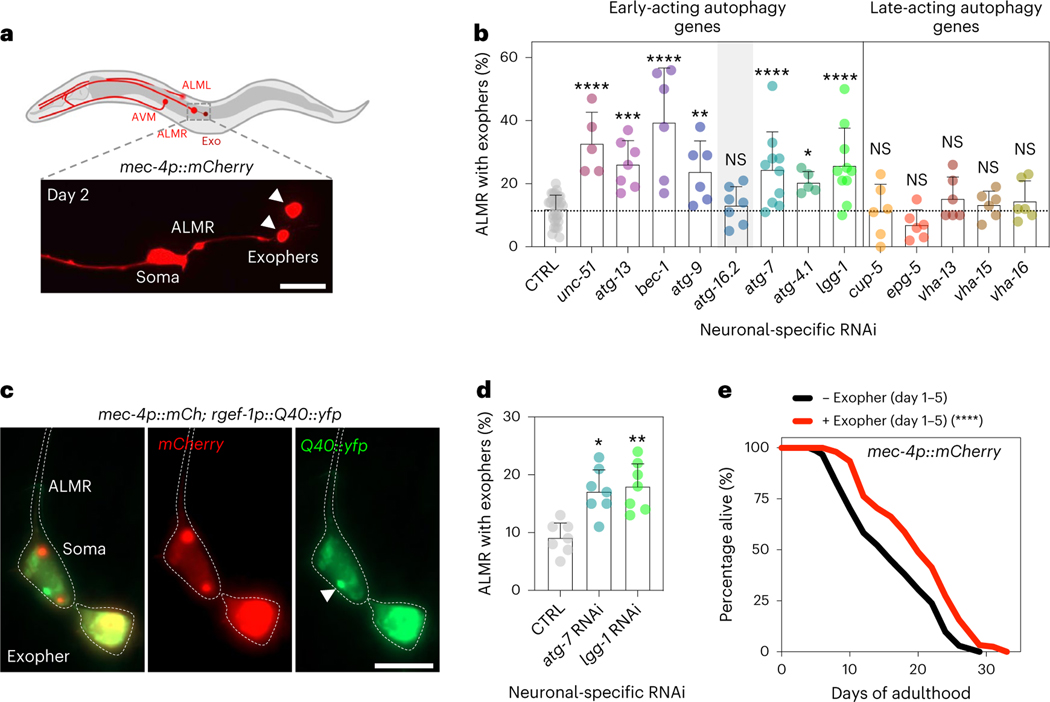
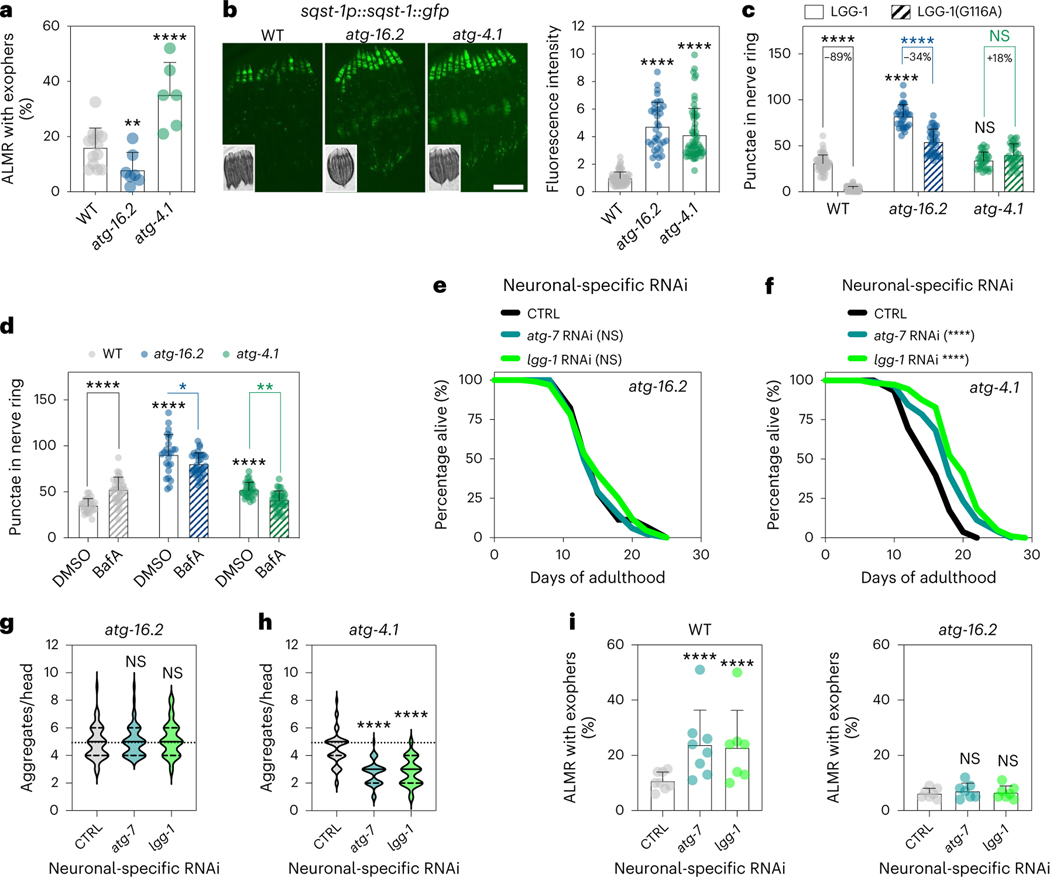
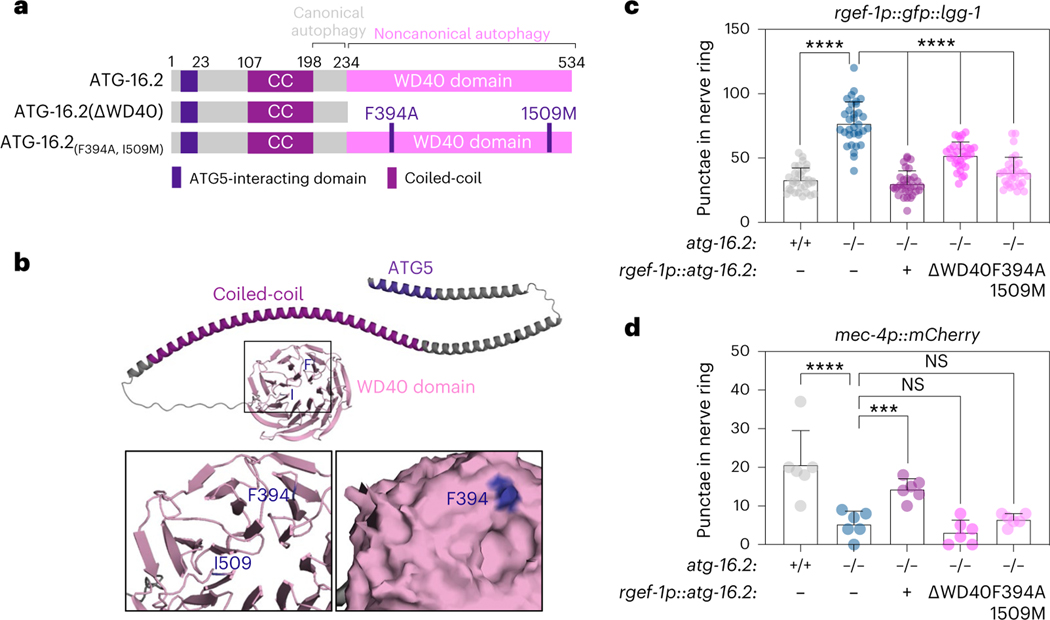
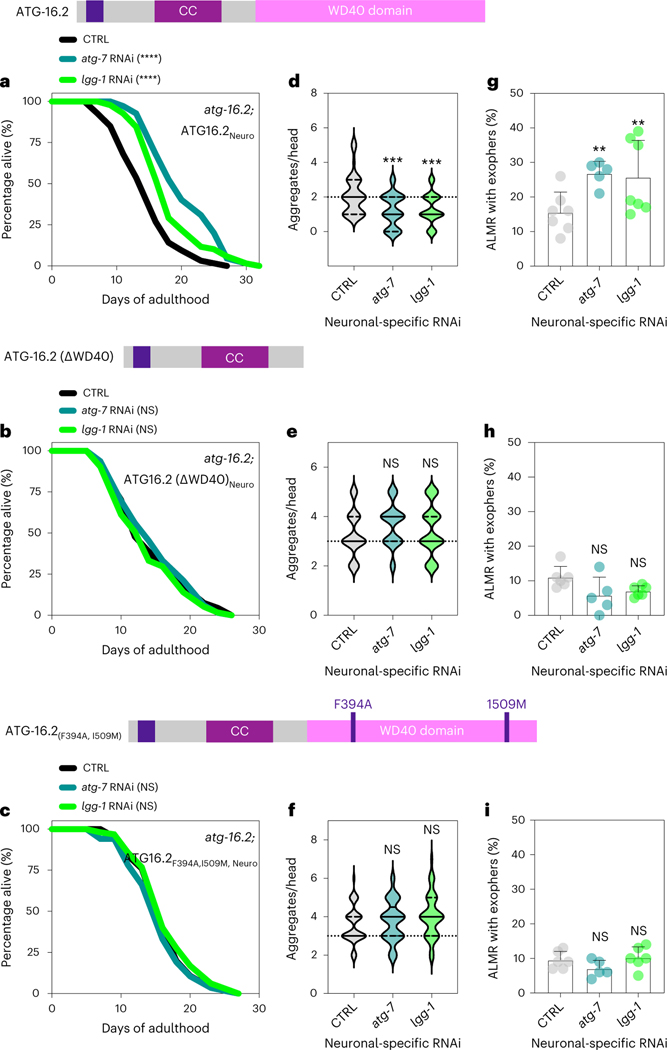
While autophagy genes are required for lifespan of long-lived animals, their tissue-specific roles in aging remain unclear. Here, we inhibited autophagy genes in Caenorhabditis elegans neurons, and found that knockdown of early-acting autophagy genes, except atg-16.2, increased lifespan, and decreased neuronal PolyQ aggregates, independently of autophagosomal degradation. Neurons can secrete protein aggregates via vesicles called exophers. Inhibiting neuronal early-acting autophagy genes, except atg-16.2, increased exopher formation and exopher events extended lifespan, suggesting exophers promote organismal fitness. Lifespan extension, reduction in PolyQ aggregates and increase in exophers were absent in atg-16.2 null mutants, and restored by full-length ATG-16.2 expression in neurons, but not by ATG-16.2 lacking its WD40 domain, which mediates noncanonical functions in mammalian systems. We discovered a neuronal role for C. elegans ATG-16.2 and its WD40 domain in lifespan, proteostasis and exopher biogenesis. Our findings suggest noncanonical functions for select autophagy genes in both exopher formation and in aging.


Conflict of interest statement

Competing interests

The authors declare no competing interests. The funders had no role in the study design, data collection and analysis, decision to publish or preparation of the manuscript.

Figures

Extended Data Fig. 1 |
Extended Data Fig. 1 |. Neuronal expression of SID-1, an RNA channel protein, leads to RNAi-competent neurons.
(a) Mean GFP fluorescence intensity in head region of rgef-1p::gfp animals on day 1 to day 12 of adulthood, relative to day 1. Error bars are s.d. of n = 3 experiments, with n = 29, 34, 32, 24, 28, 19 animals over 3 independent experiments. ns P = 0.78, P = 0.05, P = 0.116, ****P < 0.0001, **P = 0.005, by one-way ANOVA with Dunnett’s multiple comparisons test. (b-f) Wild-type animals (N2, WT), sid-1; rgef-1p::sid-1 + rgef-1p::gfp, and sid-1 mutants after whole-life RNAi against the indicated gene with tissue-specific functions, compared to control (CTRL). (b) Representative animals are shown with WT animals displaying paralysis (Prz) on unc-112 RNAi, larval arrest (Lva) on rpl-2 RNAi, blister formation (Bli) and larval arrest (Lva) on bli-1 RNAi, and clear (Clr) and larval arrest on elt-2 RNAi. Mean percent phenotypic penetrance after knockdown of genes with functions in (c) body-wall muscle; unc-22 – twitching and uncoordinated movement (Unc) (n = 8 experiments, ****P < 0.0001) and unc-112 – paralysis (n = 7 experiments, ****P < 0.0001), (d) a ubiquitous manner; rpl-2 – larval arrest (n = 8 experiments, ****P < 0.0001), (e) hypodermis; tsp-15 – blisters (n = 8 experiments, ****P < 0.0001) and bli-1 – blisters and larval arrest; (f) intestine; elt-2 – clear and larval arrest. Error bars are s.d. (g) Mean GFP fluorescence intensity in head region of day 1 sid-1; rgef-1p::sid-1 + rgef-1p::gfp rgef-1p::gfp animals after whole-life gfp RNAi compared to control (CTRL). Error bars are s.d. with n = 30 over 3 independent experiments. ****P < 0.0001, **P = 0.005, by two-tailed Student’s t-test. Scale bar: 100 μm. (h) Mean GFP fluorescence intensity in head region of day 1 sid-1; rgef-1p::sid-1 + rgef-1p::gfp rgef-1p::gfp animals after whole-life lgg-1 RNAi (n = 32) compared to control (CTRL) (n = 35). Error bars are s.d. over 3 independent experiments. ****P < 0.0001 by two-tailed Student’s t-test. Scale bar: 100 μm. (i) Mean percent of shrinker phenotype in day 2 WT, rde-1; unc-47p::rde-1::SL2::sid-1 (capable of GABA neuron-specific RNAi), sid-1; rgef-1p::sid-1 + rgef-1p::gfp, or sid-1 animals after two generations of whole-life snb-1 or unc-13 RNAi compared to control (CTRL). Error bars are s.d. with ****P < 0.0001 and ns P > 0.99 by one-way ANOVA with Dunnett’s multiple comparisons test.
Extended Data Fig. 2 |
Extended Data Fig. 2 |. Healthspan and neuronal phenotypes of animals after neuronal inhibition of atg-7 and lgg-1/ATG8.
(a) Mean body bends per 20 s of sid-1; rgef-1p::sid-1 + rgef-1p::gfp animals after whole-life atg-7, or lgg-1/ATG8 RNAi compared to control (CTRL). Error bars are s.e.m. of one representative experiment, each with n = 16 animals. Experiment was performed three times with similar results. Linear regression comparison versus CTRL: atg-7 RNAi: Pslope = 0.5; Py-intercept = 0.02; lgg-1/ATG8 RNAi: Pslope = 0.3; Py-intercept = 0.01. (b) Mean number of contractions in the terminal pharyngeal bulb per 30 s of sid-1; rgef-1p::sid-1 + rgef-1p::gfp animals after whole-life atg-7, or lgg-1/ATG8 RNAi compared to control (CTRL). Error bars are s.d. of n = 30 animals over 3 independent experiments. Linear regression comparison versus CTRL: atg-7 RNAi: Pslope = 0.4; Py-intercept = 0.4; lgg-1 RNAi: Pslope = 0.3; Py-intercept = 0.5. (c) Mean number of progeny produced per day in sid-1; rgef-1p::sid-1 + rgef-1p::gfp animals after atg-7 (n = 19 animals), or lgg-1/ATG8 RNAi (n = 18 animals) compared to control (CTRL) (n = 22 animals) over 2 independent experiments. Error bars are s.d. CTRL versus atg-7 RNAi: ns P = 0.72, 0.89, 0.91, 0.82, >0.99; CTRL versus lgg-1/ATG8 RNAi: ns P = 0.95, 0.96,0.60, 0.70, >0.99, by two-way ANOVA with Dunnett’s multiple comparisons test. (d) Analysis of integrity of sensory neurons in day 5 sid-1; rgef-1p::sid-1 + rgef-1p::gfp animals after atg-7, or lgg-1/ATG8 RNAi compared to control (CTRL). Sensory mutants daf-10(e1387) and osm-6(p811) are negative controls. Shown are representative images of n = 10 animals. Experiment was performed three times with similar results. Scale bar, 20 μm. (e) Representative image of neuronal branch (arrowhead) from ALM neuron in day 15 sid-1; rgef-1p::sid-1+ rgef-1p::gfp animals. Scale bar: 20 μm. Mean percent of animals with branches after whole-life atg-7, or lgg-1/ATG8 dsRNA compared to control (CTRL) of n = 4 experiments. Error bars are s.d. ***P = 0.0002, ****P < 0.0001 by Cochran-Mantel-Haenszel test. (f) Mean chemotaxis index of day 5 sid-1; rgef-1p::sid-1 + rgef-1p::gfp animals after whole-life atg-7, or lgg-1/ATG8 RNAi using the chemoattractant butanone. Error bars are 95% C.I. of n = 4 experiments. *P = 0.048, **P = 0.0094, by one-way ANOVA with Dunnett’s multiple comparisons test.
Extended Data Fig. 3 |
Extended Data Fig. 3 |. Autophagy status is unchanged in animals expressing sid-1 and in non-neuronal tissues after neuronal knockdown of early-acting autophagy genes.
(a) Mean neuronal GFP::LGG-1 and GFP::LGG-1(G116A) punctae in day 1 wild-type (sid-1 + /+) (n = 28, 29) and sid-1(qt9) (sid-1−/−) animals (n = 27, 27) with or without rgef-1p::sid-1 transgene (rgef-1p::sid-1 (+)) (n = 26, 29). Error bars are s.d. over 3 independent experiments. Comparison between strains: LGG-1: ns P = 0.75, P = 0.97, G116A: ns P = 0.98, P > 0.99. Comparison of lipidated and unlipidated structures: ****P < 0.0001, by two-way ANOVA with Tukey’s multiple comparisons test. (b) Mean sqst-1p::sqst-1::gfp fluorescence intensity in head region of day 1 wild-type (sid-1 + /+), and sid-1(qt9) (sid-1(−/−)) animals with or without rgef-1p::sid-1 transgene (rgef-1p::sid-1 (+)) on day 1 of adulthood. Error bars are s.d. of n = 31 animals over 3 independent experiments. ns P = 0.18 and P = 0.59 by one-way ANOVA with Dunnett’s multiple comparisons test. (c) GFP::LGG-1 punctae in intestinal cells of day 1 wild-type (sid-1 + /+) (n = 59) and sid-1(qt9) (sid-1−/−) animals (n = 62) with or without rgef-1p::sid-1 transgene (rgef-1p::sid-1 (+)) (n = 62). Violin plots with solid line indicating median and dashed lines indicating quartiles. ns P = 0.79, P = 0.99 by one-way ANOVA with Dunnett’s multiple comparisons test. (d) GFP::LGG-1 punctae in body-wall muscle areas of day 1 wild-type (sid-1 + /+) (n = 48) and sid-1(qt9) (sid-1−/−) animals (n = 45) with or without rgef-1p::sid-1 transgene (rgef-1p::sid-1 (+)) (n = 52). Violin plots with solid line indicating median and dashed lines indicating quartiles. ns P = 0.64, P = 0.70 by one-way ANOVA with Dunnett’s multiple comparisons test. (e) GFP::LGG-1 punctae in intestinal cells of day 1 sid-1; rgef-1p::sid-1 + rgef-1p::gfp; lgg-1p::gfp::lgg-1 animals after whole-life atg-7 (n = 65), or lgg-1/ATG8 (n = 48) RNAi compared to control (CTRL) (n = 81). Violin plots with solid line indicating median and dashed lines indicating quartiles. ns P = 0.98, P = 0.71 by one-way ANOVA with Dunnett’s multiple comparisons test. (f) GFP::LGG-1 punctae in body-wall muscle areas of day 1 sid-1; rgef-1p::sid-1 + rgef-1p::gfp; lgg-1p::gfp::lgg-1 animals after whole-life atg-7 (n = 54), or lgg-1/ATG8 (n = 53) RNAi compared to control (CTRL) (n = 49). Violin plots with solid line indicating median and dashed lines indicating quartiles. ns P = 0.34, P = 0.96 by one-way ANOVA with Dunnett’s multiple comparisons test.
Extended Data Fig. 4 |
Extended Data Fig. 4 |. Neuronal PolyQ aggregation, exopher formation and lifespan extension are correlated.
(a) Number of neuronal PolyQ aggregates in day 7 rgef-1::Q40::yfp wild-type (sid-1 + /+) (n = 41) and sid-1(qt9) (sid-1−/−) animals (n = 48 with or without rgef-1p::sid-1 transgene (rgef-1p::sid-1 (+)) (n = 42). Violin plots with solid line indicating median and dashed lines indicating quartiles. ns P = 0.79, P = 0.82 by one-way ANOVA with Dunnett’s multiple comparisons test. (b) Mean percent of ALMR neurons with exophers of day 2 mec-4p::mCherry wild-type (sid-1 + /+) (n = 228 animals) and sid-1(qt9) (sid-1−/−) (n = 262 animals) with or without rgef-1p::sid-1 transgene (rgef-1p::sid-1 (+)) (n = 295 animals). Error bars are s.d. of n = 7 experiments, ns P = 0.62, P = 0.54 by two-sided Cochran-Mantel-Haenszel test. (c) Mean percent of ALMR neurons with exophers of day 2 sid-1; rgef-1p::sid-1 + rgef-1p::gfp; mec-4p::mCherry animals (n = 247 animals) after adult-only atg-7 (n = 271 animals), or lgg-1/ATG8 (n = 285 animals) RNAi compared to control (CTRL). Error bars are s.d. of n = 6 experiments, *P = 0.028, P = 0.00006 by two-sided Cochran-Mantel-Haenszel test. (d) Mean percent of ALMR neurons with exophers of day 2 mec-4p::mCherry animals (n = 151 animals) after whole-life atg-7 (n = 157 animals), or lgg-1/ATG8 (n = 180 animals) RNAi compared to control (CTRL). Error bars are s.d. of n = 5 experiments, ns P = 0.39, P = 0.53 by two-sided Cochran-Mantel-Haenszel test. (e-g) Percent mean lifespan (LS) change (Fig. 1b), number of neuronal PolyQ aggregates (Fig. 3b), and mean percent of AMLR neurons with exophers (Fig. 4b) plotted against each other with simple linear regression (solid line with 95% C.I. as dashed lines). Numbers refer to specific RNAi treatment; 1unc-51/ATG1, 2atg-13, 3bec-1/BECN1, 4atg-9, 5atg-16.2, 6atg-7, 7atg-4.1, 8lgg-1/ATG8, 9cup-5, 10epg-5, 11vha-13, 12vha-15, 13vha-16. P values determined by two-sided Spearman correlation test.
Extended Data Fig. 5 |
Extended Data Fig. 5 |. atg-16.2 and atg-4.1 mutants display similar RNAi phenotypes.
(a-d) Phenotypes of day 2 WT, atg-16.2(ok3224), atg-4.1(bp501), and sid-1(qt9) animals after whole-life RNAi against a specific gene expressed in different tissues. Mean percent phenotypic penetrance after knockdown of genes with functions in (a) body-wall muscle; unc-22 – twitching and uncoordinated movement (Unc) and unc-112 – paralysis, (b) a ubiquitous manner; rpl-2 – larval arrest, (c) hypodermis; tsp-15 – blisters and bli-1 – blisters and larval arrest; (d) intestine; elt-2 – clear and larval arrest. Error bars are s.d. of n = 4 experiments. (a) unc-22 RNAi: ns P = 0.59, P = 0.87, ****P < 0.0001. unc-112 RNAi: ns P = 0.92, P = 0.96, ****P < 0.0001. (b) rpl-2 RNAi: ns P = 0.82, P = 0.96, ****P < 0.0001. (c) tsp-15 RNAi: ns P = 0.99, P = 0.64, ****P < 0.0001. bli-1 RNAi: ns P = 0.24, P = 0.99, ****P < 0.0001. (d) elt-2 RNAi: ns P = 0.76, P = 0.18, ****P < 0.0001 by one-way one-way ANOVA with Dunnett’s multiple comparisons test.
Extended Data Fig. 6 |
Extended Data Fig. 6 |. Multiple sequence alignment of ATG16 proteins, and atg-16.2 mRNA expression levels in C. elegans.
(a) Primary sequences of ATG16 proteins from S. cerevisiae (1 isoform, Sc_ATG16), C. elegans (2 isoforms, Ce_ATG-16.1, Ce_ATG-16.2), Mus musculus (2 isoforms, Mm_ATG16L1, MmATG16L2), and humans (2 isoforms, Hs_ATG16L1, Hs_ATG16L2) were aligned by the Clustal Omega and colored by conservation with darker shades indicated increased conservation ( Jalview). Protein elements of ATG16 proteins are drawn under the alignment and phenylalanine 349 and isoleucine 509 are indicated with an arrow. Sequences showed are ATG16 (NP_013882.1) in S. cerevisiae, ATG16.2 (NP_495299.2) in C. elegans, ATG16 (NP_001138124.2) in D. melanogaster, ATG16L1 (NP_001192320.1) in M. musculus, and ATG16L1 (NP_001350671.1) in H. sapiens. (b) Transcript levels of atg-16.2 in wild-type (WT), atg-16.2(ok3224), and atg-16.2(ok3224) animals expressing full-length atg-16.2, atg-16.2(ΔWD40), or atg-16.2(Phe394A, Ile509Met) from the neuronal rgef-1 promoter. Schematic of atg-16.2 cDNA indicates the ok3224 deletion, the WD40 domain, the position of the Phe394Ala and Ile509Met point mutations, and the amplicons produced by the primers used in this experiment. Data are the mean and s.e.m. of three biological replicates, each with three technical replicates, and are normalized to the mean expression levels of three housekeeping genes. Amplicon 1: **P = 0.0013, ns P = 0.23, P = 0.36, P = 0.49, Amplicon 2: *P = 0.03, ns P = 0.16, *P = 0.03, ns P = 0.89 by unpaired two-sided t-test with control.
Fig. 1 |
Fig. 1 |. With the exception of atg-16.2, neuronal inhibition of early-acting autophagy genes extends lifespan.
a, Schematic showing early-acting and late-acting genes in the autophagy process investigated in this study (see the introduction for additional information). Created using BioRender.com. b, Average mean lifespan change (% MLS change, indicated) in sid-1; rgef-1p::sid-1 animals after RNAi of the listed autophagy-related genes compared to control. All lifespan data were pooled irrespective of whole-life or adult-only RNAi initiation. Error bars indicate the s.d. P values: not significant (NS) P > 0.05, *P < 0.05, **P < 0.01, ***P < 0.001, ****P < 0.0001, by a two-sided, one-sample t-test compared to hypothetical mean of 0. See Supplementary Table 2 for n, all P values and statistical details and Supplementary Table 3 for details of individual lifespan experiments. Shading of atg-16.2 emphasizes this RNAi treatment as an exception for lifespan extension by early-acting autophagy genes. c, Lifespan analyses of sid-1; rgef-1p::sid-1 + rgef-1p::gfp animals after whole-life atg-16.2, atg-7 or lgg-1/ATG8 RNAi compared to control (CTRL). Statistical significance was determined by two-sided log-rank test, NS, P = 0.07, ****P < 0.0001. See Supplementary Table 3 for details and repeats.
Fig. 2 |
Fig. 2 |. Neuronal inhibition of all early-acting autophagy genes impairs autophagy.
a, Representative images of nerve-ring neurons and mean number of GFP::LGG-1/ATG8 punctae of day 1 sid-1; rgef-1p::sid-1; rgef-1::gfp::lgg-1 animals after whole-life autophagy gene RNAi. Error bars are s.d. NS P > 0.05, *P < 0.05, **P < 0.01, ***P < 0.001, ****P < 0.0001, by one-way analysis of variance (ANOVA) with Dunnett’s multiple-comparison test. See Supplementary Table 2 for n, all P values and statistical details. The brightness of the image displaying lgg-1/ATG8 RNAi was artificially enhanced. Scale bar, 10 μm. b, Representative images of nerve-ring neurons and mean number of non-lipidated GFP::LGG-1/ATG8(Gly116Ala) punctae in day 1 sid-1; rgef-1p::sid-1; rgef-1::gfp::lgg-1(Gly116Ala) animals after whole-life autophagy gene RNAi. Error bars are s.d. P values as in a. See Supplementary Table 2 for all P values and statistical details. The brightness of the nerve-ring image after lgg-1/ATG8 RNAi is artificially enhanced. Scale bar, 10 μm. c, Mean number of GFP::LGG-1/ATG8 punctae in nerve-ring neurons in day 1 rgef-1p::gfp::lgg-1 (WT)-expressing animals after injection of animals with vehicle (dimethylsulfoxide (DMSO); n = 27 animals) or BafA (n = 34 animals), and in animals expressing rgef-1p::gfp::lgg-1(Gly116Ala) (Gly116Ala; DMSO, n = 23; BafA, n = 28 animals), over three independent experiments. Error bars are s.d. NS P = 0.99, ****P < 0.0001, by two-way ANOVA with Tukey’s multiple-comparisons test. d, Mean number of GFP::LGG-1/ATG8 punctae in nerve-ring neurons after injection of animals with vehicle (DMSO) or BafA in day 1 sid-1; rgef-1p::sid-1; rgef-1::gfp::lgg-1 animals after whole-life atg-7 RNAi (DMSO, n = 30; BafA, n = 34 animals, NS P = 0.051) or lgg-1/ATG8 RNAi (DMSO, n = 33; BafA, n = 38 animals, NS P > 0.99) compared to control (CTRL) (DMSO, n = 27; BafA, n = 34 animals; ****P < 0.0001) over three independent experiments. Error bars are s.d. CTRL-DMSO versus atg-7-DMSO: NS P = 0.12; CTRL-DMSO versus lgg-1-DMSO: ****P < 0.0001, by two-way ANOVA with Tukey’s multiple-comparisons test. e, Representative images and mean fluorescence intensity in head regions of day 1 sid-1; rgef-1p::sid-1; sqst-1p::sqst-1::gfp animals after whole-life autophagy gene RNAi. Error bars are s.d. P values as in a. See Supplementary Table 2 for n, all P values and statistical details. Scale bar, 100 μm. Shading of atg-16.2 emphasizes this RNAi treatment as an exception for lifespan extension by early-acting autophagy genes (Fig. 1).
Fig. 3 |
Fig. 3 |. Neuronal polyQ aggregation is increased by whole-body inhibition, but reduced by neuronal inhibition of early-acting autophagy genes, except atg-16.2.
a, Number of neuronal polyQ aggregates in day 5 rgef-1::Q40::yfp animals after whole-life autophagy gene RNAi, except for adult-only RNAi for vha-13, vha-15 and vha-16 to avoid larval arrest (unc-51/ULK and bec-1/BECN1 RNAi clones were previously tested by us with similar results, and bec-1/BECN1 and atg-7 RNAi clones increase Htn-Q150 aggregation). In the violin plots, the solid line indicates the median and dotted lines indicate quartiles. ***P < 0.001, ****P < 0.0001, by one-way ANOVA with Dunnett’s multiple-comparison test. See Supplementary Table 2 for n, all P values and statistical details. b, Number of neuronal polyQ aggregates in day 5 sid-1; rgef-1p::sid-1; rgef-1::Q40::yfp animals after whole-life autophagy gene RNAi. In the violin plots, the solid line indicates the median and dotted lines indicate quartiles. NS P > 0.05, *P < 0.05, ***P < 0.001, ****P < 0.0001, by one-way ANOVA with Dunnett’s multiple-comparison test. See Supplementary Table 2 for n, all P values and statistical details. Shading of atg-16.2 emphasizes this RNAi treatment as an exception for decreased polyQ aggregate number by early-acting autophagy genes. c, Representative images of nerve-ring neurons of day 5 sid-1; rgef-1p::sid-1; rgef-1::Q40::yfp animals after whole-life CTRL, atg-16.2, atg-7 or lgg-1/ATG8 RNAi with arrowheads indicating polyQ aggregates. Three experimental repeats. Scale bar, 20 μm. d, Lifespan analysis of sid-1; rgef-1p::sid-1 + rgef-1p::gfp; rgef-1::Q40::yfp animals after whole-life atg-7, or lgg-1/ATG8 RNAi compared to control (CTRL). Statistical significance was determined by two-sided log-rank test, ****P < 0.0001. See Supplementary Table 4 for details and repeats.
Fig. 4 |
Fig. 4 |. Neuronal inhibition of early-acting autophagy genes, except atg-16.2, induces exophers, which secrete Q40::yfp and extend lifespan.
a, Exophers originating from the ALMR neuron in sid-1; rgef-1p::sid-1; mec-4p::mCherry animals. Representative diagram showing two exophers (arrowheads) and the ALMR soma on day 2. Scale bar, 20 μm. b, Mean percentage of ALMR neurons with exophers in day 2 sid-1; rgef-1p::sid-1; mec-4p::mCherry animals after whole-life autophagy gene RNAi. Error bars are the s.d. NS P > 0.05, *P < 0.05, **P < 0.01, ***P < 0.001, ****P < 0.0001, by two-sided Cochran–Mantel–Haenszel test to compare each RNAi to control (CTRL). See Supplementary Table 2 for n, all P values and statistical details. Shading of atg-16.2 emphasizes this RNAi treatment as an exception for increased exopher formation by early-acting autophagy genes. c, Representative images of an ALMR neuron of day 2 sid-1; rgef-1p::sid-1; mec-4p::mCherry; rgef-1p::Q40::yfp animals showing the expression of mCherry and Q40::yfp. polyQ collection in the soma (arrowhead)) and in the exopher is visible. Six experimental repeats. Scale bar, 20 μm. d, Mean percentage of ALMR neurons with exophers in day 2 sid-1; rgef-1p::sid-1; mec-4p::mCherry; rgef-1p::Q40::yfp animals after whole-life atg-7 RNAi, or lgg-1/ATG8 RNAi compared to control (CTRL). Error bars are the s.d. of n = 7 experiments with n = 317, 313 and 316 animals. *P = 0.016, **P = 0.0049, by two-sided Cochran–Mantel–Haenszel test. e, Lifespan analysis of mec-4p::mCherry animals sorted for presence of exophers on day 1–5 of adulthood. Statistical significance was determined by two-sided log-rank test, ****P < 0.0001. See Supplementary Table 5 for details and repeats.
Fig. 5 |
Fig. 5 |. atg-16.2 is required for benefits of neuronal inhibition of early-autophagy genes.
a, Mean percentage of ALMR neurons with exophers in day 2 WT, atg-16.2(ok3224) and atg-4.1(bp501) animals expressing mec-4p::mCherry. Error bars are the s.d. WT (n = 261 animals) versus atg-16.2 (n = 274 animals) (n = 7 experiments, **P = 0.007), WT (n = 273 animals) versus atg-4.1 (n = 243 animals) (n = 6 experiments, ****P < 0.0001) by two-sided Cochran–Mantel–Haenszel test. b, Mean GFP fluorescence intensity in head region in day 1 WT, atg-4.1(bp501) and atg-16.2(ok3224) animals expressing sqst-1p::sqst-1::gfp. Error bars are the s.d. WT (n = 30) versus atg-16.2 (n = 35), ****P < 0.0001; WT (n = 38) versus atg-4.1 (n = 58), ****P < 0.0001) by two-sided t-test over three independent experiments. Representative images from one experiment. Scale bar, 200 μm. c, Mean neuronal GFP::LGG-1/ATG8-positive and GFP::LGG-1(Gly116Ala)-positive punctae in day 1 WT, atg-4.1(bp501) and atg-16.2(ok3224) animals. Error bars are the s.d. WT-GFP::LGG-1 (n = 57) versus WT-GFP::LGG-1(Gly116Ala) (n = 61), ****P < 0.0001; atg-16.2-GFP::LGG-1 (n = 31) versus atg-16.2-GFP::LGG-1(Gly116Ala) (n = 32), ****P < 0.0001; atg-4.1-GFP::LGG-1 (n = 30) versus atg-4.1-GFP::LGG-1(Gly116Ala) (n = 28), NS P = 0.15. Comparison between strains: WT (n = 27) versus atg-16.2 (n = 31), ****P < 0.0001, WT (n = 30) versus atg-4.1 (n = 30) NS P = 0.75 > 0.05, ****P < 0.0001, over three independent experiments by two-way ANOVA with Tukey’s multiple-comparisons test. d, Mean neuronal GFP::LGG-1/ATG8-positive punctae in day 1 WT, atg-4.1(bp501) and atg-16.2(ok3224) animals after vehicle (DMSO) or BafA injections to block autophagy. Error bars are the s.d. WT-DMSO (n = 27) versus WT-BafA (n = 34), ****P < 0.0001; atg-16.2-DMSO (n = 28) versus atg-16.2-BafA (n = 34), *P = 0.043; atg-4.1-DMSO (n = 24) versus atg-4.1-BafA (n = 31), **P = 0.0097. Comparison between strains: WT (n = 27) versus atg-16.2 (n = 28), ****P < 0.0001, WT (n = 27) versus atg-4.1 (n = 24) ****P < 0.0001, over three independent experiments by two-way ANOVA with Tukey’s multiple-comparisons test. e,f, Lifespan analyses in sid-1; rgef-1p::sid-1 + rgef-1p::gfp animals carrying atg-16.2(ok3224) (e) or atg-4.1(bp501) mutations (f) after whole-life atg-7, or lgg-1/ATG8 RNAi compared to control (CTRL). Two-sided log-rank test, NS P = 0.5, P = 0.6 (e), ****P < 0.0001 (f). See Supplementary Table 6 for details and repeats. g,h, Number of neuronal polyQ aggregates in day 5 sid-1; rgef-1p::sid-1 + rgef-1p::gfp; rgef-1::Q40::yfp animals carrying atg-16.2(ok3224) (g) or atg-4.1(bp501) mutations (h) after RNAi treatments as in e. In the violin plots, the solid line indicates the median and dashed lines indicate quartiles. n = 45 animals each in three independent experiments (g) atg-16.2: NS P = 0.76, P = 0.46; (h) atg-4.1: ****P < 0.0001 by one-way ANOVA with Dunnett’s multiple-comparisons test. i, Mean percentage of ALMR with exophers of day 2 sid-1; rgef-1p::sid-1 + rgef-1p::gfp; mec-4p::mCherry (WT) animals and atg-16.2(ok3224) animals after RNAi treatments as in eh. Error bars are the s.d. of n = 7 experiments with n = 273, 255 and 257 animals (left) and n = 407, 411 and 357 animals (right). WT: ****P < 0.0001; atg-16.2: P = 0.62, P = 0.77 by two-sided Cochran–Mantel–Haenszel test.
Fig. 6 |
Fig. 6 |. The WD40 domain of ATG-16.2 is dispensable for autophagosome formation but required for exophergenesis.
a, Schematic of ATG-16.2 rescue constructs. Full-length ATG-16.2 protein includes ATG5-interacting motif, coiled-coil domain (CC) and WD40 domain. ATG-16.2ΔWD40 is a truncated ATG-16.2 protein containing amino acids 1–234. ATG-16.2(Phe394Ala, Ile509Met) protein contains a point mutation of phenylalanine to alanine in position 349 and in isoleucine to methionine in position 509 in the WD40 domain. See Extended Data Fig. 6a for the primary structure of ATG-16.2. b, AlphaFold model of ATG-16.2 (UniProt Q09406). The N-terminal region of ATG-16.2 is predicted to contain a helical structure with a conserved ATG5-interacting motif and a CC domain. The C terminus contains a seven-bladed WD40 beta-propeller domain. Phe394 (F) is located on blade 4 on the linker between β-sheets B-C, and Ile509 (I) is located on the linker between blade 6–7 before β-sheet A (enlarged). The enlarged surface model reveal indicates that Phe394 is surface exposed, whereas Iso509 is not. c, Mean GFP::LGG-1/ATG8-positive punctae in day 1 WT (n = 32), atg-16.2(ok3224) (n = 33) and atg-16.2(ok3224) mutants transgenically expressing full-length atg-16.2 (n = 32), atg-16.2 lacking the WD40 domain (ΔWD40) (n = 30) or atg-16.2(Phe394Ala, Ile509Met) (F394A, I509M) (n = 31) from the neuronal rgef-1 promoter. Error bars are the s.d. over three independent experiments, ****P < 0.0001, by one-way ANOVA by Dunnett’s multiple-comparisons test. d, Mean percentage of day 2 WT (n = 258 animals), atg-16.2(ok3224) (n = 271 animals) and atg-16.2(ok3224) animals expressing full-length atg-16.2 (n = 214 animals), atg-16.2 lacking the WD40 domain (ΔWD40) (n = 275 animals) or atg-16.2(Phe394Ala, Ile509Met) (F394A, I509M (n = 212 animals) from the neuronal rgef-1 promoter with ALMR exophers. Error bars are the s.d. of n = 6 experiments, ****P < 0.0001; ***P = 0.002, NS P = 0.30, P = 0.77 by two-sided Cochran–Mantel–Haenszel test.
Fig. 7 |
Fig. 7 |. The WD40 domain of ATG-16.2 is for benefits of neuronal inhibition of early-autophagy genes.
ac, Lifespan analysis of atg-16.2(ok3224); sid-1; rgef-1p::sid-1 + rgef-1p::gfp animals after whole-life atg-7 or lgg-1/ATG8 RNAi compared to control (CTRL). atg-16.2(ok3224) mutants were rescued by expressing full-length atg-16.2 (a), atg-16.2ΔWD40 (b) or atg-16.2(Phe394Ala, Ile509Met) (c) from the pan-neuronal promotor rgef-1. Statistical significance was determined by two-sided log-rank test, NS P > 0.05, ****P < 0.0001. See Supplementary Tables 3 and 6 for details and repeats. df, Number of neuronal polyQ aggregates in day 5 atg-16.2(ok3224); sid-1; rgef-1p::sid-1 + rgef-1p::gfp; rgef-1::Q40::yfp animals after whole-life atg-7 or lgg-1/ATG8 RNAi compared to control (CTRL). atg-16.2(ok3224) mutants were rescued by expressing full-length atg-16.2 (d), atg-16.2ΔWD40 (e) or atg-16.2(Phe394Ala, Ile509Met) (f) from the pan-neuronal promotor rgef-1. In the violin plots, solid lines indicate the median and dashed lines indicate quartiles. n = 30 animals each over three independent experiments. d, ***P = 0.0001, P = 0.0005; e, NS P = 0.14, P = 0.63; f, NS P = 0.63, P = 0.07, by one-way ANOVA with Dunnett’s multiple-comparisons test. gi, Mean percentage of ALMR with exophers of day 2 atg-16.2(ok3224); sid-1; rgef-1p::sid-1 + rgef-1p::gfp; mec-4p::mCherry animals after whole-life atg-7, or lgg-1/ATG8 RNAi compared to control (CTRL). atg-16.2(ok3224) mutants expressed full-length atg-16.2 (g), atg-16.2ΔWD40 (h) or atg-16.2(Phe394Ala, Ile509Met) (i) from the pan-neuronal promotor rgef-1. Error bars are the s.d. g, atg-7 RNAi: n = 5, **P = 0.007; lgg-1//ATG8 RNAi: n = 7, **P = 0.003 (n = 304, 199 and 291 animals); h, atg-7 RNAi: n = 5, NS P = 0.49; lgg-1 RNAi: n = 6, NS P = 0.39; (n = 307, 186 and 330 animals) (i) atg-7 RNAi: n = 5, NS P = 0.43; lgg-1 RNAi: n = 6, NS P = 0.71 (n = 262, 188 and 240 animals); by two-sided Cochran–Mantel–Haenszel test.

References

    1. Hansen M, Rubinsztein DC & Walker DW Autophagy as a promoter of longevity: insights from model organisms. Nat. Rev. Mol. Cell Biol 19, 579–593 (2018). - PMC - PubMed
    1. Miller HA, Dean ES, Pletcher SD & Leiser SF Cell non-autonomous regulation of health and longevity. Elife 10.7554/eLife.62659 (2020). - DOI - PMC - PubMed
    1. Simonsen A. et al. Promoting basal levels of autophagy in the nervous system enhances longevity and oxidant resistance in adult Drosophila. Autophagy 4, 176–184 (2008). - PubMed
    1. Ulgherait M, Rana A, Rera M, Graniel J. & Walker DW AMPK modulates tissue and organismal aging in a non-cell-autonomous manner. Cell Rep. 8, 1767–1780 (2014). - PMC - PubMed
    1. Hara T. et al. Suppression of basal autophagy in neural cells causes neurodegenerative disease in mice. Nature 441, 885–889 (2006). - PubMed

Substances