. 2024 Mar;27(3):449-461.
doi: 10.1038/s41593-023-01537-8. Epub 2024 Jan 4.

Microglia enhance post-anesthesia neuronal activity by shielding inhibitory synapses

Affiliations

Microglia enhance post-anesthesia neuronal activity by shielding inhibitory synapses

Koichiro Haruwaka et al. Nat Neurosci. 2024 Mar.

Abstract

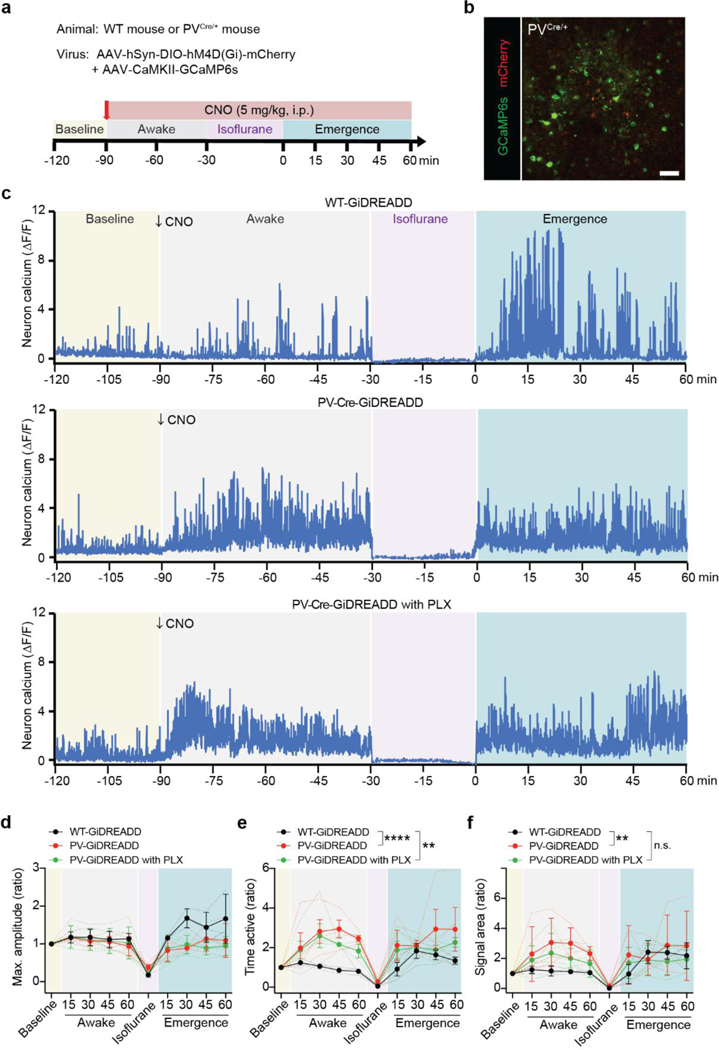
Microglia are resident immune cells of the central nervous system and play key roles in brain homeostasis. During anesthesia, microglia increase their dynamic process surveillance and interact more closely with neurons. However, the functional significance of microglial process dynamics and neuronal interaction under anesthesia is largely unknown. Using in vivo two-photon imaging in mice, we show that microglia enhance neuronal activity after the cessation of isoflurane anesthesia. Hyperactive neuron somata are contacted directly by microglial processes, which specifically colocalize with GABAergic boutons. Electron-microscopy-based synaptic reconstruction after two-photon imaging reveals that, during anesthesia, microglial processes enter into the synaptic cleft to shield GABAergic inputs. Microglial ablation or loss of microglial β2-adrenergic receptors prevents post-anesthesia neuronal hyperactivity. Our study demonstrates a previously unappreciated function of microglial process dynamics, which enable microglia to transiently boost post-anesthesia neuronal activity by physically shielding inhibitory inputs.


Conflict of interest statement

Competing interests

The authors declare no competing interests.

Figures

Extended Data Fig. 1:
Extended Data Fig. 1:. Increased neuronal calcium activity and microglial territory changes during emergence from anesthesia in both male and female mice.
a–c, Neuronal Ca2+ signal amplitude (a), time active (b) and signal area (c) across experimental time points for male mice and female mice (amplitude: Awake versus Isoflurane, p = 0.7343; Awake versus Emergence 15 min, p = 0.1393; Awake versus Emergence 30 min, p > 0.9999; Awake versus Emergence 45 min, p > 0.9999; Awake versus Emergence 60 min, p = 0.9486. time active: Awake versus Isoflurane, p = 0.9915; Awake versus Emergence 15 min, p = 0.9187; Awake versus Emergence 30 min, p = 0.9988; Awake versus Emergence 45 min, p = 0.9432; Awake versus Emergence 60 min, p = 0.4240. signal area: Awake versus Isoflurane, p > 0.9999; Awake versus Emergence 15 min, p > 0.9999; Awake versus Emergence 30 min, p = 0.9563; Awake versus Emergence 45 min, p = 0.4973; Awake versus Emergence 60 min, p = 0.1640). Solid lines represent the mean ± SEM from n = 5 mice, while dashed lines indicate individual animals. d, Representative images of microglial morphology in female mouse during each experimental phase (Scale bar: 10 μm). e, Time-course changes in microglial territory (territory: Awake versus Isoflurane 15 min, p > 0.9999; Awake versus Isoflurane 30 min, p = 0.4066; Awake versus Emergence 15 min, p = 0.9920; Awake versus Emergence 30 min, p = 0.5578; Awake versus Emergence 45 min, p > 0.9999; Awake versus Emergence 60 min, p > 0.9999). Solid lines represent the mean ± SEM from male: n = 6 mice, female: n = 5 mice). Two-way ANOVA followed by Sidak post-hoc test; n.s., not significant. All experiments were repeated multiple times using different mice independently with similar results obtained.
Extended Data Fig. 2:
Extended Data Fig. 2:. Control chow and PLX chow feeding in neuronal activity during emergence from anesthesia.
a, Experimental timeline of control chow feeding and two-photon imaging of neuronal Ca2+ activity. Related to main Fig. 2. b–d, Neuronal Ca2+ signal amplitude (b), time active (c) and signal area (d) across experimental time points for control chow 3-weeks group and 6-weeks group(amplitude: Awake versus Isoflurane, p = 0.9676; Awake versus Emergence 15 min, p = 0.8172; Awake versus Emergence 30min, p = 0.9713; Awake versus Emergence 45 min, p = 0.9911; Awake versus Emergence 60min, p = 0.9530. time active: Awake versus Isoflurane, p > 0.9999; Awake versus Emergence 15min, p = 0.9733; Awake versus Emergence 30 min, p = 0.9897; Awake versus Emergence 45min, p = 0.9697; Awake versus Emergence 60min, p = 0.9995. signal area: Awake versus Isoflurane, p > 0.9999; Awake versus Emergence 15min, p > 0.9999; Awake versus Emergence 30min, p = 0.9754; Awake versus Emergence 45min, p = 0.9992; Awake versus Emergence 60min, p > 0.9999). Solid lines represent the mean ± SEM from n = 4 mice. e–g, Neuronal Ca2+ signal amplitude (e), time active (f) and signal area (g) across experimental time points for before and after microglia ablation at each time point (amplitude: Awake versus Isoflurane, p = 0.9959; Awake versus Emergence 15min, p < 0.0001; Awake versus Emergence 30min, p < 0.0001; Awake versus Emergence 45min, p < 0.0001; Awake versus Emergence 60min, p = 0.0413. time active: Awake versus Isoflurane, p > 0.9999; Awake versus Emergence 15min, p = 0.0069; Awake versus Emergence 30min, p = 0.0009; Awake versus Emergence 45min, p = 0.0601; Awake versus Emergence 60min, p = 0.8613. signal area: Awake versus Isoflurane, p > 0.9999; Awake versus Emergence 15min, p = 0.1259; Awake versus Emergence 30min, p = 0.0013; Awake versus Emergence 45min, p = 0.0239; Awake versus Emergence 60min, p = 0.0657). Solid lines represent the mean ± SEM from n = 10 mice. h–j, Absolute value of neuronal Ca2+ signal amplitude (h), time active (i) and signal area (j) (amplitude: Awake versus Isoflurane, p = 0.9998; Awake versus Emergence 15min, p = 0.7250; Awake versus Emergence 30min, p = 0.7176; Awake versus Emergence 45min, p = 0.9757; Awake versus Emergence 60min, p > 0.9999. time active: Awake versus Isoflurane, p > 0.9999; Awake versus Emergence 15min, p = 0.4355; Awake versus Emergence 30min, p = 0.5141; Awake versus Emergence 45min, p > 0.9999; Awake versus Emergence 60min, p = 0.8270. signal area: Awake versus Isoflurane, p > 0.9999; Awake versus Emergence 15min, p = 0.9626; Awake versus Emergence 30min, p = 0.8873; Awake versus Emergence 45min, p > 0.9999; Awake versus Emergence 60min, p = 0.9442). Solid lines represent the mean ± SEM from n = 10 mice. Two-way ANOVA followed by Sidak post-hoc test (b–j); n.s., not significant; *p < 0.05, **p < 0.01, ***p < 0.001 and ****p < 0.0001.
Extended Data Fig. 3:
Extended Data Fig. 3:. Increased contacts between microglia and neuronal somata or dendrites in response to general anesthesia.
a, Two-photon imaging of microglia (Cx3cr1GFP/+, green) and neurons co-labelled with GCaMP6s (green) and tdTomato (red). Representative time series images of interaction between microglial bulbous endings (green) and neuronal soma (red) during anesthesia. White arrowheads indicate contact sites. Scale bar: 10 μm. b, Graph shows that number of microglia-neuronal soma contact sites before (Awake), during (Isoflurane) and after anesthesia (Emergence) was significantly increased during anesthesia (Awake versus Isoflurane, p = 0.0030; Awake versus Emergence, p = 0.0199; Isoflurane versus Recovery, p = 0.0640). Solid lines represent the mean ± SEM from n = 5 imaging field from 5 mice. c, Duration of microglial interaction (Awake versus Isoflurane, p = 0.0020; Awake versus Emergence, p = 0.0079; Isoflurane versus Recovery, p = 0.7197). n = 5 imaging field from 5 mice. d, Representative time series images of interaction between microglial bulbous endings (green) and neuronal dendrites (red) before, during, and after anesthesia. Microglia-neuronal dendrite interaction was increased during anesthesia (indicated by white arrowheads). Scale bar: 5 μm. e, Graph shows number of microglia-neuronal dendrite contact sites per 100 μm length of dendrite (Awake versus Isoflurane, p = 0.0016; Awake versus Emergence, p = 0.9572; Isoflurane versus Recovery, p = 0.0041). Solid lines represent the mean ± SEM from n = 6 imaging fields from 3 mice. f, Graph shows duration of observed microglia-dendrite interactions before, during, and after anesthesia (Awake versus Isoflurane, p = 0.2029; Awake versus Emergence, p = 0.0174; Isoflurane versus Recovery, p = 0.3960). n= 6 imaging fields from 3 mice. g, Representative velocity changes in microglial bulbous ending in contact with neurons. h-i, Time-course of velocity changes in microglial bulbous endings (h) and normal processes (i, excluding bulbous endings) during awake, anesthesia, and emergence (bulbous endings: Awake versus Isoflurane, p = 0.8423, Awake versus Emergence 15min, p = 0.7476; Awake versus Emergence 30min, p = 0.5805; Awake versus Emergence 45min, p = 0.1302; Awake versus Emergence 60min, p = 0.0237. normal processes: Awake versus Isoflurane, p = 0.0447; Awake versus Emergence 15min, p = 0.9919; Awake versus Emergence 30min, p = 0.8353; Awake versus Emergence 45min, p = 0.5313; Awake versus Emergence 60min, p = 0.2188).. Dashed lines indicate data from an individual animal while solid lines, columns and error bars show the mean ± SEM from n = 4 mice. One-way ANOVA followed by Tukey (b,c,e,f) and Sidak (h,i) post-hoc test; n.s., not significant; *p < 0.05 and **p < 0.01.
Extended Data Fig. 4:
Extended Data Fig. 4:. Increased colocalizations between microglial bulbous endings with VGAT puncta during anesthesia and emergence.
a, Schematic diagrams for colocalization analysis of microglial bulbous ending (IBA1, green) and a synapse marker (red, VGAT or VGLUT1) in confocal microscopy images. b, Representative images of microglia (IBA1, green) and GABAergic inhibitory synapses (VGAT, red) before, during, and after anesthesia. c, Quantification of IBA1+ and VGAT+ colocalized area (μm) in imaging fields at each time point (Awake versus Isoflurane, p < 0.0001; Awake versus Emergence, p = 0.0121; Isoflurane versus Recovery, p < 0.0001). n = 80 (Awake), n = 215 (Isoflurane), n = 124 (Emergence) bulbous endings. d, Representative images of microglia (IBA1, green) and glutamatergic excitatory synapses (VGLUT1, red) before, during, and after anesthesia. e, Graph shows IBA1+ and VGLUT1+ colocalized area (μm2) in imaging fields at each time point(Awake versus Isoflurane, p = 0.9419; Awake versus Emergence, p = 0.0002; Isoflurane versus Recovery, p < 0.0001). n = 37 (Awake), n = 58 (Isoflurane), n = 80 (Emergence) bulbous endings. f, Representative images of microglia (Cx3cr1-GFP, green) and GABAergic inhibitory synapses (VGAT, red) before, during, and after anesthesia. g, Quantification of GFP+ and VGAT+ colocalized area (μm2) in imaging fields at each time point (Awake versus Isoflurane, p < 0.0001; Awake versus Emergence, p < 0.0001; Isoflurane versus Recovery, p < 0.3009). n = 44 (Awake), n = 95 (Isoflurane), n = 96 (Emergence) bulbous endings. h, Quantification of microglial bulbous endings contacting NeuN across experimental phases (Awake versus Isoflurane, p = 0.0013; Awake versus Emergence, p = 0.0202; Isoflurane versus Recovery, p = 0.2473). Awake, Isoflurane: n = 5, Emergence: n = 6 mice. i, Confocal imaging of representative soma-soma interaction between GCaMP+ neurons (blue) and microglia (green). PV+ boutons (red) were also shown. Diagram illustrates the observed phenomenon (right). j, Graph shows percentage of soma-soma interaction between microglia and neurons for all neuronal populations in the imaging field before, during, and after anesthesia (Awake versus Isoflurane, p = 0.8384; Awake versus Emergence, p = 0.9262; Isoflurane versus Recovery, p = 0.9791). n = 5 mice. Each point indicates data from an individual bulbous ending interaction (c,e,g) or mouse (h,j) while bars and error bars indicate the mean ± SEM. One-way ANOVA followed by Tukey post-hoc test; n.s., not significant; *p < 0.05, **p < 0.01, ***p < 0.001 and ****p < 0.0001. Scale bar: 20 μm or 2 μm (inset) (b,d,f), 5 μm (i).
Extended Data Fig. 5:
Extended Data Fig. 5:. Three-dimensional analysis of inhibitory synapses with microglial processes.
a, Representative 3D-image of co-immunostaining with VGAT (red) and gephyrin (cyan). Scale bar: 20 μm. b, Typical images of VGAT (red), gephyrin (cyan) and IBA1 microglial processes (green) before, during, and after anesthesia. Arrowheads: shielded VGAT+ synapse by microglia. Scale bar: 5 μm. c, Diagram showing the criteria for gephyrin+ VGAT+ synapse; double-positive was defined as when they were within 2 μm of each other in 3D images. d, Graph shows IBA1+ microglial process colocalized gephyrin+ VGAT+ synapses (%) at each time point (awake, isoflurane and emergence 30 min. Awake versus Isoflurane, p = 0.1117; Awake versus Emergence, p = 0.0038; Isoflurane versus Recovery, p = 0.6483). n = 49 (Awake), n = 35 (Isoflurane), n = 57 (Emergence) neurons from 5 mice. e, Representative immunofluorescent image of Kv2.1 (cyan), IBA1 microglial processes (yellow), NeuN nuclei (white), and VGAT puncta (magenta) in cortical tissue. Scale bar: 2 μm. f, Orthogonal view image shows bulbous ending co-localizing with VGAT close to Kv2.1 (same region with e). Scale bar: 2 μm. g, Graph shows quantification of Kv2.1+ cluster distribution. Kv2.1 signal is significantly higher within the contact site than non-contact site (Awake:non-contact versus Awake:contact, p = 0.0007; Isoflurane:non-contact versus Isoflurane:contact, p < 0.0001; Emergence:non-contact versus Emergence:contact, p = 0.1337). n = 5 mice. h, Graph shows quantification of Kv2.1+ VGAT+ cluster distribution. Colocalization is significantly higher within the contact site during anesthesia and emergence (Awake:non-contact versus Awake:contact, p = 0.9969; Isoflurane:non-contact versus Isoflurane:contact, p < 0.0001; Emergence:non-contact versus Emergence:contact, p = 0.0047). In all graphs, each point indicates data from an individual neuron while columns with error bars indicate the mean ± SEM. One-way ANOVA (d), two-way ANOVA (g,h) followed by Tukey post-hoc test; n.s., not significant; *p < 0.05, **p < 0.01, ***p < 0.001 and ****p < 0.0001.
Extended Data Fig. 6:
Extended Data Fig. 6:. GABAB receptor is enriched in the microglial bulbous endings during anesthesia.
a, Representative images of co-immunostaining with IBA1 (green) and GABAB1 receptor (GABAB1R, magenta) during anesthesia (30 min). Merged images of only co-localized GABAB1R are shown in the lower panel. Arrowheads: GABAB1R colocalized bulbous endings. Scale bar: 10 μm. b, Graph shows the percentage of GABAB1R+ microglia in somatosensory cortex and hippocampus. N = 5 mice. c, Representative orthogonal view image of GABAB1R+ microglial bulbous ending. Scale bar: 2 μm. d, Graph shows distribution of GABAB1R calculated by colocalized fluorescent signal; n = 23 (Soma), n = 28 (Process), n = 47 (Bulbous ending) from 4 mice at t=30 min after the start of anesthesia (Soma versus Process, p = 0.0007; Soma versus Bulbous ending, p < 0.0001; Process versus Bulbous ending, p = 0.0015 e, Representative images of co-localized GABAB1R at each time point. Arrowheads: co-localized GABAB1R signal. Scale bar: 10 μm. f, Graph shows co-localized GABAB1R signal with bulbous endings at each time point [awake, isoflurane (at t=30 min after the start of anesthesia), and emergence (at t=30 min after termination of anesthesia)]. Awake versus Isoflurane, p = 0.0129; Awake versus Emergence, p = 0.8327; Isoflurane versus Recovery, p = 0.0008; n = 34 (Awake), n = 39 (Isoflurane), n = 48 (Emergence) from 4 mice. g, Graph shows co-localized GABAB1R signal with microglial soma at each time point (Awake versus Isoflurane, p = 0.0005; Awake versus Emergence, p = 0.4749; Isoflurane versus Recovery, p = 0.0102); n = 23 (Awake), n = 24 (Isoflurane), n = 29 (Emergence) from 4 mice. Each point indicates data from an individual mouse (b) or region of interest (ROI) (d,f,g), while bars and error bars indicate the mean ± SEM. One-way ANOVA followed by Tukey post-hoc test; *p < 0.05, **p < 0.01, ***p < 0.001 and ****p < 0.0001.
Extended Data Fig. 7:
Extended Data Fig. 7:. Near-infrared branding to correlate two-photon images with electron microscopy and study microglia-neuron interaction.
a, Timeline of experimental procedures necessary to capture an EM volume from the site of two-photon live imaging. Following in vivo two-photon imaging, brain tissue was fixed. We then re-identified the same region of imaging in fixed tissue under the two-photon microscope and performed near-infrared branding to create defined fiducial marks. This region was further cut down and processed for EM imaging, including tissue embedding and dehydration. Serial block-face scanning electron microscopy (SBF-SEM) was performed on sequential sections using the fiducial marks from laser branding to ensure proper tissue orientation. The image was reconstructed for microglial bulbous ending interactions with PV boutons and neuronal somata at the ultrastructural level. For details, please see the methods section. b, Two-photon in vivo imaging of microglia-PV bouton interactions adjacent to a neuronal soma, which was followed by electron microscopy reconstruction. The boxed area was then observed by electron microscopy. Arrowhead: interaction site. Dashed line: region of interest (ROI) for Ca2+ activity analysis. c, Neuronal Ca2+ activity (ΔF/F) before anesthesia (baseline) and during emergence. d, 3-D serial reconstruction of a microglial process, PV bouton with vesicles, neuronal soma at the ultrastructural level using SEM. White dashed line: representative slice shown in (e). e, Electron microscopic image showing that a microglial process shields a PV bouton.
Extended Data Fig. 8:
Extended Data Fig. 8:. Chemogenetic inhibition of PV neurons masked emergence-induced neuronal hyperactivity.
a, Experimental timeline of CNO treatment and two-photon imaging of neuronal Ca2+ activity. WT, PV-GiDREADD+ mice or PLX treated PV-GiDREADD+ mice were infected with AAV9.CaMKII.GCaMP6s and AAV2-hSyn-DIO-hM4D(Gi)-mCherry. b, Representative image of PVCre/+ mice expressing Gi-DREADD (on PV neurons, mCherry) and GCaMP6 (on excitatory neurons). Scale bar: 50 μm. c, Representative traces of neuronal Ca2+ activity (ΔF/F) with chemogenetic inhibition of PV neurons by CNO before, during and after anesthesia in 3 groups: WT-GiDREADD+ mice, PV-GiDREADD+ mice or PLX treated PV-GiDREADD+ mice. d–f, Neuronal Ca2+ signal amplitude (d), time active (e) and signal area (f) across experimental time points for WT-GiDREADD+ mice (n = 3 mice), PV-GiDREADD+ mice (n = 4 mice) or PLX treated PV-GiDREADD+ mice (n = 5 mice). p = 0.0024 (WT-GiDREADD+ mice versus PV-GiDREADD+ mice), p = 0.0003 (WT-GiDREADD+ mice versus PV-GiDREADD+ mice with PLX), F(2, 90) = 9.024 (d). p < 0.0001 (WT-GiDREADD+ mice versus PV-GiDREADD+ mice), p = 0.0032 (WT-GiDREADD+ mice versus PV-GiDREADD+ mice with PLX), F(2, 90) = 12.62 (e). p = 0.0044 (WT-GiDREADD+ mice versus PV-GiDREADD+ mice), p = 0.4894 (WT-GiDREADD+ mice versus PV-GiDREADD+ mice with PLX), F(2, 90) = 5.835 (f). Each dashed line indicates data from an individual mouse, while solid lines and error bars show the mean ± SEM. Two-way ANOVA followed by Tukey post-hoc test; n.s., not significant; **p < 0.01 and ****p < 0.0001.
Extended Data Fig. 9:
Extended Data Fig. 9:. Effect of β2-adrenergic receptor agonist on microglial process dynamics and neuronal activity after anesthesia.
a, Experimental timeline of agonist administration and two-photon imaging. Formoterol was injected intraperitoneally (50 μg/kg) 30 minutes before two-photon imaging. b, Representative images of microglial morphology during each experimental phase (Scale bar: 10 μm). c, Time-course of changes in microglial surveillance territory (Vehicle: n = 6 mice, Formoterol: n = 5 mice). p = 0.0012 (Emergence 15 min, Adrb2 WT versus Adrb2 cKO), p < 0.0001 (Emergence 30 min), p = 0.0240 (Emergence 45 min), p = 0.3669 (Emergence 60 min), F(1, 63) = 46.76. d–f, Neuronal Ca2+ signal amplitude (d), time active (e) and signal area (f) across experimental time points for vehicle or formoterol treated mice (n = 7 mice for both groups). p = 0.0012 (Emergence 15 min, Adrb2 WT versus Adrb2 cKO), p < 0.0001 (Emergence 30 min), p = 0.0240 (Emergence 45 min), p = 0.3669 (Emergence 60 min), F(1, 72) = 37.52 (d). p = 0.0172 (Emergence 15 min, Adrb2 WT versus Adrb2 cKO), p = 0.0003 (Emergence 30 min), p = 0.1799 (Emergence 45 min), p = 0.9582 (Emergence 60 min), F(1, 72) = 14.38 (e). p = 0.0055 (Emergence 15 min, Adrb2 WT versus Adrb2 cKO), p < 0.0001 (Emergence 30 min), p = 0.0377 (Emergence 45 min), p = 0.9978 (Emergence 60 min), F(1, 72) = 22.52 (f). Dashed lines indicate data from an individual mouse. Solid lines represent the mean ± SEM. Two-way ANOVA followed by Tukey post-hoc test; n.s., not significant; *p < 0.05, **p < 0.01, ***p < 0.001 and ****p < 0.0001.
Extended Data Fig. 10:
Extended Data Fig. 10:. β2-adrenergic receptors in microglial process dynamics and neuronal activity.
a, A representative image of microglia with dynamic processes (left). The illustration describes the calculation of microglial process moving outward in its trajectory. Microglial process directness was calculated as the Euclidean distance of the process tips divided by its accumulated distance. b, Graph shows increasing process trajectory directness during anesthesia in Adrb2 WT mice but not in Adrb2 cKO mice. Each dashed line indicates data from individual microglia: n = 12 WT microglia and n = 10 cKO microglia from 5 mice. p = 0.0213, F(1, 40) = 4.442 (Adrb2 WT, Awake versus Isoflurane), p = 0.8694 (Adrb2 cKO, Awake versus Isoflurane), p < 0.0001, F(1, 40) = 31.70 (Awake, Adrb2 WT versus Adrb2 cKO), p = 0.0329 (Isoflurane, Adrb2 WT versus Adrb2 cKO). c, Diagrams of EEG electrode implantation and the study timeline. d, Power in the alpha, beta, theta, and delta frequency bands is expressed as a ratio of power in the emergence phase relative to the awake phase before and after recombination for Adrb2 cKO (n = 5 mice). p = 0.0031, t(8) = 4.167 (Alpha), p = 0.0131, t(8) =3.172 (Beta), p = 0.0189, t(8) =2.935 (Theta), p = 0.1121, t(8)=1.785 (Delta). e, Area of co-labelling between IBA1 microglia and VGAT puncta across experimental phases and between genotypes. Each point indicates data from an individual animal while columns with error bars indicate the mean ± SEM (n = 5 mice). p = 0.0010 (Awake, Adrb2 WT versus Adrb2 cKO), p = 0.0027 (Isoflurane, Adrb2 WT versus Adrb2 cKO), p = 0.4360 (Emergence, Adrb2 WT versus Adrb2 cKO), F(1, 24) = 0.3449. Related to Fig 7g. Two-way ANOVA followed by Sidak post-hoc test (b,e), paired t-test (d); n.s., not significant; *p < 0.05, **p < 0.01 and ****p < 0.0001.
Fig. 1:
Fig. 1:. Neuronal hyperactivity occurs during emergence from general anesthesia.
a, Outline of in vivo two-photon calcium imaging with simultaneous mouse locomotion tracking. b, Schematic diagram of the experimental timeline. c, Representative images of neuronal calcium activity from the somatosensory cortex before, during, and after anesthesia (Scale bar: 20 μm). d, Classification of neuronal calcium activity and representative ΔF/F calcium traces. Neurons with increased activity during emergence compared to awake baseline are shown in red, while those with no change are shown in green, and those with decreased activity are shown in blue. Background color in calcium traces shows awake (gray), isoflurane (pink), and emergence (blue) periods. e, Percentage of neurons displaying these activity changes in emergence compared to awake baseline. Exact criteria and methodology are provided in the methods (n = 4 mice). f–h, Maximum amplitude (ΔF/F, f), active time (time of ΔF/F>0.5, g), and signal area (ΔF/F·s, h) for neuronal calcium traces at each time point. p = 0.0005 (Awake versus Emergence 15 min), p = 0.0053 (30 min), p = 0.0387 (45 min), p = 0.2013 (60 min), F(4, 20) = 11.64 (f). p = 0.0371 (Awake versus Emergence 15 min), p = 0.0002 (30 min), p = 0.0069 (45 min), p = 0.0371 (60 min), F(4, 20) = 4.748 (g). p = 0.0441 (Awake versus Emergence 15 min), p = 0.0012 (30 min), p = 0.0441 (45 min), p = 0.0441 (60 min), F(5, 24) = 16.10 (h). Solid line represents the mean ± SEM, while dashed lines indicate an individual animal (n = 5 mice). i, Threshold for paw withdrawal in the von Frey filament test (n = 10 mice). p < 0.0001 (Awake versus Emergence 30 min), p = 0.0007 (60 min) F(2, 27) = 1.236. j, Representative locomotor movement of mice using a magnetic-based tracking platform. Mouse movement is displayed in blue, while all other colors distinguish platform zones. k, Changes in neuronal calcium activity (mean ± SEM of ΔF/F signal area, green) and mouse locomotion activity (activity index, gray) throughout experimental phases (n = 4 mice). l, Representative images of microglial morphology and surveillance territory during each experimental phase (Scale bar: 10 μm). m, Time-course changes in microglial territory (gray) overlaid with corresponding changes in neuronal calcium activity (ΔF/F, green). Territory area throughout the experiment was normalized to the awake baseline start. n, Time-course changes in microglial territory (n = 6 mice). p = 0.0378 (Awake versus Isoflurane 15 min), p < 0.0001 (Isoflurane 30 min), p < 0.0001 (Emergence 15 min), p < 0.0001 (Emergence 30 min), p < 0.0001 (Emergence 45 min), p = 0.0249 (Emergence 60 min), F(6, 35) = 1.486. In all graphs, each point or dashed line indicates data from an individual animal, while bars or solid lines with error bars indicate the mean ± SEM. One-way ANOVA followed by Holm-Sidak (f,g,h,n), Tukey (i) post-hoc test; n.s., not significant; *p < 0.05, **p < 0.01, ***p < 0.001 and ****p < 0.0001. Experiments were repeated four times (ae), five times (f–h), six times (n), and ten times (i) independently with similar results obtained.
Fig. 2:
Fig. 2:. Microglial depletion abolishes the increase of neuronal activity during emergence
a, Experimental timeline of microglia ablation and two-photon imaging of neuronal Ca2+ activity before and after general anesthesia. b, IBA1 immunostaining of microglial density in mice fed with a control chow (Control, left panel) and a PLX3397-containing chow (PLX, middle panel) in the cortex (blue for DAPI and red for IBA1). Graph shows significantly decreased IBA1+ cells in PLX-treated mice (right) (n = 6 control mice, n = 7 PLX-treated mice, two-sided unpaired t-test, p < 0.0001, t(11) = 21.42). Scale bar: 50 μm. c, Representative images of neuronal Ca2+ activity across experimental phases (Awake, Isoflurane and Emergence 30 min) in mice before (left panels) and after microglia ablation (right panels). Scale bar: 50 μm. d, Graph shows maximum amplitude (ratio) of neuronal Ca2+ active time before and after ablation (n = 10 mice each group, p < 0.0001 (Before ablation versus After ablation, t(54) = 7.528). e, Graph shows time active (ratio) of neuronal Ca2+ activity before and after ablation. p < 0.0001 (Before ablation versus After ablation, t(54) = 5.986). f, Graph shows ΔF/F signal area (ratio) of neuronal Ca2+ activity before and after ablation. p < 0.0001 (Before ablation versus After ablation, t(54) = 5.271). g, Graph shows reduced mechanical hypersensitivity during the emergence from anesthesia (30 min) in microglia ablated mice (n = 10 before ablation, n = 9 after ablation mice, Before ablation versus After ablation, p = 0.0017 (Awake), p < 0.0001 (Emergence 30 min), p < 0.0001 (Emergence 60 min), F(2, 51) = 118.1. In all graphs, each point or dashed lines indicates data from an individual animal, while columns or solid lines and error bars show the mean ± SEM. Two-way ANOVA followed by Sidak (d,e,f) and Tukey (g) post-hoc test; *p < 0.05, **p < 0.01, ***p < 0.001 and ****p < 0.0001. All experiments were repeated multiple times using different mice independently with similar results obtained.
Fig. 3:
Fig. 3:. Increased microglial process contacts correlate with neuronal hyperactivity during emergence.
a, Representative images of microglia (green) and CaMKII neuron (red) interactions in the awake baseline, anesthesia, and anesthesia recovery periods. White arrowheads indicate contact sites (Scale bar: 5 μm). b, Percentage of CaMKII neurons with soma contact from microglial processes in the awake, isoflurane, and emergence phases (n = 4 mice). p = 0.0016 (High contact, Awake versus Isoflurane, t(18) = 4.929), p = 0.9954 (High contact, Isoflurane versus Emergence, t(18) = 1.065). c,d, Overlay of GCaMP6s neuronal calcium activity (ΔF/F, green) and the number of microglial process contacts (red) with neuronal somata across anesthesia phases, separated by neurons with higher microglial contact (c) and lower microglial contact (d). Each trend line represents the mean ± SEM. e, Neuronal calcium signal area in the 30-minute emergence phase for somata with low or high microglial contact during anesthesia (Left: p = 0.0210, Low contact versus High contact, t(34) = 2.420). The ratio of neuronal activity (signal area) in the awake baseline compared to emergence from anesthesia (Right: p = 0.0043, Low contact versus High contact, t(29) = 3.098). Dataset includes 13 neurons with low contact and 23 neurons with high contact from 8 mice. f, Representative images of microglial processes and bulbous tip endings (white square) at the beginning (green) and end (purple) of each study phase: awake baseline, anesthesia, and emergence. Inset: Criteria for a bulbous tip ending on a microglial process (scale bar: 10 μm for main panels; 1 μm for inset). g, Number of bulbous tip processes present on microglia across experimental phases. Dashed lines indicate data from an individual animal, while solid line and error bars show the mean ± SEM (n = 11 microglia from 5 mice). p < 0.0001 (Awake versus Isoflurane), p < 0.0001 (Awake versus Emergence 30 min), p = 0.0035 (Awake versus Emergence 60 min), F(3, 40) = 1.930. h, Representative immunofluorescent images of IBA1 microglia and NeuN neurons in fixed tissue prepared from mice across experimental phases. Inset shows microglial bulbous tip endings contacting NeuN somata. Scale bar: 20 μm in main panels, 2 μm in inset. i, Quantification of microglial bulbous tip endings contacting NeuN per microglia across experimental phases (n = 6 mice). p < 0.0001 (Awake versus Isoflurane), p = 0.0060 (Awake versus Emergence), p = 0.0043 (Isoflurane versus Emergence), F(2, 15) = 0.4003. Each point indicates data from an individual neuron (e) or animal (b,i), columns with error bars indicate the mean ± SEM. Two-way ANOVA followed by Sidak post-hoc test (b), one-way ANOVA followed by Tukey post-hoc test (g,i), unpaired t-test (e); n.s., not significant; *p < 0.05, **p < 0.01, ***p < 0.001 and ****p < 0.0001. All experiments were repeated multiple times using different mice independently with similar results obtained.
Fig. 4:
Fig. 4:. Microglial processes interact with GABAergic boutons.
a, Representative immunofluorescent image of DAPI nuclei (blue), IBA1 microglial processes (green), NeuN nuclei (white), and VGAT puncta (red) in cortical tissue prepared 30 min after anesthetic emergence. White arrows in main panel and orthogonal panels indicate sites of microglial bulbous tip contact with VGAT terminals (Scale bar: 2 μm). b, Percentage of IBA1 processes co-localizing with VGAT puncta across experimental phases (n = 5 mice). p < 0.0001 (Awake versus Isoflurane), p = 0.0004 (Awake versus Emergence 30 min), p = 0.0043 (Awake versus Emergence 24 h), F(3, 16) = 18.16. c, Percentage of neurons with high contact (contacts more than 1) or low contact (0–1 contact) by microglial processes across experimental phases. d, Number of VGAT puncta per unit area across experimental phases (n = 5 mice). p = 0.6669 (Awake versus Isoflurane), p = 0.6669 (Awake versus Emergence 30 min), p = 0.8030 (Awake versus Emergence 24 h), F(3, 16) = 0.5970. e, Representative thresholded images or 3D space-filling models of microglia-VGAT interactions, including “No contact,” “partial contact,” “enwrapping,” or “full engulfment” (Scale bar: 2 μm). f, Percentage of microglial bulbous tip endings engaging in different types of VGAT interactions across experimental phases (n = 5 mice). p < 0.0001 (No contact, Awake versus Isoflurane), p = 0.0026 (No contact, Awake versus Emergence), p = 0.0073 (Enwrapped, Awake versus Isoflurane), F(3, 60) = 48.60. g, Representative super-resolution image of neurons (blue), IBA1 microglia (green), and PV boutons (red) (Scale bar: 10 μm in main panels, 1 μm in inset). h, Examples of microglial bulbous tip interactions with PV boutons across experimental phases (Scale bar: 5 μm). i, Kymograph displays microglial process contact time with CaMKII neuronal somata across experimental phases. j, Distribution of contact time across the whole experiment (n = 26 neurons from 5 mice). Dots represent individual mice (c,d,f) or individual neurons (j). Columns and error bars represent the mean ± SEM. One-way (b,d), or two-way (f) ANOVA followed by Tukey post-hoc test. *p < 0.05, **p < 0.01, ***p < 0.001 and ****p < 0.0001. For a, gh, experiments were repeated five times independently with similar results obtained.
Fig. 5:
Fig. 5:. In vivo two-photon imaging followed by electron microscopy reconstruction reveals shielding of PV boutons
a, Images of tdTomato-labelled PV boutons (AAV9.CAG.FLEX.tdTomato with PVCre/+), microglia (Cx3cr1GFP/+), and neurons (AAV-CaMKII-GCaMP6s) from in vivo two-photon microscopy during awake, anesthesia, and emergence (Scale bar: 10 μm). b, Percentage of neuronal somata displaying activity changes in emergence versus baseline as a function of microglial contact with PV boutons (n = 27 neurons from 7 mice. Chi-squared test: n.s., not significant; ****p < 0.0001) p = 6.6 × 10⁻¹³; (Increased, No contact versus Contact), p = 0.5453 (No change, No contact versus Contact), p = 4.4 × 10⁻¹⁵ (Decreased, No contact versus Contact). c, Two-photon in vivo imaging of microglia-PV bouton interactions adjacent to a neuronal soma, which was followed by electron microscopy reconstruction. d, 3-D serial reconstruction of a microglial process, PV bouton, and neuron at the ultrastructural level using SEM. For c–d, experiments were repeated three times independently with similar results obtained.
Fig. 6:
Fig. 6:. NE and β2-adrenergic receptors control microglial process surveillance during anesthesia and emergence.
a, Schematic of local NE sensor transfection and cranial window surgery in the somatosensory cortex. b, Representative two-photon imaging of NE biosensor fluorescence in cortex during the awake baseline, anesthesia, and emergence (Scale bar: 20 μm). c, Quantification of NE sensor fluorescence (ΔF/F) across time periods (n = 5 mice, One-way ANOVA followed by Tukey post-hoc test). p = 0.0285 (Awake versus Isoflurane), p = 0.0223 (Awake versus Emergence 30 min), p = 0.4116 (Awake versus Emergence 60 min), F(4, 12) = 2.522. d, Experimental design for comparing microglial Adrb2 cKO mice (Cx3cr1CreER/+; Adrb2fl/fl) to controls (Cx3cr1CreER/+; Adrb2wt/wt) after tamoxifen recombination. e, Quantitative analysis of Adrb2 mRNA expression levels in Adrb2 cKO and control mice (n = 3 Cx3cr1CreER/+ with tamoxifen, n = 3 Cx3cr1CreER/+; Adrb2fl/fl, n = 4 Cx3cr1CreER/+; Adrb2fl/fl with tamoxifen). p = 0.0022 (Cx3cr1CreER/+; Adrb2fl/fl versus Cx3cr1CreER/+; Adrb2fl/fl with tamoxifen), F(5, 14) = 10.56. f, Representative images of microglial processes at the beginning (green) and end (purple) of each study phase: awake baseline, anesthesia, and emergence (Scale bar: 10 μm). g, Microglial process surveillance territory changes from awake baseline in Adrb2 cKO and WT control animals across experimental phases. Each trend line represents the mean ± SEM. h, Average microglial process outgrowth/extension during the awake and anesthesia periods for Adrb2 cKO and WT controls (n = 10 WT microglia and n = 12 cKO microglia from 4 mice). p = 0.034 (Adrb2 WT, Awake versus Isoflurane), p = 0.8809 (Adrb2 cKO, Awake versus Isoflurane), F(1, 40) = 4.038. i, 50% paw withdrawal thresholds for C57BL/6 WT mice, Adrb2 WT control mice, and Adrb2 cKO mice during von Frey filament testing during awake baseline and emergence from anesthesia (n = 4 C57BL/6 WT, n = 5 Adrb2 WT, n = 5 Adrb2 cKO mice). p < 0.0001 (Emergence 30 min, C57BL/6 WT mice versus Adrb2 cKO mice) p < 0.0001 (Emergence 30 min, Adrb2 WT control mice versus Adrb2 cKO mice), F(2, 11) = 19.78. In all graphs, each point or dashed line indicates data from an individual animal (c–i), while columns or solid lines with error bars indicate the mean ± SEM. One-way ANOVA (c) and two-way ANOVA (e,i) followed by Tukey post-hoc test, Sidak post-hoc test (h); n.s., not significant; *p < 0.05, ***p < 0.001 and ****p < 0.0001. For f, experiments were repeated four times independently with similar results obtained.
Fig. 7:
Fig. 7:. Microglial β2-adrenergic receptors regulate neuronal hyperactivity during emergence.
a,Within-subject study design comparing responses in Cx3cr1CreER/+; Adrb2fl/fl mice before and after tamoxifen-induced recombination. bc, Neuronal calcium signal amplitude (b) and signal area (c) across experimental time points for mice before and after recombination for Adrb2 cKO (n = 6 mice). p = 0.0006 (Emergence 15 min, WT versus cKO), p < 0.0001 (30 min, WT versus cKO), p = 0.0047 (45 min, WT versus cKO), p = 0.1056 (60 min, WT versus cKO), F(1, 10) = 16.14 (b), p = 0.5940 (Emergence 15 min, WT versus cKO), p = 0.0012 (30 min, WT versus cKO), p = 0.1215 (45 min, WT versus cKO), p = 0.9667 (60 min, WT versus cKO), F(1, 10) = 9.060 (c). d, Percentage of neurons showing an increase, decrease, or no change in activity during emergence period compared to awake baseline. In this case, the same populations of neurons are compared before mice undergo cKO and again after tamoxifen-induced recombination (n = 6 mice). p = 0.0158 (Increased, WT versus cKO), p = 0.8777 (No change, WT versus cKO), p = 0.0335 (Decreased, WT versus cKO), F(1, 10) = 0.6680. e, Immunostaining of microglial processes, NeuN somata, and VGAT puncta in cKO mice (Scale bar: 5 μm). f, Quantification of microglial bulbous tip endings contacting NeuN across experimental phases by genotypes (n = 5 mice). p = 0.9563 (Awake, WT versus cKO), p = 0.0145 (Isoflurane, WT versus cKO), p = 0.0536 (Emergence, WT versus cKO), F(1, 24) = 8.927. g, Area of co-labelling between IBA1 microglia and VGAT puncta across experimental phases and between genotypes. Adrb2 WT: n = 40 (Awake), n = 89 (Isoflurane), n = 126 (Emergence); Adrb2 cKO: n = 43 (Awake), n = 54 (Isoflurane), n = 85 (Emergence) from 5 mice. p < 0.0001 (Awake, WT versus cKO), p < 0.0001 (Isoflurane, WT versus cKO), p = 0.0091 (Emergence, WT versus cKO), F(1, 431) = 4.464. h, Graphic summary. During anesthesia, microglia extend their processes in response to decreased NE concentration in brain parenchyma, and their bulbous endings interact with the neuronal cell body. This bulbous ending contacts inhibitory synapses and induces neuronal hyperactivity during emergence by shielding inhibitory inputs. As a result of these, mice exhibit hypersensitivity and locomotor hyperactivity at emergence. In all graphs, each point or dashed line indicates data from an individual animal (b-f), or a microglial process (g), while columns or solid lines with error bars indicate the mean ± SEM. Two-way ANOVA followed by Sidak post-hoc test; n.s., not significant; *p < 0.05, **p < 0.01, ***p < 0.001 and ****p < 0.0001. For e, the experiment was repeated five times independently with similar results obtained.

References

    1. Davalos D, et al. ATP mediates rapid microglial response to local brain injury in vivo. Nat Neurosci 8, 752–758 (2005). - PubMed
    1. Kettenmann H, Hanisch UK, Noda M. & Verkhratsky A. Physiology of microglia. Physiol Rev 91, 461–553 (2011). - PubMed
    1. Nimmerjahn A, Kirchhoff F. & Helmchen F. Resting microglial cells are highly dynamic surveillants of brain parenchyma in vivo. Science 308, 1314–1318 (2005). - PubMed
    1. Paolicelli RC, et al. Synaptic pruning by microglia is necessary for normal brain development. Science 333, 1456–1458 (2011). - PubMed
    1. Schafer DP, et al. Microglia sculpt postnatal neural circuits in an activity and complement-dependent manner. Neuron 74, 691–705 (2012). - PMC - PubMed

LinkOut - more resources