. 2024 Feb;56(2):222-233.
doi: 10.1038/s41588-023-01596-4. Epub 2024 Jan 4.

Multi-ancestry genome-wide association study of major depression aids locus discovery, fine mapping, gene prioritization and causal inference

Xiangrui Meng #  1 Georgina Navoly #  2 Olga Giannakopoulou #  1 Daniel F Levey  3   4 Dora Koller  3   4   5 Gita A Pathak  3   4 Nastassja Koen  6 Kuang Lin  7 Mark J Adams  8 Miguel E Rentería  9 Yanzhe Feng  1 J Michael Gaziano  10   11   12 Dan J Stein  6 Heather J Zar  13 Megan L Campbell  14 David A van Heel  15 Bhavi Trivedi  15 Sarah Finer  16 Andrew McQuillin  1 Nick Bass  1 V Kartik Chundru  17 Hilary C Martin  17 Qin Qin Huang  17 Maria Valkovskaya  1 Chia-Yi Chu  1 Susan Kanjira  8 Po-Hsiu Kuo  18   19 Hsi-Chung Chen  19   20 Shih-Jen Tsai  21   22 Yu-Li Liu  23 Kenneth S Kendler  24 Roseann E Peterson  24   25 Na Cai  26   27   28 Yu Fang  29 Srijan Sen  29   30 Laura J Scott  31   32 Margit Burmeister  29   30   33   34 Ruth J F Loos  35   36 Michael H Preuss  35 Ky'Era V Actkins  37 Lea K Davis  37   38   39 Monica Uddin  40 Agaz H Wani  40 Derek E Wildman  41 Allison E Aiello  42 Robert J Ursano  43 Ronald C Kessler  44 Masahiro Kanai  45   46   47 Yukinori Okada  45   48   49 Saori Sakaue  45   47   50 Jill A Rabinowitz  51 Brion S Maher  51 George Uhl  52 William Eaton  51 Carlos S Cruz-Fuentes  53 Gabriela A Martinez-Levy  53 Adrian I Campos  9   54 Iona Y Millwood  7   55 Zhengming Chen  7   55 Liming Li  56   57   58 Sylvia Wassertheil-Smoller  59 Yunxuan Jiang  60   61 Chao Tian  61 Nicholas G Martin  62 Brittany L Mitchell  62 Enda M Byrne  63 Swapnil Awasthi  64   65 Jonathan R I Coleman  66 Stephan Ripke  64   65   67 PGC-MDD Working GroupChina Kadoorie Biobank Collaborative Group23andMe Research TeamGenes and Health Research TeamBioBank Japan ProjectTamar Sofer  68   69 Robin G Walters  7   55 Andrew M McIntosh  8   70 Renato Polimanti  3   4   71 Erin C Dunn  72   73   74 Murray B Stein  75   76   77 Joel Gelernter  3   4   78 Cathryn M Lewis  66   79 Karoline Kuchenbaecker  80   81
Affiliations

Multi-ancestry genome-wide association study of major depression aids locus discovery, fine mapping, gene prioritization and causal inference

Xiangrui Meng et al. Nat Genet. 2024 Feb.

Abstract

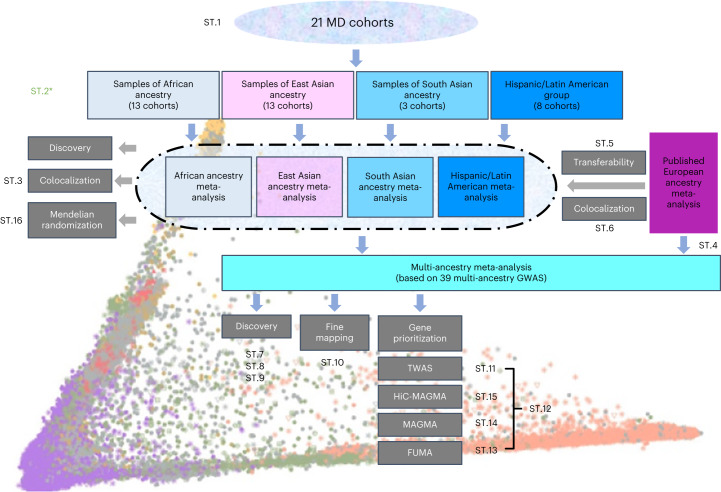
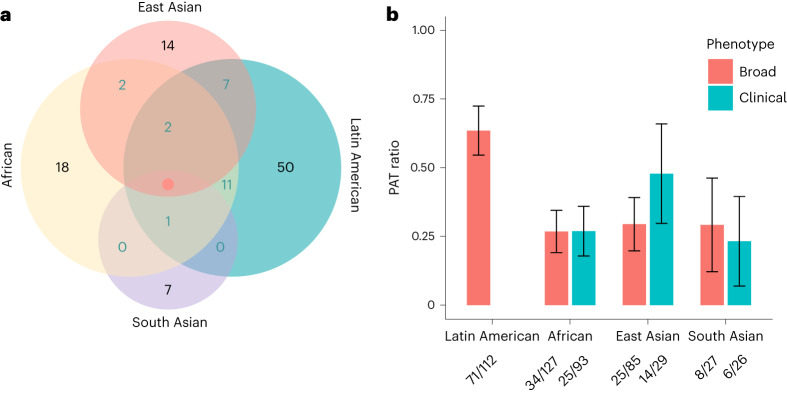
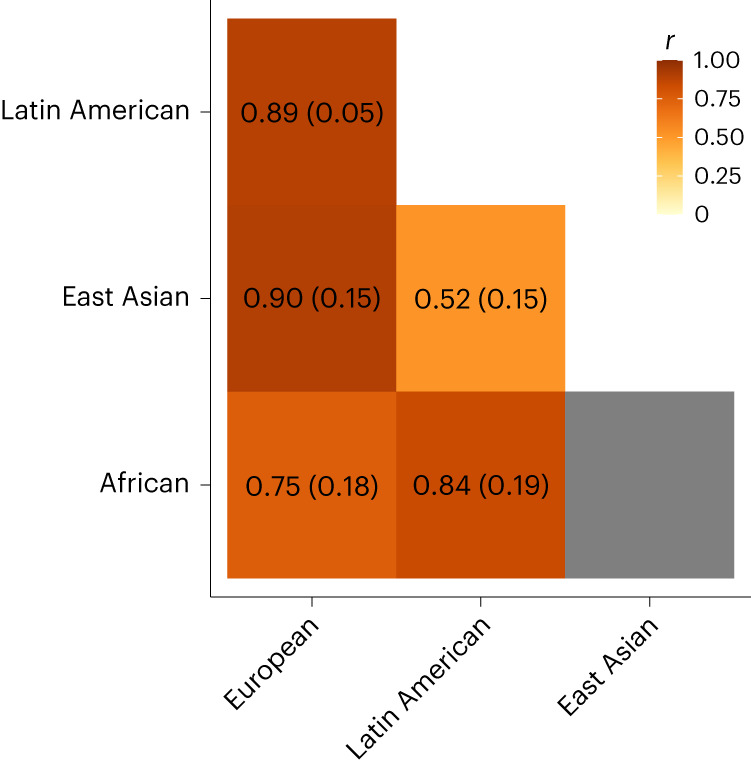
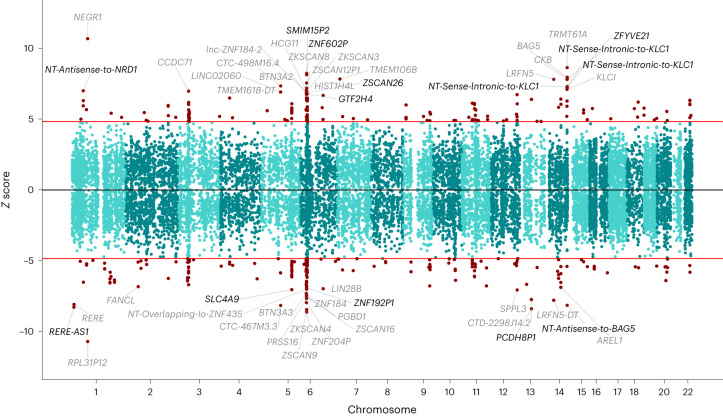
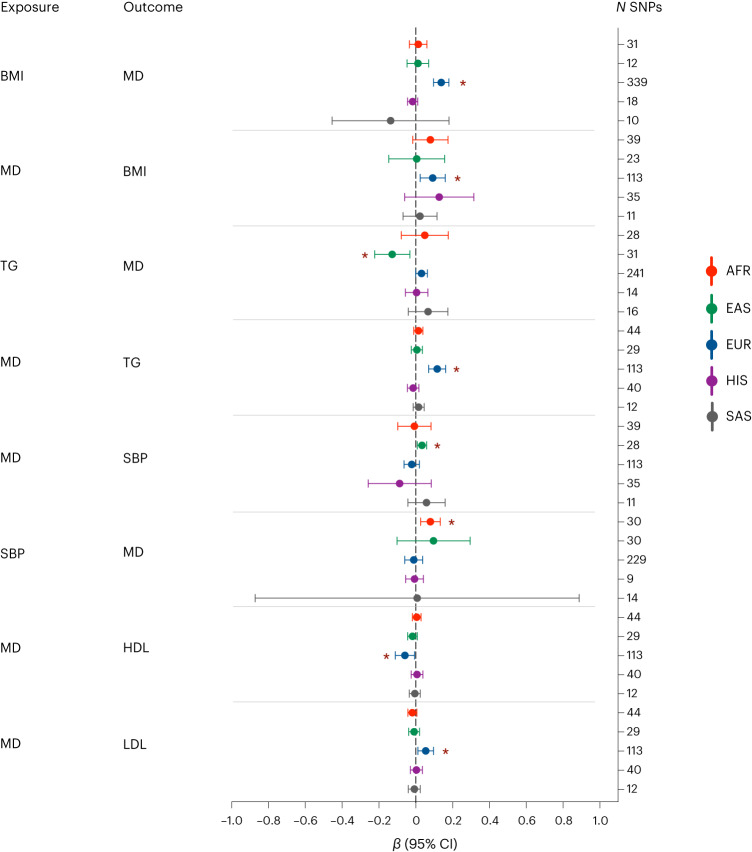
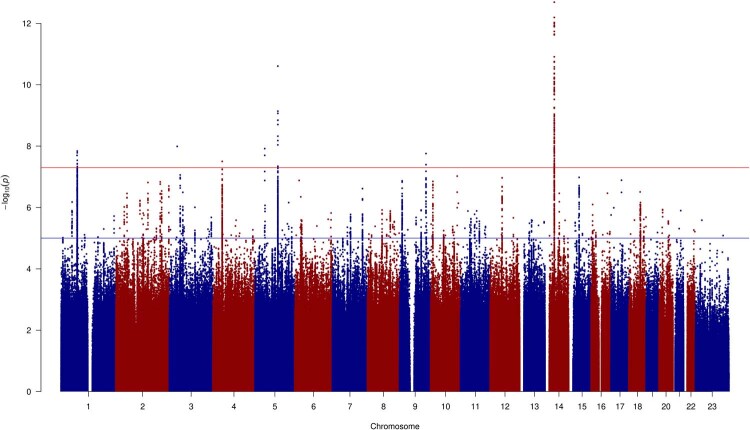
Most genome-wide association studies (GWAS) of major depression (MD) have been conducted in samples of European ancestry. Here we report a multi-ancestry GWAS of MD, adding data from 21 cohorts with 88,316 MD cases and 902,757 controls to previously reported data. This analysis used a range of measures to define MD and included samples of African (36% of effective sample size), East Asian (26%) and South Asian (6%) ancestry and Hispanic/Latin American participants (32%). The multi-ancestry GWAS identified 53 significantly associated novel loci. For loci from GWAS in European ancestry samples, fewer than expected were transferable to other ancestry groups. Fine mapping benefited from additional sample diversity. A transcriptome-wide association study identified 205 significantly associated novel genes. These findings suggest that, for MD, increasing ancestral and global diversity in genetic studies may be particularly important to ensure discovery of core genes and inform about transferability of findings.


Conflict of interest statement

O.G. is now a full-time employee at Union Chimique Belge. A.I.C. is currently an employee of Regeneron Pharmaceuticals and may own stock or stock options. C.T. reported being an employee of and receiving stock options from 23andMe during the conduct of the study. Y.J. reported being an employee of 23andMe outside the submitted work. All other authors declare no competing interests.

Figures

Fig. 1
Fig. 1. Schematic diagram of the analyses in this study.
We included data from 21 cohorts with diverse ancestry. We assigned individuals into ancestry/ethnic groups and carried out association analyses with MD for each. Subsequently, we meta-analyzed the results by ancestry/ethnic group. We tested whether previously reported MD loci from European ancestry studies are transferable to these groups. We also used the results for discovery of novel depression associations and MR to assess the causal effects of cardiometabolic traits by ancestry. We subsequently merged all ancestry/ethnicity-specific results in a multi-ancestry meta-analysis that also included samples with European ancestry. The multi-ancestry meta-analysis results formed the basis for locus discovery, fine mapping to identify causal variants and several gene prioritization approaches to identify genes linked to MD risk. ST.(n) refers to the corresponding Supplementary Table. ST.2* (in green) refers to Supplementary Table 2, showing genomic inflation estimates of multiple analyses.
Fig. 2
Fig. 2. Transferability of previously reported loci from European ancestry discovery GWAS of MD to other ancestry groups.
a, A Venn diagram showing the numbers of previously identified loci from European ancestry studies with evidence of transferability to the other ancestry/ethnic groups: African, Hispanic/Latin American, South Asian and East Asian (in black) and their intersections (in cyan). Only the 112 loci with evidence of transferability to at least one ancestry group are shown here. b, A plot showing power-adjusted transferability (PAT) ratios. We first calculated the observed number of transferable loci out of the 195, 196, 179 and 180 loci that were present in the African, Hispanic/Latin American, South Asian and East Asian ancestries, respectively. These were divided by the expected number of transferable loci (numbers displayed underneath the figure), taking effect estimates from previous European ancestry studies, and allele frequency and sample size information from our African, Hispanic/Latin American, South Asian and East Asian ancestry cohorts. The ratios are presented separately for broadly defined MD and clinically ascertained MD. The error bars indicate 95% CIs for PAT ratios. We were unable to compute results for clinical MD in the Hispanic/Latin American group because of insufficient numbers of cases.
Fig. 3
Fig. 3. Genetic correlations for MD between different ancestry groups.
A plot showing the genome-wide genetic correlations between the African, European, East Asian and Hispanic/Latin American groups. The intensity of the coloring reflects the strength of the correlation. The estimated coefficients and standard errors are also shown in each cell. We only present estimates where the s.e.m. was smaller than 0.3; otherwise, the field is colored in gray.
Fig. 4
Fig. 4. Resolution of the locus fine mapping based on the multi-ancestry and the European ancestry GWAS, showing the size of the credible sets for 155 significant loci.
a, A box plot showing the median (central line) and interquartile range (upper and lower hinges) of the sizes of the credible set for fine-mapped loci. The whiskers extend to 1.5 times the interquartile range. Data points falling outside that range are denoted by individual dots in the figure. b, Stacked bar charts showing the number of loci within size categories for credible sets.
Fig. 5
Fig. 5. Manhattan-style Z-score plot of gene associations with MD in a TWAS based on the GWAS summary statistics for broadly defined MD.
Significant gene associations are shown as red dots (354 significant genes, 205 of them novel), and the 50 most significant gene names are highlighted on both sides of the plot. Novel associations are shown in black, while genes previously associated with MD are shown in gray. The red lines indicate the significance threshold (P < 1.37 × 10−6). For genes on the top part of the graph, increased expression was associated with increased depression risk, while expression of the genes on the bottom part of the plot showed an inverse association. NT, novel transcript.
Fig. 6
Fig. 6. Bi-directional MR tests between MD and cardiometabolic outcomes.
The data are presented with a β and a 95% CI. Nominally significant associations are marked with a red asterisk. Statistics have been derived using the β and standard errors for the number of variants used as IVs in each analysis, shown as N SNPs. Results are not shown for diastolic blood pressure for which there were no significant associations. *P < 0.05 (P values in order from top to bottom: 6.88 × 10−11, 8.22 × 10−3, 9.22 ×10−3, 7.93 × 10−7, 7.67 × 10−3, 3.43 ×’10−3, 0.03 and 0.01). More details can be found in Supplementary Table 16. AFR, African ancestry; EAS, East Asian ancestry; EUR, European ancestry; HIS, Hispanic/Latin American group; SAS, South Asian ancestry.
Extended Data Fig. 1
Extended Data Fig. 1. Manhattan plots for genetic associations with major depression in non-European ancestries.
The y-axes show the −log10P values for the associations between each single-nucleotide polymorphism and major depression. The x-axes show the chromosomal position (GRCh37). The red line represents the genome-wide significance threshold of 5 × 10⁻⁸ and the blue line 10−5. a, Manhattan plot for African ancestry. Due to the restriction that SNPs need to be available in at least two studies, only results for 6,051 variants were available on the X chromosome. b, Manhattan plot for East Asian ancestry. c, Manhattan plot for Latin American ancestry. Association P values have been adjusted by the LDSC intercept of 1.0508. d, Manhattan plot for South Asian ancestry. Only one cohort provided data for variants on the X chromosome. Those are not included because for the meta-analysis at least two cohorts were required to provide data for each variant.
Extended Data Fig. 2
Extended Data Fig. 2. Manhattan plots for genetic associations with clinical major depression in individuals of non-European ancestries.
The y-axes show the −log10P values for the associations between each single-nucleotide polymorphism and major depression. The x-axes show the chromosomal position (GRCh37). The red line represents the genome-wide significance threshold of 5 × 10⁻⁸ and the blue line 10−5. a, Manhattan plot for African ancestry. b, Manhattan plot for East Asian ancestry. c, Manhattan plot for Latin American ancestry. d, Manhattan plot for South Asian ancestry.
Extended Data Fig. 3
Extended Data Fig. 3. Manhattan plot for genetic associations with major depression in the multi-ancestry meta-analysis.
The y-axes show the −log10P values for the associations between each single-nucleotide polymorphism and major depression. The x-axes show the chromosomal position (GRCh37). The red line represents the genome-wide significance threshold of 5 × 10−8 and the blue line 10−5. Association P values have been adjusted by the LDSC intercept of 1.0185.
Extended Data Fig. 4
Extended Data Fig. 4. Manhattan plot for genetic associations with clinical major depression in the multi-ancestry meta-analysis.
The y-axes show the −log10P values for the associations between each single-nucleotide polymorphism and major depression. The x-axes show the chromosomal position (GRCh37). The red line represents the genome-wide significance threshold of 5 × 10−8 and the blue line 10−5.

Similar articles

  • GWAS Meta-Analysis of Suicide Attempt: Identification of 12 Genome-Wide Significant Loci and Implication of Genetic Risks for Specific Health Factors.
    Docherty AR, Mullins N, Ashley-Koch AE, Qin X, Coleman JRI, Shabalin A, Kang J, Murnyak B, Wendt F, Adams M, Campos AI, DiBlasi E, Fullerton JM, Kranzler HR, Bakian AV, Monson ET, Rentería ME, Walss-Bass C, Andreassen OA, Behera C, Bulik CM, Edenberg HJ, Kessler RC, Mann JJ, Nurnberger JI Jr, Pistis G, Streit F, Ursano RJ, Polimanti R, Dennis M, Garrett M, Hair L, Harvey P, Hauser ER, Hauser MA, Huffman J, Jacobson D, Madduri R, McMahon B, Oslin DW, Trafton J, Awasthi S, Berrettini WH, Bohus M, Chang X, Chen HC, Chen WJ, Christensen ED, Crow S, Duriez P, Edwards AC, Fernández-Aranda F, Galfalvy H, Gandal M, Gorwood P, Guo Y, Hafferty JD, Hakonarson H, Halmi KA, Hishimoto A, Jain S, Jamain S, Jiménez-Murcia S, Johnson C, Kaplan AS, Kaye WH, Keel PK, Kennedy JL, Kim M, Klump KL, Levey DF, Li D, Liao SC, Lieb K, Lilenfeld L, Marshall CR, Mitchell JE, Okazaki S, Otsuka I, Pinto D, Powers A, Ramoz N, Ripke S, Roepke S, Rozanov V, Scherer SW, Schmahl C, Sokolowski M, Starnawska A, Strober M, Su MH, Thornton LM, Treasure J, Ware EB, Watson HJ, Witt SH, Woodside DB, Yilmaz Z, Zillich L, Adolfsson R, Agartz I, Alda M, Alfredsson L, Appadurai V, Artigas MS, Van der Auwera S, Azevedo MH, Bas… See abstract for full author list ➔ Docherty AR, et al. Am J Psychiatry. 2023 Oct 1;180(10):723-738. doi: 10.1176/appi.ajp.21121266. Am J Psychiatry. 2023. PMID: 37777856 Free PMC article.
  • Discovery and fine-mapping of kidney function loci in first genome-wide association study in Africans.
    Fatumo S, Chikowore T, Kalyesubula R, Nsubuga RN, Asiki G, Nashiru O, Seeley J, Crampin AC, Nitsch D, Smeeth L, Kaleebu P, Burgess S, Nyirenda M, Franceschini N, Morris AP, Tomlinson L, Newton R. Fatumo S, et al. Hum Mol Genet. 2021 Jul 28;30(16):1559-1568. doi: 10.1093/hmg/ddab088. Hum Mol Genet. 2021. PMID: 33783510 Free PMC article.
  • Identification of novel common breast cancer risk variants at the 6q25 locus among Latinas.
    Hoffman J, Fejerman L, Hu D, Huntsman S, Li M, John EM, Torres-Mejia G, Kushi L, Ding YC, Weitzel J, Neuhausen SL, Lott P; COLUMBUS Consortium; Echeverry M, Carvajal-Carmona L, Burchard E, Eng C, Long J, Zheng W, Olopade O, Huo D, Haiman C, Ziv E. Hoffman J, et al. Breast Cancer Res. 2019 Jan 14;21(1):3. doi: 10.1186/s13058-018-1085-9. Breast Cancer Res. 2019. PMID: 30642363 Free PMC article.
  • Genome-Wide Association Studies of Cancer in Diverse Populations.
    Park SL, Cheng I, Haiman CA. Park SL, et al. Cancer Epidemiol Biomarkers Prev. 2018 Apr;27(4):405-417. doi: 10.1158/1055-9965.EPI-17-0169. Epub 2017 Jun 21. Cancer Epidemiol Biomarkers Prev. 2018. PMID: 28637795 Free PMC article. Review.
  • Assessing the lack of diversity in genetics research across neurodegenerative diseases: A systematic review of the GWAS Catalog and literature.
    Jonson C, Levine KS, Lake J, Hertslet L, Jones L, Patel D, Kim J, Bandres-Ciga S, Terry N, Mata IF, Blauwendraat C, Singleton AB, Nalls MA, Yokoyama JS, Leonard HL. Jonson C, et al. Alzheimers Dement. 2024 Aug;20(8):5740-5756. doi: 10.1002/alz.13873. Epub 2024 Jun 21. Alzheimers Dement. 2024. PMID: 39030740 Free PMC article.

Cited by

References

    1. GBD 2017 DALYs and HALE Collaborators. Global, regional, and national disability-adjusted life-years (DALYs) for 359 diseases and injuries and healthy life expectancy (HALE) for 195 countries and territories, 1990–2017: a systematic analysis for the Global Burden of Disease Study 2017. Lancet 392, 1859–1922 (2018). - PMC - PubMed
    1. Wray NR, et al. Genome-wide association analyses identify 44 risk variants and refine the genetic architecture of major depression. Nat. Genet. 2018;50:668–681. doi: 10.1038/s41588-018-0090-3. - DOI - PMC - PubMed
    1. CONVERGE Consortium. Sparse whole-genome sequencing identifies two loci for major depressive disorder. Nature523, 588–591 (2015). - PMC - PubMed
    1. Zhang Y, Qi G, Park J-H, Chatterjee N. Estimation of complex effect-size distributions using summary-level statistics from genome-wide association studies across 32 complex traits. Nat. Genet. 2018;50:1318–1326. doi: 10.1038/s41588-018-0193-x. - DOI - PubMed
    1. Flint J, Kendler KS. The genetics of major depression. Neuron. 2014;81:1214. doi: 10.1016/j.neuron.2014.02.033. - DOI - PMC - PubMed

MeSH terms

Grants and funding