. 2023 Jun;3(6):552-568.
doi: 10.1038/s43588-023-00465-8. Epub 2023 Jun 26.

GRAPE for fast and scalable graph processing and random-walk-based embedding

Affiliations

GRAPE for fast and scalable graph processing and random-walk-based embedding

Luca Cappelletti et al. Nat Comput Sci. 2023 Jun.

Abstract

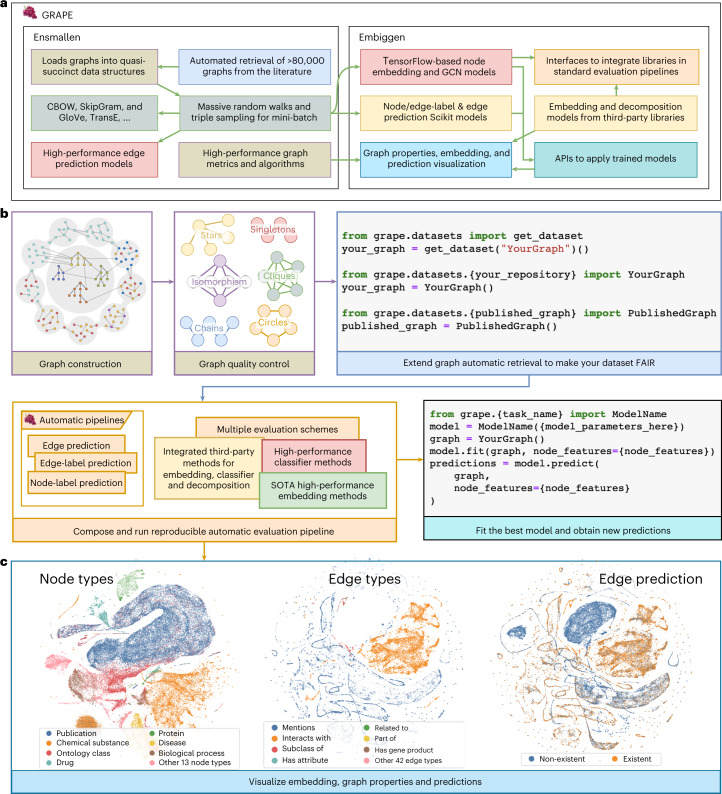
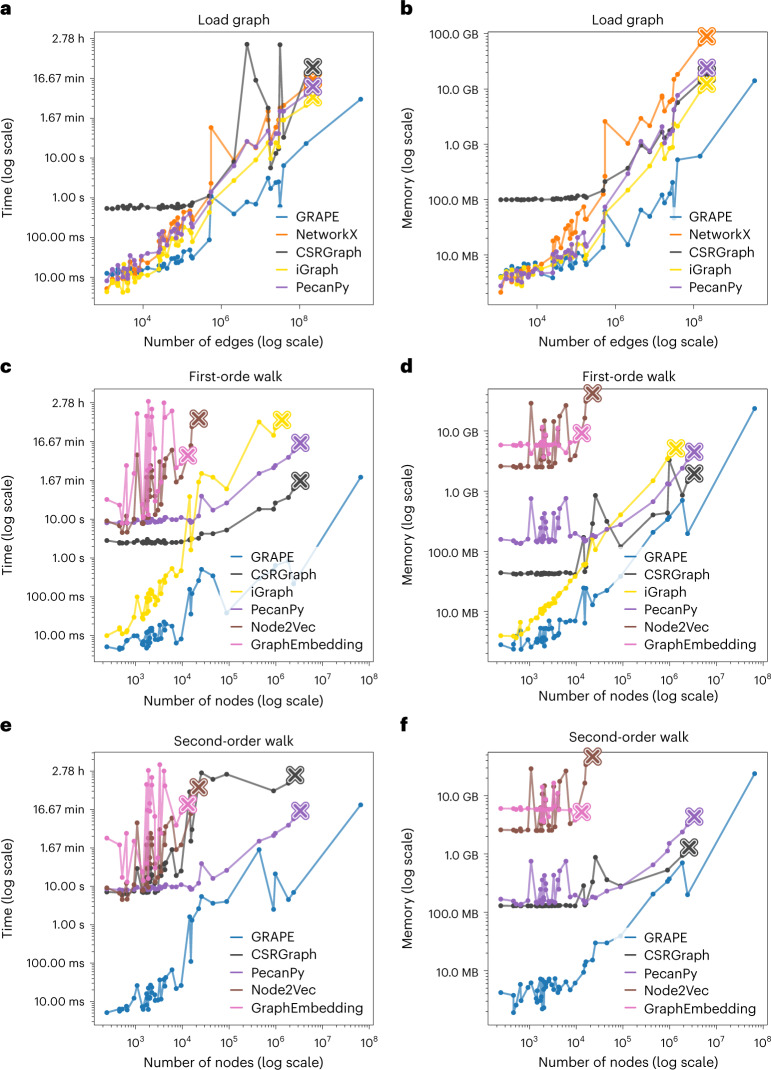
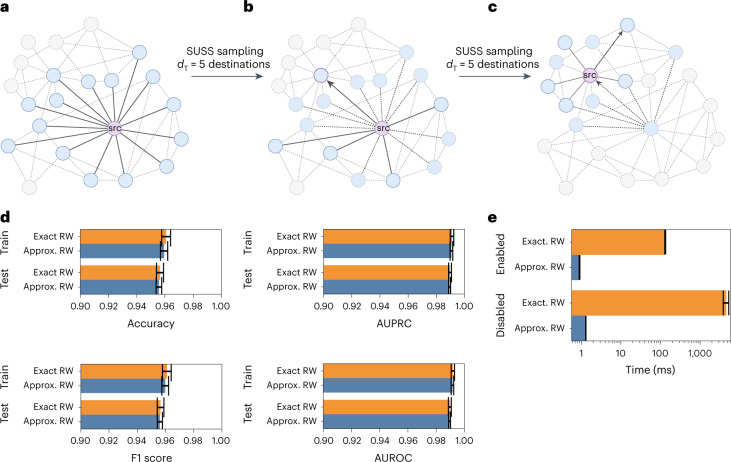
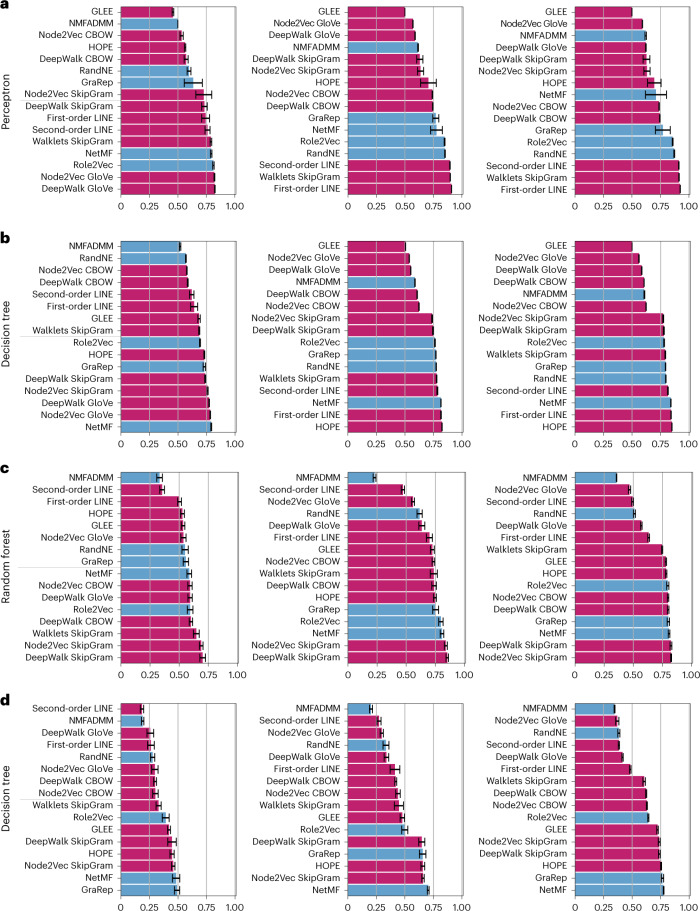
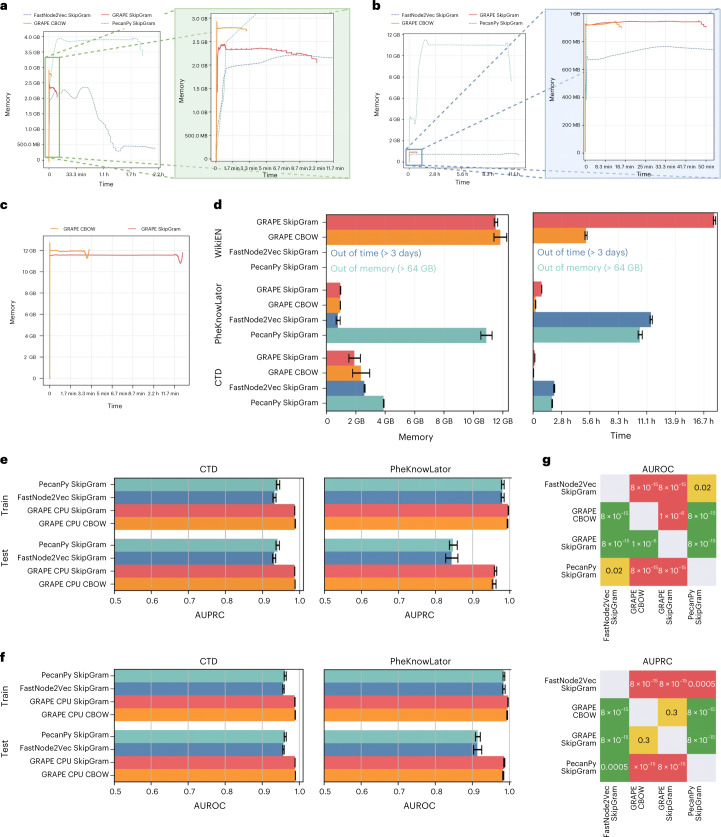
Graph representation learning methods opened new avenues for addressing complex, real-world problems represented by graphs. However, many graphs used in these applications comprise millions of nodes and billions of edges and are beyond the capabilities of current methods and software implementations. We present GRAPE (Graph Representation Learning, Prediction and Evaluation), a software resource for graph processing and embedding that is able to scale with big graphs by using specialized and smart data structures, algorithms, and a fast parallel implementation of random-walk-based methods. Compared with state-of-the-art software resources, GRAPE shows an improvement of orders of magnitude in empirical space and time complexity, as well as competitive edge- and node-label prediction performance. GRAPE comprises approximately 1.7 million well-documented lines of Python and Rust code and provides 69 node-embedding methods, 25 inference models, a collection of efficient graph-processing utilities, and over 80,000 graphs from the literature and other sources. Standardized interfaces allow a seamless integration of third-party libraries, while ready-to-use and modular pipelines permit an easy-to-use evaluation of graph-representation-learning methods, therefore also positioning GRAPE as a software resource that performs a fair comparison between methods and libraries for graph processing and embedding.


Conflict of interest statement

The authors declare no competing interests.

Figures

Fig. 1
Fig. 1. Schematic of GRAPE, Ensmallen and Embiggen.
a, High-level structure of the GRAPE software resource. b, Pipelines for an easy, fair, and reproducible comparison of graph-embedding techniques, graph-processing methods, and libraries. c, Visualization of the KGCOVID19 graph, obtained by displaying the first two components of the t-distributed stochastic neighbor embedding computed by using a Node2Vec SkipGram model that ignores the node and edge type during the computation. The clusters’ colors indicate the Biolink category for each node (left), the Biolink category for each edge (center), and the predicted edge existence (right).
Fig. 2
Fig. 2. Experimental comparison of GRAPE with state-of-the-art graph-processing libraries across 44 graphs.
a,b, Graph loading. a, Empirical execution time. b, Peak memory usage; the horizontal axis shows the number of edges, and the vertical axis shows peak memory usage. c,d, First-order RW. c Empirical execution time. d, Peak memory usage. e,f, Second-order RW. e, Empirical execution time. f, Peak memory usage. The multiplication symbols represent when a library crashes, exceeds 200 GB of memory, or takes more than 4 h to execute the task. Each line corresponds to a graph resource/library, and points on the lines refer to the 44 graphs used in the experimental comparison. Source data
Fig. 3
Fig. 3. Approximated RW.
a, The RW starts at the source node src; its 15 neighborhood nodes are highlighted in cyan. b, We sampled dT = 5 destination nodes (dT, degree threshold) from the available 15 destinations, using our SUSS algorithm, and performed a random step (edge highlighted with an arrow). c, A further step was then performed on the successor node (that then became the novel source node src), and the same process was repeated until the end of the walk. d, Edge prediction performance comparison (accuracy, AUPRC, F1 score, and AUROC computed over n = 10 holdouts—data are presented as mean values ± s.d.) using SkipGram-based embeddings and RW samples obtained with exact and approximated RWs for both the training and the test sets with the STRING–PPI dataset. Bar plots are zoomed in at 0.9 to 1.0, with error bars representing the s.d., computed over 30 holdouts. e, Empirical time comparison of the approximated and exact second-order RW algorithm on the graph sk-2005 (ref. ): 100-step RWs are run on 100 randomly selected nodes. Error bars represent the s.d. across n = 10 repetitions. Data are presented as mean values ± s.d. Source data
Fig. 4
Fig. 4. Comparison of embedding methods through the GRAPE pipelines on edge- and node-label prediction.
Results represent the mean balanced accuracy computed across n = 10 holdouts ± s.d. (results using other evaluation metrics are available in Supplementary Section 5). We sorted the embedding models by performance for each task; methods directly implemented in GRAPE are in purple, while integrated methods are in cyan. a,b, Edge prediction results obtained through a perceptron (a) and a decision tree (b). Bar plots from left to right show the balanced accuracy results obtained with the Human Phenotype Ontology (left), STRING H.sapiens (center), and STRING Mus musculus (right). c,d, Node-label prediction results obtained through a random forest (c) and a decision tree (d). Bar plots from left to right show the balanced accuracy achieved with CiteSeer (left), Cora (center), and PubMed Diabetes (right) datasets. Source data
Fig. 5
Fig. 5. Performance comparison between GRAPE and state-of-the-art implementations of Node2Vec on real-world big graphs.
GRAPE implementations achieve substantially better empirical time complexity. ac, The worst performance (maximum time and memory, denoised using a Savitzky–Golay filter) over ten holdouts on CTD (a), PheKnowLator (b), and Wikipedia (c). In a and b, the rectangles in the left figure are magnified in the right figure to highlight GRAPE performances. In the Wikipedia plot (c), only GRAPE results are available as the others either ran out of time or memory. d, Average memory and computational time across n = 10 holdouts; data are presented as mean values ± s.d. e,f, AUPRC (e) and AUROC (f) results of decision trees trained with different graph-embedding libraries; data are presented as mean values ± s.d. computed over n = 10 holdouts: GRAPE embedding achieves better edge prediction performance than those obtained by the other libraries. g, One-sided Wilcoxon signed-rank test results (P values) between GRAPE and the other state-of-the-art libraries, in which a win of a row against a column is in green, a tie in yellow, and a loss in red. Source data

References

    1. Hamilton WL. Graph representation learning. Synth. Lect. Artif. Intell. Mach. Learn. 2020;14:1–159.
    1. Shervashidze N, Schweitzer P, Van Leeuwen E, Mehlhorn K, Borgwardt KM. Weisfeiler-Lehman graph kernels. J. Mach. Learn. Res. 2011;12:2539–2561.
    1. Wu, Z., et al. A comprehensive survey on graph neural networks. IEEE transactions on neural networks and learning systems. 32, 4–24 (2020). - PubMed
    1. Csardi, G. & Nepusz, T. The Igraph software package for complex network research. Inter. J. Complex Sys.1695, 1–9 (2006)
    1. Low, Y., Gonzalez, J., Kyrola, A., Bickson, D., Guestrin, C. and Hellerstein, J.M., Graphlab: a new framework for parallel machine learning. In Proc. 26th Conference on Uncertainty in Artificial Intelligence, UAI’10 340–349 (AUAI Press, 2010).