. 2024 Feb;5(2):315-329.
doi: 10.1038/s43018-023-00686-w. Epub 2024 Jan 4.

Somatic mouse models of gastric cancer reveal genotype-specific features of metastatic disease

Affiliations

Somatic mouse models of gastric cancer reveal genotype-specific features of metastatic disease

Josef Leibold et al. Nat Cancer. 2024 Feb.

Abstract

Metastatic gastric carcinoma is a highly lethal cancer that responds poorly to conventional and molecularly targeted therapies. Despite its clinical relevance, the mechanisms underlying the behavior and therapeutic response of this disease are poorly understood owing, in part, to a paucity of tractable models. Here we developed methods to somatically introduce different oncogenic lesions directly into the murine gastric epithelium. Genotypic configurations observed in patients produced metastatic gastric cancers that recapitulated the histological, molecular and clinical features of all nonviral molecular subtypes of the human disease. Applying this platform to both wild-type and immunodeficient mice revealed previously unappreciated links between the genotype, organotropism and immune surveillance of metastatic cells, which produced distinct patterns of metastasis that were mirrored in patients. Our results establish a highly portable platform for generating autochthonous cancer models with flexible genotypes and host backgrounds, which can unravel mechanisms of gastric tumorigenesis or test new therapeutic concepts.


Conflict of interest statement

While not directly related to this manuscript, S.W.L. declares outside consultancy and equity for Oric Pharmaceuticals, Blueprint Medicines, Mirimus, Senecea Therapeutics, Faeth Therapeutics and PMV Pharmaceuticals; and outside consultancy (no equity) for Fate Therapeutics. J.L. has received consulting fees from Mirimus. The other authors declare no competing interests. None of these affiliations represents a competing interest with respect to the design or execution of this study or interpretation of data presented in this report.

Figures

Fig. 1
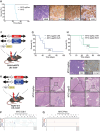
Fig. 1. Modeling molecular subtypes of gastric cancer in mice by a somatic tissue engineering approach.
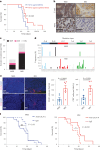
a, Schematic of the EPO-GEMMs of gastric cancer. A transposon vector harboring an oncogene in combination with a Sleeping Beauty transposase (SB13) and a CRISPR-Cas9 vector targeting tumor-suppressor genes are delivered into the stomach by direct in vivo electroporation. b, MSK-IMPACT oncoprint displaying the genomic status of recurrent oncogenes and tumor-suppressor genes in patients with gastric cancer. Copy-number gains are shown for MYC. Associated molecular subtypes (per TCGA) are shown on the right. Source data
Fig. 2
Fig. 2. CIN and GS gastric cancer EPO-GEMMs recapitulate hallmark histological and molecular features of the corresponding human subtypes.
a, Kaplan–Meier survival curves of C57BL/6 mice electroporated with a MYC transposon vector and a Sleeping Beauty transposase (MYC; black, n = 4 mice); a CRISPR-Cas9 vector targeting p53 (sgp53; purple, n = 4 mice) or the combination of all vectors (MYC-sgp53; blue, n = 9 mice). b, H&E and immunohistochemical staining for E-cadherin (E-Cad), Ki67 and cytokeratin 8 (CK8) of a MYC-p53−/− gastric EPO-GEMM tumor. Representative of n = 9 mice. c, Kaplan–Meier survival curves of C57BL/6 mice electroporated with a CRISPR-Cas9 vector targeting Apc (sgApc; gray, n = 3 mice) or with the combination of Sleeping Beauty, a MYC transposon vector and a CRISPR-Cas9 vector targeting Apc (MYC-sgApc; green, n = 10 mice). d, H&E and immunohistochemical staining for E-Cad, Ki67 and CK8 of a MYC-Apc−/− gastric EPO-GEMM tumor. Representative of n = 10 mice. e,f, Sparse whole-genome sequencing analysis of CNAs in MYC-p53−/− (n = 7 independent samples derived from separate mice) (e) and MYC-Apc−/− (n = 9 independent samples derived from separate mice) (f) gastric EPO-GEMM tumors. Frequency plots are shown on the top and individual sample tracks are provided on the bottom. Source data
Fig. 3
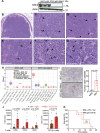
Fig. 3. Somatic loss of Msh2 induces microsatellite instability gastric cancer in mice.
a, Kaplan–Meier survival curves of C57BL/6 EPO-GEMMs with either MYC-p53−/− (MSS; same cohort as shown in Fig. 2a; blue, n = 9 mice) or MYC-p53−/−-Msh2−/− (MSI; red, n = 11 mice) gastric cancer. b, Immunohistochemical staining for E-cadherin and Msh2 of MYC-p53−/− (MSS) or MYC-p53−/−-Msh2−/− (MSI) gastric EPO-GEMM tumors. Representative of n = 11 mice. c, WES analysis of somatic mutations per Mb in either MYC-p53−/− or MYC-p53−/−-Msh2−/− gastric EPO-GEMM tumors (n = 3 independent mice each). SNP, single-nucleotide polymorphism; INS, insertion; DEL, deletion. d, Base substitution signature in MYC-p53−/− (MSS) and MYC-p53−/−-Msh2−/− (MSI) gastric EPO-GEMM tumors (n = 3 independent mice each). e, Representative immunofluorescence staining of intratumoral regions of MYC-p53−/− (MSS) or MYC-p53−/−-Msh2−/− (MSI) gastric EPO-GEMM tumors for CD45 (red, top) or CD3 (red, bottom). Quantification to the right (n = 6 independent mice each). Data are presented as mean ± s.e.m. f, Kaplan–Meier survival curves of C57BL/6 gastric cancer EPO-GEMMs of either MYC-p53−/− genotype (left) (n = 14 IgG-treated mice and n = 15 9H10-treated mice) or MYC-p53−/−-Msh2−/− genotype (right) (n = 14 IgG-treated mice and n = 16 9H10-treated mice) after antibody-mediated blockade of CTLA-4 (9H10, 200 µg) (solid line) or IgG control (dashed line). Treatment was initiated (day 0) after tumor formation was confirmed by abdominal palpation. Statistical analyses were one-sided log-rank test (a,f) and unpaired t-test (e). NS, not significant; *P <0.05. Source data
Fig. 4
Fig. 4. EPO-GEMMs recapitulate transcriptional features of human gastric cancer subtypes.
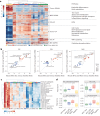
a, Heat map of DEGs across the indicated EPO-GEMM samples (each column represents one mouse; healthy n = 4, MSI n = 6, MSS-CIN n = 9, MSS-GS n = 6 independent samples derived from separate mice). Hierarchical clustering segregated all samples based on six signatures (1–6). Key pathways enriched in each signature are shown on the right. Complete lists of genes and pathway predictions are provided in Supplementary Table 1. TCA, tricarboxylic acid; ER, endoplasmic reticulum. b, Comparison of GSEA NES for Hallmark pathways enriched in EPO-GEMM (x axis) and human (y axis) tumors versus healthy stomach for the indicated genotypes/subtypes. Key pathways are highlighted. Circle size represents the adjusted P value. Complete lists of pathways and NES scores are provided in Supplementary Tables 2–4. c, Heat map of CIBERSORT signatures for distinct immune subpopulations in the indicated EPO-GEMM tumor and healthy gastric samples. d, Boxplots of CIBERSORT signature scores for the indicated immune populations and EPO-GEMM tumors ((n = 9 (MYC-p53−/−), n = 6 (MYC-Apc−/−), n = 6 (MYC-p53−/−-Msh2−/−) and n = 4 (healthy stomach) independent samples derived from separate mice). The center horizontal line denotes the median (50th percentile) value; the box extends from the 25th to the 75th percentile of each group’s distribution of values. The whiskers mark the 5th and 95th percentiles. Complete lists of CIBERSORT signature scores are provided in Supplementary Table 5. Two-sided Wilcoxon signed-rank test. Source data
Fig. 5
Fig. 5. Gastric cancer EPO-GEMMs display metastatic patterns that recapitulate the human disease.
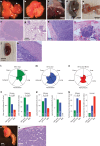
ae, Representative gross pathology images of liver (a), lungs (b) and peritoneal metastases at the diaphragm (c), body wall (d) and abdomen (e) from MYC-p53−/− gastric cancer EPO-GEMMs. Arrows point to macroscopic tumors. fi, Representative H&E-stained histological images of liver (f), lung (g) and peritoneal (h,i) metastases from MYC-p53−/− gastric cancer EPO-GEMMs. j,k, Representative macroscopic (j) and H&E-stained histological (k) images of an adrenal metastasis from MYC-p53−/−-Msh2−/− gastric cancer EPO-GEMMs. ln, Petal plots of metastasis incidence in the specified organs of EPO-GEMMs harboring the indicated genotypes. The radius of each petal corresponds to the fraction of mice developing metastases (mets) in the indicated organ; the outermost ring corresponds to 100% (n = 9–10 independent mice). Detailed numbers are provided in the statistical source data. o–q, Incidence of liver (o), lung (p) or peritoneal metastasis (q) in EPO-GEMMs and in the MSK-IMPACT cohort of patients with esophagogastric cancer with the corresponding genetic alterations. The exact number of independently analyzed tumors is indicated. Statistical analysis by Fisher’s exact test. r–s, Representative macroscopic (r) and H&E-stained histological (s) images of an ovarian metastasis from a MYC-p53−/− gastric cancer EPO-GEMM. Source data
Fig. 6
Fig. 6. NK cells suppress gastric cancer metastasis.
a, Kaplan–Meier survival curves of immunocompetent C57BL/6 mice (BL/6, green; same cohort as shown in Fig. 2c) and immunodeficient R2G2 mice (purple, n = 8 mice) with electroporation-induced MYC-Apc−/− gastric cancer. b, H&E staining of liver metastases from mice in a. Representative of n = 5 mice (BL/6) or n = 8 mice (R2G2) per group. c, Quantification of the number of liver metastases (left) and the percentage area of total liver occupied by metastases (right) from a subset of mice in a (BL/6 n = 5 mice; R2G2 n = 8 mice). d, Kaplan–Meier survival curves of BL/6 MYC-Apc−/− gastric cancer EPO-GEMMs treated with an NK1.1-targeting antibody (purple, n = 22 mice) or IgG control (green, n = 21 mice). e, Quantification of the number of liver metastases (left) and the percentage area of total liver occupied by the metastases (right) in a randomly chosen subset of mice from d (IgG n = 7 mice; NK1.1 n = 7 mice). Statistical analyses were one-sided log-rank test (a,d) and two-tailed Mann–Whitney U-test (c,e). Source data
Fig. 7
Fig. 7. CD8+ T cells provide an added layer of metastasis immune surveillance in MSI tumors.
a, Metastatic burden (% tumor area) in the liver (left) or lung (right) of BL/6 mice after tail vein injection of MYC-p53−/− (MSS, blue, n = 9 or 10 mice) or MYC-p53−/−-Msh2−/− (MSI, red, n = 8 or 9 mice) gastric cancer cells. Mice were treated with either an NK1.1-targeting antibody or IgG control. Data are presented as mean ± s.e.m. b, Incidence of lung metastasis after tail vein injection of MSS or MSI gastric cancer cells into immunocompetent (C57BL/6) or immunodeficient (R2G2) mice. Exact numbers of independent mice are indicated on each bar. c, H&E staining of lungs isolated from mice in b. Representative of n = 11 mice (MSI in R2G2) or n = 12 mice (all other conditions) per group. d, Incidence of lung metastasis after tail vein injection of MSS or MSI gastric cancer cells into immunocompetent (C57BL/6) mice that were treated with either CD4- or CD8-targeting antibodies or an IgG control. Exact numbers of independent mice are indicated on each bar. e, H&E images of lungs isolated from mice in d. Exact numbers of independent mice are indicated on each bar. f, Fraction of metastatic samples in the MSK-IMPACT cohort of patients with esophagogastric cancer with either MSS or MSI disease. The exact number of independently analyzed tumors is indicated on each bar. Statistical analyses were ordinary one-way ANOVA (a) and Fisher’s exact test (b,d,f) . Source data
Extended Data Fig. 1
Extended Data Fig. 1. Description of gastric EPO-GEMM procedure and analysis of body weight and inflammation post-electroporation.
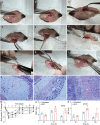
(A-I) Step-by-step illustration of the EPO-GEMM procedure: (a, b) After hair removal, scrubbing of the surgical site with povidone-iodine, and rinsing with 70% alcohol, incisions of the skin (A) and the peritoneum (B) of about 7 mm each are made in the epigastric region. (c) The stomach is localized in the peritoneal cavity and mobilized to the exterior using a curved forceps. The right forceps in the image holds the forestomach. (d) To open the stomach, a 4-mm incision is made in the forestomach. (e) The stomach is rinsed with prewarmed saline using a flexible oral gavage needle to remove any remaining food. (f) The epithelial part of the stomach is mobilized to the exterior through the incision in the forestomach using a curved forceps, and the plasmid mix is injected into the epithelial layer of the corpus region using a 30G needle. A small liquid filled bubble forms around the injection area (arrow). (g) The Nepagene tweezer electrodes are loosely placed around the plasmid-containing bubble and electric pulses are applied by the Nepagene electroporator. (h-i) The stomach is reversed, and the forestomach and all the layers are sutured at once in a continuous seam using absorbable sutures (Ethicon 5-0). Afterwards, the peritoneal cavity is closed by single knot sutures and the incision in the skin is closed by surgical staples. (j–l) Extent of inflammation after electroporation with vehicle only. (J) Edema with limited influx of neutrophils at the electroporation site seen 24 h after EPO, consistent with early signs of local inflammation. Representative image of n = 3 mice. (K) Influx of neutrophils in the mucosal area (dashed line) at the electroporation site seen 72 h after EPO, consistent with a developing inflammatory response. Representative image of n = 3 mice. (L) Acute inflammatory response characterized by influx of neutrophils in the glandular (g) and muscle (m) layers of the stomach at the electroporation site, seen 192 h after EPO. Representative image of n = 3 mice. (M) Changes in animal body weight over 8 days following the EPO procedure. Individual lines represent independent mice (n = 9 mice). (n–o) Levels of white blood cells (N) and neutrophils (O) in the peripheral blood of mice at the indicated time-points following electroporation with vehicle only. Untreated mice that were not subjected to surgery or EPO served as controls (n = 3 independent mice per group). Statistical analysis by unpaired two-sided t-tests. Data are presented as mean values +/− s.e.m. Source data
Extended Data Fig. 2
Extended Data Fig. 2. Gastric cancer EPO-GEMMs develop through a stepwise progression of precursor lesions.
(a) Sanger sequencing results confirming editing of the Trp53 locus targeted by the indicated CRISPR/Cas9-sgRNA in a MYC-p53 EPO-GEMM gastric tumor. (b, c) Representative ultrasound images of developing gastric EPO-GEMM tumors. Dashed yellow line demarcates the stomach; dashed red line indicates the tumors. (d–f) Representative gross pathology images of EPO-GEMM stomachs at different stages of tumor development. Tumor formation at the electroporation site is evident in early-stage tumors (E, arrows). (g–n) Histological analysis of precursor and early gastric EPO-GEMM lesions. (g) Normal murine fundic mucosa (f = foveolar cells; p = parietal cells; c = chief cells) (bar = 500 µm). Representative image of n = 3 mice. (h) Atrophy of the fundic mucosa with loss of chief and parietal cells (bar = 250 µm). Representative image of n = 3 mice. (i) Hyperplasia in the fundic mucosa (arrow) with increased basophilia of glandular epithelium (bar = 200 µm). Representative image of n = 3 mice. (j) Mild to moderate mucinous metaplasia (arrows) in the gastric fundus (bar = 200 µm). Representative image of n = 3 mice. (k) Moderate to severe mucinous metaplasia (arrows), hyperplasia, and dysplasia in the gastric fundus. There was also a focus of adenomyosis (arrowhead) (bar = 200 µm). Representative image of n = 3 mice. (l) Dysplasia (arrows) of glandular mucosa (bar = 100 µm). Representative image of n = 3 mice. (m) Higher magnification of glandular dysplasia (arrows) (bar = 200 µm). Representative image of n = 3 mice. (n) Glandular dysplasia, hyperplasia (arrow = mitotic figures), and necrosis (arrowhead) in the gastric fundus (bar = 100 µm). Representative image of n = 3 mice. Source data
Extended Data Fig. 3
Extended Data Fig. 3. Histopathological analysis of CIN gastric cancer EPO-GEMMs.
(A–I) Histological characterization of tumor progression in MYC-p53−/− tumors. (A-C) Initially, MYC-p53−/− tumors were moderately well-differentiated adenocarcinomas: (a) Areas of tubular gland formation (arrows) (bar = 200 μm). Representative image of n = 3 mice. (b) Higher magnification of adenomatous proliferation (arrow) in a typical early tumor. The tumor cells formed single and multiple layers around the lumens (bar = 100 µm). Representative image of n = 3 mice. (c) Neoplastic glands (arrows) with cell debris (asterisks) in lumen. Neoplastic glands were lined by tightly adherent pleomorphic columnar and stratified epithelial cells with irregular large nuclei, clumped chromatin, and prominent nucleoli (bar = 100 µm). Representative image of n = 3 mice. (d) As MYC-p53−/− tumors progressed, the area of glandular formation (arrows) decreased and blended with larger sheets of tumor cells (arrowheads) typical of a diffuse tumor phenotype (bar = 200 µm). Representative image of n = 3 mice. (e) When MYC-p53−/− tumors transitioned from adenomatous to diffuse, the tumors occasionally developed focal areas of micro-lobules (arrows) separated by prominent stroma (arrowheads) (bar = 250 µm). Representative image of n = 3 mice. (f–i) Eventually, MYC-p53−/− tumors lost all adenomatous features and became diffuse tumors with solid sheets of neoplastic cells. Representative image of n = 3 mice. (F) These late-stage tumors featured small monomorphic epithelial tumor cells with small basophilic nuclei and scant cytoplasm. The neoplastic cells had a high nuclear/cytoplasm ratio consistent with malignancy (bar = 200 µm). Representative image of n = 3 mice. (G) High magnification of an MYC-p53−/− tumor characterized by sheets of tumor cells with minimal stroma and a diffuse tumor phenotype. There were numerous mitotic figures (arrows) and apoptotic/necrotic cells (arrowheads) (bar = 100 µm). Representative image of n = 3 mice. (H) The tumors were highly invasive and penetrated the submucosa and muscle layers of the stomach (arrows) and spread into the sub-serosa (arrowhead) (bar = 500 µm). Representative image of n = 3 mice. (I) The invasive tumors (arrows) penetrated all layers of gastric muscle (arrowhead) (bar = 200 µm). Representative image of n = 3 mice. (j-l) Representative immunohistochemistry staining of a MYC-p53 EPO-GEMM gastric tumor for MYC (J), hydrogen/potassium ATPase (H+K) (K), and MUC6 (L). Representative images of n = 3 mice. (M) Gross pathology image of a mMyc-p53−/− tumor-bearing EPO-GEMM stomach. Representative image of n = 2 mice. (n-p) Representative hematoxylin & eosin (H&E) staining (N) and immunohistochemical staining for MYC (O) and E-cadherin (P) of a mMyc-p53−/− tumor. Representative images of n = 2 mice. (q) Gross pathology image of a MYC-p53Q97* tumor-bearing EPO-GEMM stomach. Representative image of n = 1 mouse. (R) H&E staining of a MYC-p53Q97* tumor. Representative image of n = 1 mouse. (S) Sanger sequencing results confirming CRISPR base editing of the Trp53 locus targeted by the indicated CRISPR/Cas9-sgRNA in a MYC-p53Q97* EPO-GEMM gastric tumor. Source data
Extended Data Fig. 4
Extended Data Fig. 4. Histopathological analysis of GS gastric cancer EPO-GEMMs.
(a) Sanger sequencing results confirming editing of the Apc locus targeted by the indicated CRISPR/Cas9-sgRNA in a MYC-Apc EPO-GEMM gastric tumor. (b) Sanger sequencing results confirming editing of the Cdh1 locus targeted by the indicated CRISPR/Cas9-sgRNA in a MYC-Cdh1 EPO-GEMM gastric tumor. (c) Kaplan–Meier survival curves of C57BL/6 EPO-GEMMs after electroporation with either MYC and Cdh1 vector (orange, n = 9 mice) or MYC vector only (black, n = 4 mice). (d–f) Histological analysis of a typical MYC-Apc EPO-GEMM gastric tumor: (D) MYC-Apc−/− tumors were diffuse with sheets of neoplastic cells and little stroma (bar = 250 µm). Representative image of n = 3 mice. (E) Higher magnification of a MYC-Apc−/− tumor with tightly cohesive neoplastic cells and scant extracellular matrix. There are abundant foci of apoptotic and necrotic cells (arrows) (bar = 250 µm). Representative image of n = 3 mice. (F) MYC-Apc−/− tumors had abundant mitotic figures (arrows) and apoptotic cells (arrowheads) consistent with tumor growth and lack of differentiation (bar = 100 µm). Representative image of n = 3 mice. (g–j) Representative immunohistochemistry staining of a MYC-Apc EPO-GEMM gastric tumor for MYC (G), hydrogen/potassium ATPase (H+K) (H), beta-catenin (CTNNB1) (I), and MUC6 (J) Representative images of n = 10 mice. (k-m) Histological analysis of a typical MYC-Cdh1 EPO-GEMM gastric tumor: (K) MYC-Cdh1−/− tumors showed diffuse histology with sheets of tumor cells subdivided by loose connective tissue (arrows) (bar = 250 µm). Representative image of n = 3 mice. (L) MYC-Cdh1−/− tumor cells lacked normal cell-cell adhesion (arrows) consistent with loss of E-cadherin (bar = 100 µm). Representative image of n = 3 mice. (M) MYC-Cdh1−/− liver metastases shared the poorly adherent individual cell feature (arrows) of the primary tumor (bar = 100 µm). Representative image of n = 3 mice. (n-s) H&E (N) and immunohistochemistry staining for E-Cadherin (E-cad) (O), cytokeratin 8 (CK8) (P), vimentin (Vim) (Q), MYC (R), and Ki67 (S) of a MYC-Cdh1 EPO-GEMM gastric tumor (bar = 50 µm). Representative images of n = 4 mice. (t-u) H&E (T) and immunohistochemistry for E-cadherin (E-Cad) (U) in a MYC-p53−/− EPO-GEMM gastric tumor in a CK8-CreERT2; LSL-Cas9 mouse. Representative images of n = 6 mice. (v, w) H&E (V) and immunohistochemistry for E-cadherin (E-Cad) (W) of an undifferentiated MYC-p53−/− EPO-GEMM gastric tumor in a C57BL/6 (BL/6) mouse. Representative images of n = 9 mice. (x) MSK-IMPACT oncoprint displaying the genomic status of alterations in TP53 and CDH1 in gastric cancer patients. Alterations in p53 and CDH1 are mutually exclusive in this setting. Statistical analysis via cBioPortal,. Source data
Extended Data Fig. 5
Extended Data Fig. 5. Gastric EPO-GEMM tumors originate from epithelial cells in the stomach.
(a) Kaplan–Meier survival curves of C57BL/6 EPO-GEMMs after electroporation with either MYC and Pten−/− vectors (blue, n = 9 mice) or MYC vector only (black, n = 4 mice). (b–e) Representative H&E (B) and immunohistochemistry staining for E-Cadherin (E-cad) (C), Ki67 (D), and hydrogen/potassium ATPase (H+K) (E) of a MYC-Pten EPO-GEMM gastric tumor. (f) Schematic of CK8-Cre restricted EPO-GEMM experiments. A transposon vector harboring MYC in combination with a Sleeping Beauty transposase (SB13) and/or a CRISPR-Cas9 vector targeting either p53 or Apc were delivered into the stomach of CK8-CreERT2; LSL-Cas9 mice by direct in vivo electroporation. (g) Kaplan–Meier survival curves of C57BL/6 MYC-p53−/− EPO-GEMMs (blue dashed line, n = 9 mice, same cohort as shown in Fig. 2a) or CK8-CreERT2; LSL-Cas9 MYC-p53−/− EPO-GEMMs (blue line, n = 7 mice). (h) Kaplan–Meier survival curves of C57BL/6 MYC-Apc−/− EPO-GEMMs (green dashed line, n = 10 mice, same cohort as shown in Fig. 2c) or CK8-CreERT2; LSL-Cas9 MYC-Apc−/− EPO-GEMMs (green line, n = 6 mice). (i-j) H&E (I) and immunohistochemistry for E-cadherin (E-Cad) (J) of a CK8-CreERT2; LSL-Cas9 MYC-Apc−/− EPO-GEMM gastric tumor. Representative images of n = 4 mice. (k) Schematic of Atp4b-Cre restricted EPO-GEMM experiments. A transposon vector harboring MYC in combination with a Sleeping Beauty transposase (SB13) and/or a CRISPR-Cas9 vector targeting either p53 or Apc were delivered into the stomach of Atp4b-Cre; LSL-Cas9 mice by direct in vivo electroporation. (l-m) H&E of an Atp4b-Cre; LSL-Cas9 MYC-Apc−/− EPO-GEMM gastric tumor (L) and a corresponding liver metastasis (M) (scale bar = 1 mm upper row, 200 µm lower row). Representative images of n = 2 mice. (n-o) H&E of an Atp4b-Cre; LSL-Cas9 MYC-p53−/− EPO-GEMM gastric tumor (N) and a corresponding lung metastasis (O) (scale bar = 1 mm upper row, 200 µm lower row). Representative images of n = 2 mice. (p) Sparse whole-genome sequencing analysis of copy number alterations in MYC-Cdh1 gastric EPO-GEMM tumors (n = 4 mice). Frequency plot is shown on the top and individual sample tracks are provided on the bottom. (q) Sparse whole-genome sequencing analysis of copy number alterations in MYC-Pten gastric EPO-GEMM tumors (n = 5 mice). Frequency plot is shown on the top and individual sample tracks are provided on the bottom. Statistical analysis: (G, H) one-sided log-rank test. Source data
Extended Data Fig. 6
Extended Data Fig. 6. Histopathological and molecular analysis, and response to immunotherapy in MSI gastric cancer EPO-GEMMs.
(a) Immunoblot of MSH2 and actin (loading control) in MSI or MSS gastric cancer cell lines (n = 3 lines each, derived from independent mice). (b) Most of the MSI tumor was typically diffuse (bar = 1 mm). Representative image of n = 3 mice. (c) Higher magnification of an MSI tumor with tightly cohesive neoplastic cells and scant extracellular matrix. There were abundant foci of apoptotic and necrotic cells (arrows) (bar = 250 µm). Representative image of n = 3 mice. (d) A region of diffuse phenotype in an MSI tumor composed of sheets of tumor cells (arrows) and minimal stroma (arrowheads) (bar = 200 µm). Representative image of n = 3 mice. (e) In rare areas, MSI tumors formed primitive glandular-like structures (arrows) (bar = 200 µm). (f-g) MSI tumors had numerous mitotic figures (arrows) and apoptotic cells (arrowhead) (bar = 50 µm). Representative images of n = 3 mice. (h) Whole-exome sequencing analysis of insertions (INS) or deletions (DEL) in either MYC-p53−/− or MYC-p53−/−-Msh2−/− gastric tumors (n = 3 independent mice each). The center horizontal line denotes the median (50th percentile) value; box extends from the 25th to the 75th percentile of each group′s distribution of values. The whiskers mark the 5th and 95th percentiles. (i) Representative immunohistochemistry staining of intratumoral regions of MYC-p53−/− (MSS) or MYC-p53−/−-Msh2−/− (MSI) gastric EPO-GEMM tumors for CD8. Quantification to the right (n = 3 independent mice each). Data are presented as mean values +/− s.e.m. (j) Number of CD3+, CD4+ and CD8+ T cells (left) or CD11c+ cells (right) in MSI gastric tumors after treatment of mice with antibodies targeting CTLA-4 or IgG control (n = 7 independent mice each). Statistical analysis by two-tailed Mann–Whitney U-test. Data are presented as mean values +/− s.e.m. (k) Kaplan–Meier survival curves of C57BL/6 gastric cancer EPO-GEMMs of MYC-p53−/−-Msh2−/− genotype (n = 8 mice IgG-treated, 4 mice α-PD-1-treated) after antibody-mediated blockade of PD-1 (RMP1-14, 200 µg) (solid line) or IgG control (dashed line). Treatment was initiated (day 0) after tumor formation was confirmed by abdominal palpation. Statistical analysis by one-sided log-rank test; ns = not significant (P > 0.05). Source data
Extended Data Fig. 7
Extended Data Fig. 7. Transcriptomic analysis of gastric cancer EPO-GEMMs.
(a, b) Venn diagrams showing overlap of differentially upregulated (A) or down regulated (B) genes (vs. healthy stomach) for the indicated EPO-GEMM tumor genotypes. Key pathways enriched in each gene subset are labeled accordingly. Complete lists of pathway predictions are provided in Supplementary Tables 6–19. (c–e) Complete lists of the Hallmark Pathways and NES scores shown in Fig. 4b, along with the NES scores for human gastric tumors of the corresponding subtypes. (f) Gene set enrichment analysis (GSEA) for Hallmark p53 Pathway comparing MYC-p53−/− and MYC-Apc−/− gastric tumors. (g) Comparison of GSEA NES scores for hallmark pathways (left) or immune populations (right) enriched in mouse (y axis) and human (x axis) MSI gastric tumors. Highlighted are key immune populations enriched in MSI tumors. Circle size represents -log(adjusted P value). A complete list of NES scores is provided in Supplementary Tables 20, 21. Source data
Extended Data Fig. 8
Extended Data Fig. 8. Invasive and metastatic features of gastric cancer EPO-GEMMs.
(a) H&E images showing the boundary (dashed lines) between normal stomach and gastric tumors with areas of local invasion (arrows) in C57BL/6 EPO-GEMMs with MYC-p53−/− (left) and MYC-Apc−/− (right). Representative image of n = 3 mice. (b) Petal plot of metastasis incidence in the specified organs of MYC-Cdh1 EPO-GEMMs. The radius of each petal corresponds to the fraction of mice developing metastases in the indicated organ; the outermost ring corresponds to 100% (n = 6 independent mice). (c) Macroscopic (left) and H&E histology image (right) of liver metastasis in mice subjected to tail vein injection of a MYC-Apc−/− gastric cancer cell line. Images are representative of 3 metastasis-bearing livers from 10 mice analyzed. (d) Incidence of liver and lung metastases among the MSK-MET cohort of gastric cancer patients with WNT pathway mutations or TP53 mutations. Statistical analysis as reported. (e) Macroscopic (left) and H&E histology image (right) of ovarian metastasis in mice subjected to tail vein injection of MYC-p53−/− gastric cancer cell lines. Images are representative of one metastasis-bearing ovary from 10 mice analyzed for each of three independent cell lines. Source data
Extended Data Fig. 9
Extended Data Fig. 9. NK cells suppress gastric cancer metastasis to the liver.
(a) Primary tumor weights of a random subset of mice from Fig. 6d (IgG n = 4 mice; α-NK1.1 n = 6 mice). (b, c) Hematoxylin and eosin (H&E) staining of liver metastases of C57BL/6 MYC-Apc−/− EPO-GEMMs treated with an NK1.1-targeting antibody or the respective IgG control directly before tumor initiation (B) (representative image of n = 7 mice) or after palpable tumor formation (C) (representative image of n = 8 mice). (d) H&E staining of livers of C57BL/6 mice after tail vein injection of MYC-Apc−/− gastric cancer cells and treatment with either an antibody targeting NK1.1 (right) or IgG control (left) (representative images of n = 8–9 mice per group). (e) Quantification of the number of liver metastases (left) and the percentage area of total liver occupied by the metastasis (right) from mice in (D) (n = 8 independent mice). (f) H&E staining of livers of C57BL/6 mice after splenic injection of MYC-Apc−/− gastric cancer cells and treatment with either an antibody targeting NK1.1 (right) or IgG control (left). Representative images of n = 12–14 mice per group. (g) Quantification of the number of liver metastases (left) and the percentage area of total liver occupied by the metastases (right) from mice in (F) (n = 12 independent mice). (h) Quantification of the percentage area of total lung occupied by metastases in a randomly chosen subset of R2G2 mice from Fig. 7b (MSS n = 7 mice; MSI n = 6 mice). Statistical analysis: (A), (E), (G), (H) two-tailed Mann–Whitney U-test. Data are presented as mean values +/− s.e.m. Source data
Extended Data Fig. 10
Extended Data Fig. 10. Flow cytometry gating strategy.
(a, b) Representative flow cytometric analysis of MSI gastric tumors after treatment with antibodies targeting CTLA-4 (A) or IgG control (B). Placement of gates was based on FMO controls.

References

    1. Sung H, et al. Global cancer statistics 2020: GLOBOCAN estimates of incidence and mortality worldwide for 36 cancers in 185 countries. CA Cancer J. Clin. 2021 doi: 10.3322/caac.21660. - DOI - PubMed
    1. Ajani JA, et al. Gastric Cancer, Version 3.2016, NCCN Clinical Practice Guidelines in Oncology. J. Natl Compr. Canc. Netw. 2016;14:1286–1312. doi: 10.6004/jnccn.2016.0137. - DOI - PubMed
    1. Smyth EC, Nilsson M, Grabsch HI, van Grieken NC, Lordick F. Gastric cancer. Lancet. 2020;396:635–648. doi: 10.1016/S0140-6736(20)31288-5. - DOI - PubMed
    1. Wagner AD, et al. Chemotherapy for advanced gastric cancer. Cochrane Database Syst. Rev. 2017;8:CD004064. - PMC - PubMed
    1. Huang KK, et al. Genomic and epigenomic profiling of high-risk intestinal metaplasia reveals molecular determinants of progression to gastric cancer. Cancer Cell. 2018;33:137–150. doi: 10.1016/j.ccell.2017.11.018. - DOI - PubMed

Publication types