. 2022 Sep;2(9):605-616.
doi: 10.1038/s43588-022-00299-w. Epub 2022 Sep 8.

Identifying patterns in amyotrophic lateral sclerosis progression from sparse longitudinal data

Collaborators, Affiliations

Identifying patterns in amyotrophic lateral sclerosis progression from sparse longitudinal data

Divya Ramamoorthy et al. Nat Comput Sci. 2022 Sep.

Abstract

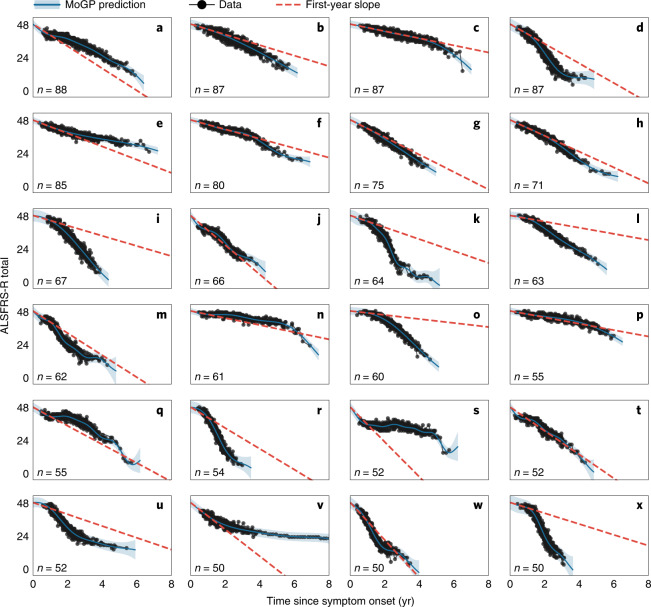
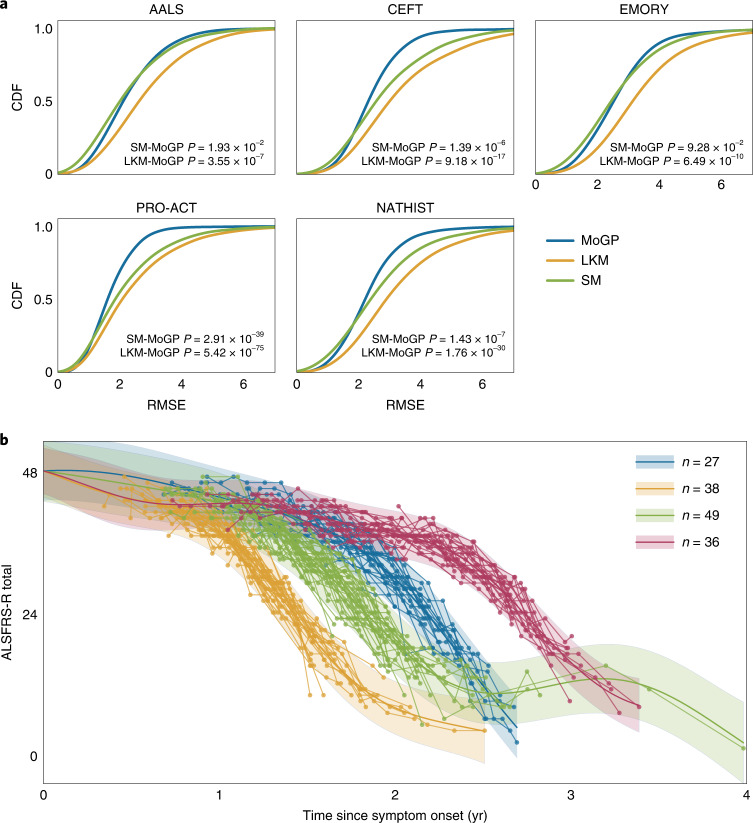
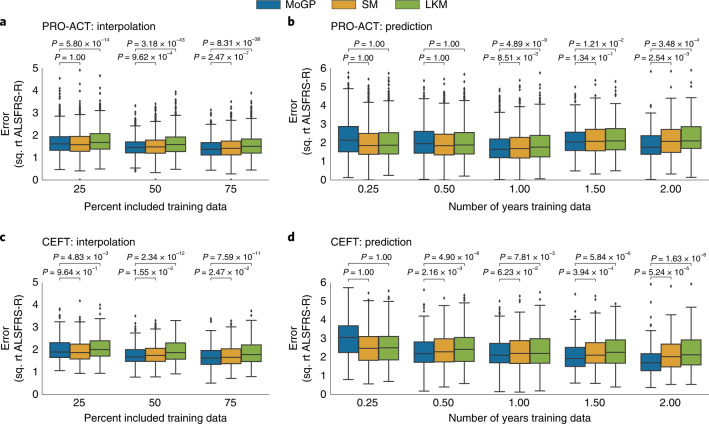
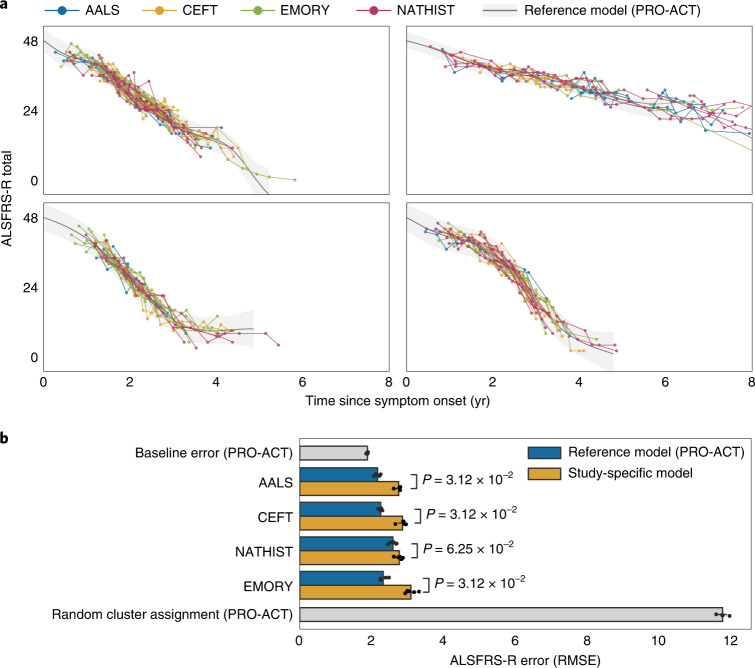
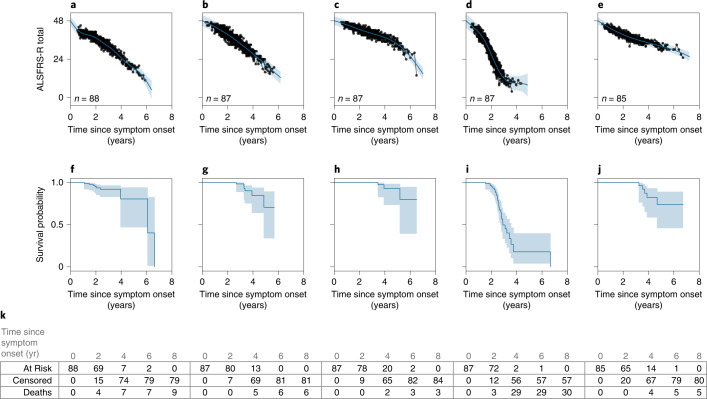
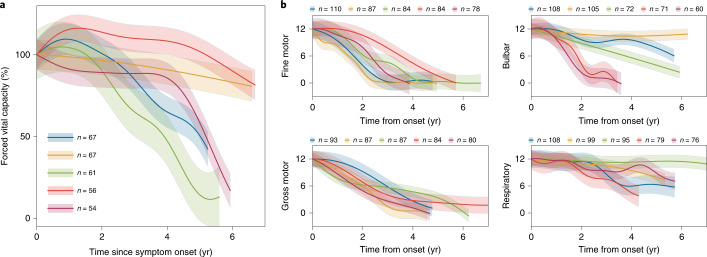
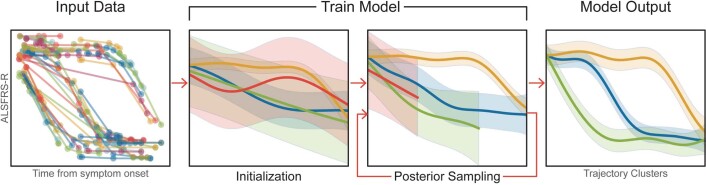
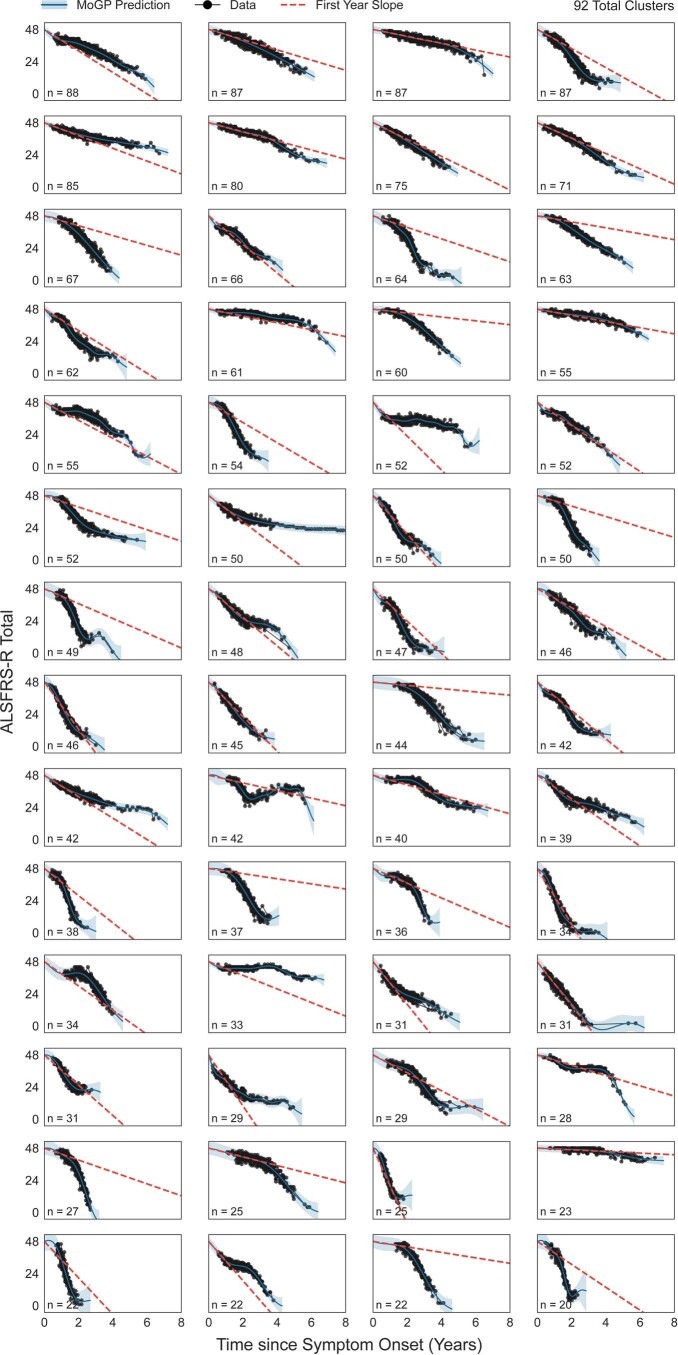
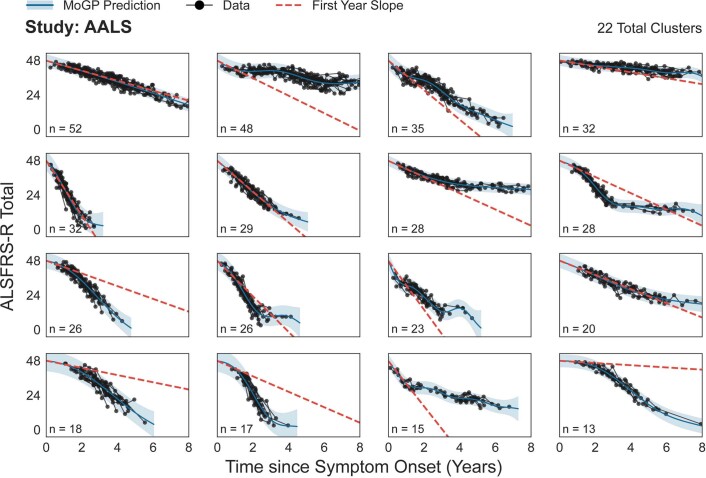
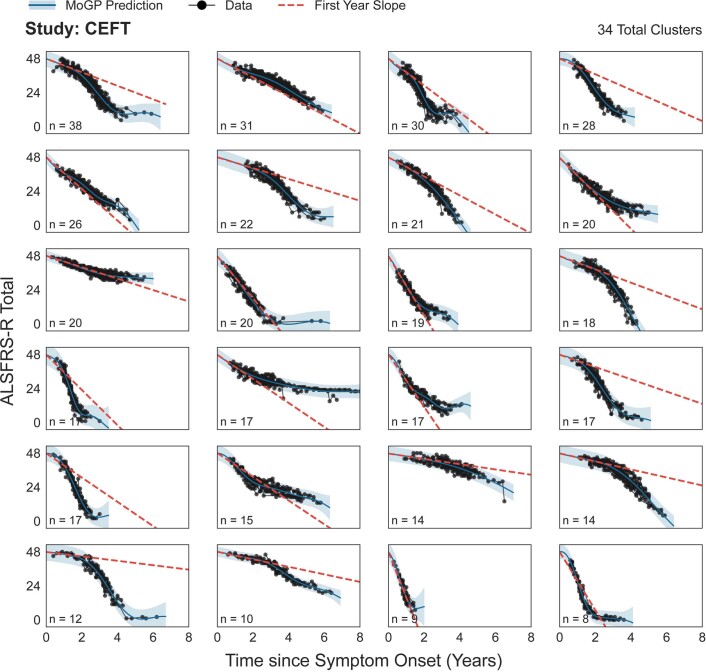
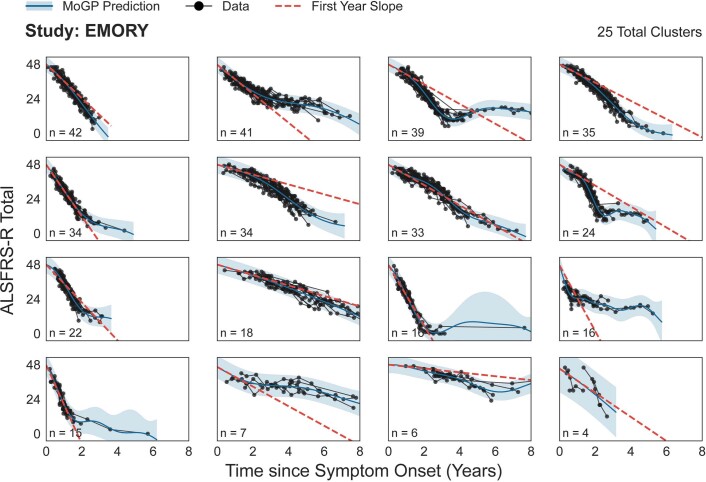
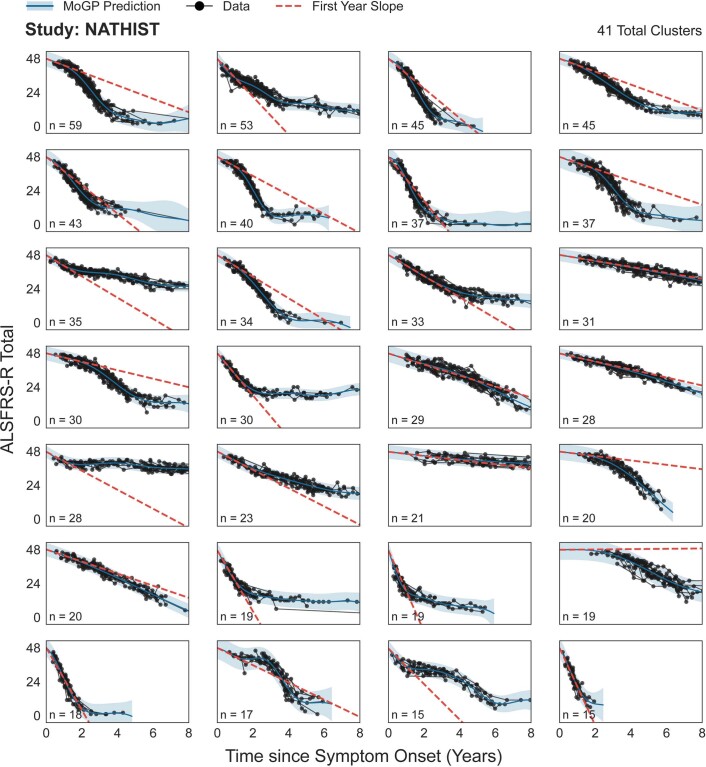
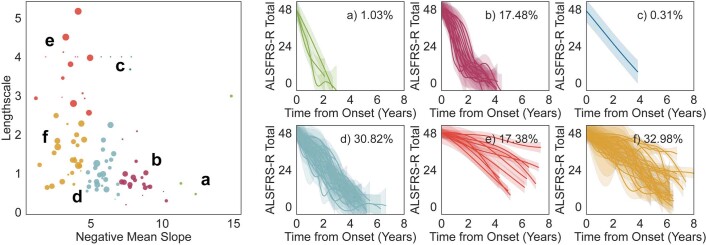
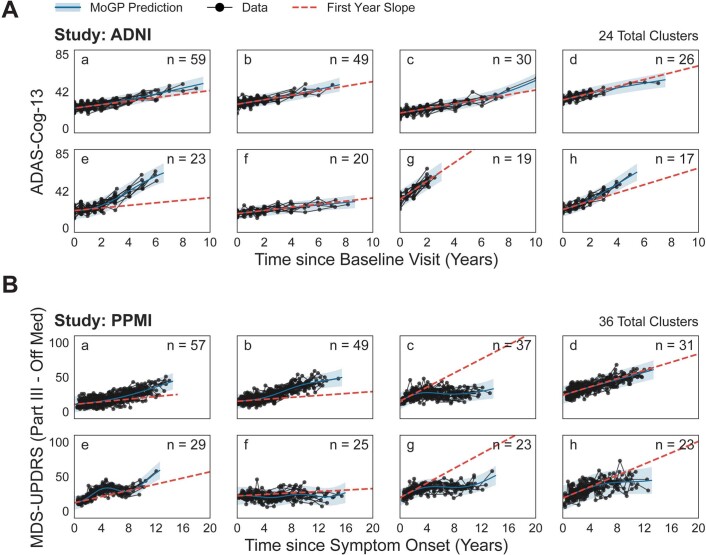
The clinical presentation of amyotrophic lateral sclerosis (ALS), a fatal neurodegenerative disease, varies widely across patients, making it challenging to determine if potential therapeutics slow progression. We sought to determine whether there were common patterns of disease progression that could aid in the design and analysis of clinical trials. We developed an approach based on a mixture of Gaussian processes to identify clusters of patients sharing similar disease progression patterns, modeling their average trajectories and the variability in each cluster. We show that ALS progression is frequently nonlinear, with periods of stable disease preceded or followed by rapid decline. We also show that our approach can be extended to Alzheimer's and Parkinson's diseases. Our results advance the characterization of disease progression of ALS and provide a flexible modeling approach that can be applied to other progressive diseases.


Conflict of interest statement

K.N., K. Severson and S.G. were employed by IBM Research during this project. K. Sachs consults for Modulo Bio Inc.

Figures

Fig. 1
Fig. 1. Identifying trajectory clusters with varying patterns of decline, using a mixture of Gaussian processes model.
The 24 largest clusters (out of 92) from PRO-ACT are shown. The first-year slope is calculated as the difference between 48 and the mean cluster score 1 yr after symptom onset, divided by the time from symptom onset. n indicates the number of ALS patients in each cluster. The shaded area indicates the 0.95 confidence interval.
Fig. 2
Fig. 2. Estimating nonlinearity of trajectories.
a, Cumulative distribution function (CDF) of root mean squared error (RMSE) between a participant’s predicted cluster membership and cluster model mean. P values calculated with two-sided Kolmogorov–Smirnov two-sample tests between MoGP and LKM distributions, and between MoGP and SM distributions. b, A subset of nonlinear clusters from PRO-ACT visualized; n indicates the number of ALS patients per cluster. The shaded area indicates the 0.95 confidence interval. Source data
Fig. 3
Fig. 3. Evaluating robustness of cluster assignments with sparse datasets.
a,c, MoGP, LKM and SM were trained on interpolated data and RMSE was calculated between withheld data and the mean predicted trajectory. b,d, Models were trained on right-censored data. P values were calculated with a Wilcoxon signed-rank one-sided test. The box plot represents the interquartile range around the mean; whiskers indicate the proportion (1.5) of the interquartile range past the low and high quartiles to extend the plot whiskers. Points outside the whisker range represent outlier samples. Number of patients evaluated: a, n = 1,327 patients for all comparisons; b, 0.25 yr, n = 2,786; 0.5 yr, n = 2,465; 1 yr, n = 1,379; 1.5 yr, n = 261; 2 yr, n = 135; c, n = 228 for all comparisons; d, 0.25 yr, n = 453; 0.5 yr, n = 437; 1 yr, n = 323; 1.5 yr, n = 215; 2 yr, n = 130. Source data
Fig. 4
Fig. 4. Assessing trajectory consistency across datasets.
a, The reference model was trained on PRO-ACT and used to predict progression trajectories of participants in other datasets; the four largest reference model clusters are shown. b, Average test error between cluster mean function and participant ALSFRS-R scores, using the reference model and study-specific models. P values were calculated with a Wilcoxon signed-rank one-sided test. The error bars show the 0.95 confidence interval around the mean. N = 5 test–train splits. Source data
Fig. 5
Fig. 5. Survival outcomes for trajectory clusters.
ak, The five largest PRO-ACT clusters are shown with MoGP clusters (ae) and associated Kaplan–Meier survival curves (fj). n indicates the number of ALS patients in each cluster. The shaded area indicates the 0.95 confidence interval. k, The number of individuals at risk, censored and with recorded deaths observed at each time displayed.
Fig. 6
Fig. 6. MoGP trajectory patterns for secondary endpoints of ALS disease progression.
Measures include a, forced vital capacity and b, ALSFRS-R subscores (fine motor, gross motor, bulbar, respiratory domains). Trajectory colors for each panel are unrelated and correspond to the relative number of participants in each cluster, scaled from the largest to the smallest of the five largest clusters from PRO-ACT. Participants with minimal change in score (≤1 point) were excluded from the model. n indicates the number of ALS patients in each cluster.
Extended Data Fig. 1
Extended Data Fig. 1. Model Workflow.
Input, training, and optimization of the Mixture of Gaussian Processes model.
Extended Data Fig. 2
Extended Data Fig. 2. Clusters spanning 90% of all individuals in PROACT.
The first year slope is calculated as the difference between 48 and the mean cluster score one year after symptom onset, divided by the time from symptom onset. N indicates the number of ALS patients in each cluster. Shaded area indicates 0.95 confidence interval.
Extended Data Fig. 3
Extended Data Fig. 3. Clusters spanning 90% of all individuals in AALS.
The first year slope is calculated as the difference between 48 and the mean cluster score one year after symptom onset, divided by the time from symptom onset. N indicates the number of ALS patients in each cluster. Shaded area indicates 0.95 confidence interval.
Extended Data Fig. 4
Extended Data Fig. 4. Clusters spanning 90% of all individuals in CEFT.
The first year slope is calculated as the difference between 48 and the mean cluster score one year after symptom onset, divided by the time from symptom onset. N indicates the number of ALS patients in each cluster. Shaded area indicates 0.95 confidence interval.
Extended Data Fig. 5
Extended Data Fig. 5. Clusters spanning 90% of all individuals in EMORY.
The first year slope is calculated as the difference between 48 and the mean cluster score one year after symptom onset, divided by the time from symptom onset. N indicates the number of ALS patients in each cluster. Shaded area indicates 0.95 confidence interval.
Extended Data Fig. 6
Extended Data Fig. 6. Clusters spanning 90% of all individuals in NATHIST.
The first year slope is calculated as the difference between 48 and the mean cluster score one year after symptom onset, divided by the time from symptom onset. N indicates the number of ALS patients in each cluster. Shaded area indicates 0.95 confidence interval.
Extended Data Fig. 7
Extended Data Fig. 7. Dominant ALS progression patterns, identified using length-scale and negative mean function slope.
Length-scale indicates trajectory stability; negative mean function slope corresponds to rate of progression. Learned model parameters from the PRO-ACT reference model are k-means clustered (Left plot; k=6, marker size corresponds to cluster size), with clusters ≥ N=5 visualized, and percentage of individuals that fall within each of the trajectory patterns are labeled (Right plots). Source data
Extended Data Fig. 8
Extended Data Fig. 8. Identifying progression clusters from Alzheimer’s and Parkinson’s clinical measures.
Eight largest clusters are visualized. N indicates number of individuals in each cluster. The first year slope is calculated as: (mean cluster at one year – mean cluster score at initial value), divided by the time from the initial value.

Similar articles

Cited by

References

    1. Brown RH, Al-Chalabi A. Amyotrophic lateral sclerosis. N. Engl. J. Med. 2017;377:162–172. doi: 10.1056/NEJMra1603471. - DOI - PubMed
    1. Mandrioli J, et al. Heterogeneity in ALSFRS-R decline and survival: a population-based study in Italy. Neurol Sci. 2015;36:2243–2252. doi: 10.1007/s10072-015-2343-6. - DOI - PubMed
    1. Traxinger K, Kelly C, Johnson BA, Lyles RH, Glass JD. Prognosis and epidemiology of amyotrophic lateral sclerosis. Neurol. Clin. Pract. 2013;3:313–320. doi: 10.1212/CPJ.0b013e3182a1b8ab. - DOI - PMC - PubMed
    1. Proudfoot M, Jones A, Talbot K, Al-Chalabi A, Turner MR. The ALSFRS as an outcome measure in therapeutic trials and its relationship to symptom onset. Amyotroph. Lateral Scler. Frontotemporal Degener. 2016;17:414–425. doi: 10.3109/21678421.2016.1140786. - DOI - PMC - PubMed
    1. Bedlack RS, et al. How common are ALS plateaus and reversals? Neurology. 2016;86:808–812. doi: 10.1212/WNL.0000000000002251. - DOI - PMC - PubMed

MeSH terms