. 2024 Jan;43(2):250-276.
doi: 10.1038/s44318-023-00018-9. Epub 2024 Jan 2.

Disease-associated polyalanine expansion mutations impair UBA6-dependent ubiquitination

Affiliations

Disease-associated polyalanine expansion mutations impair UBA6-dependent ubiquitination

Fatima Amer-Sarsour et al. EMBO J. 2024 Jan.

Abstract

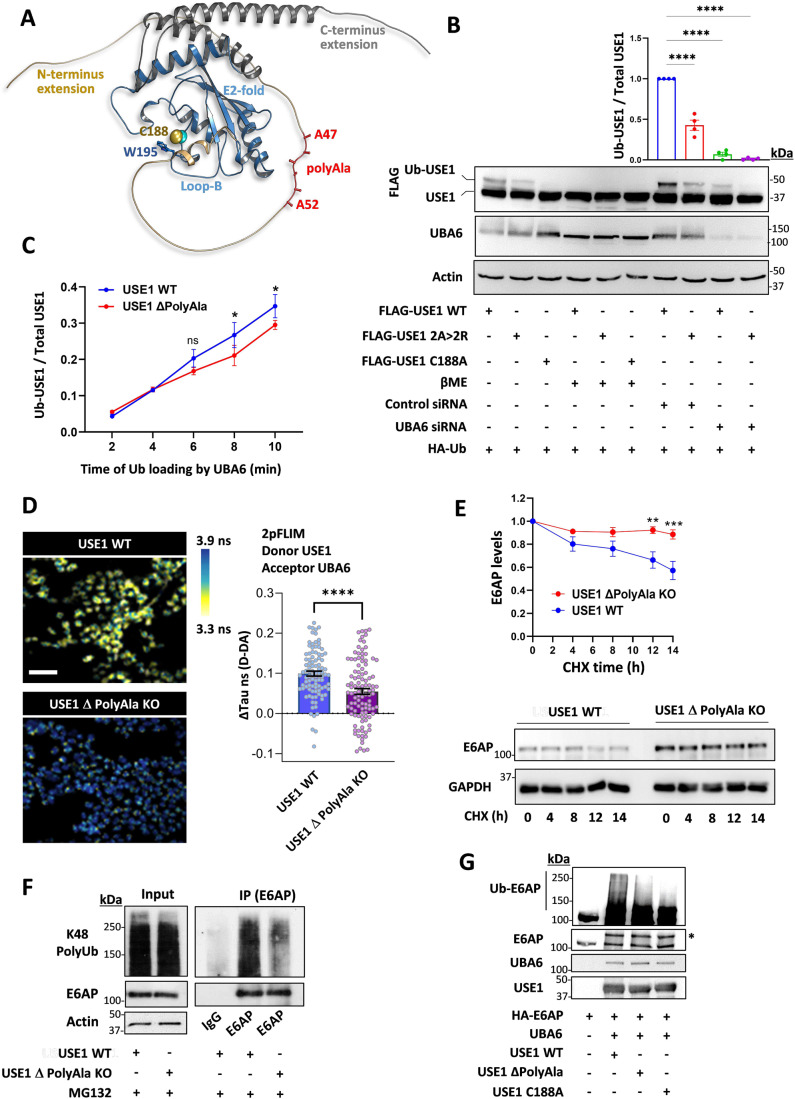
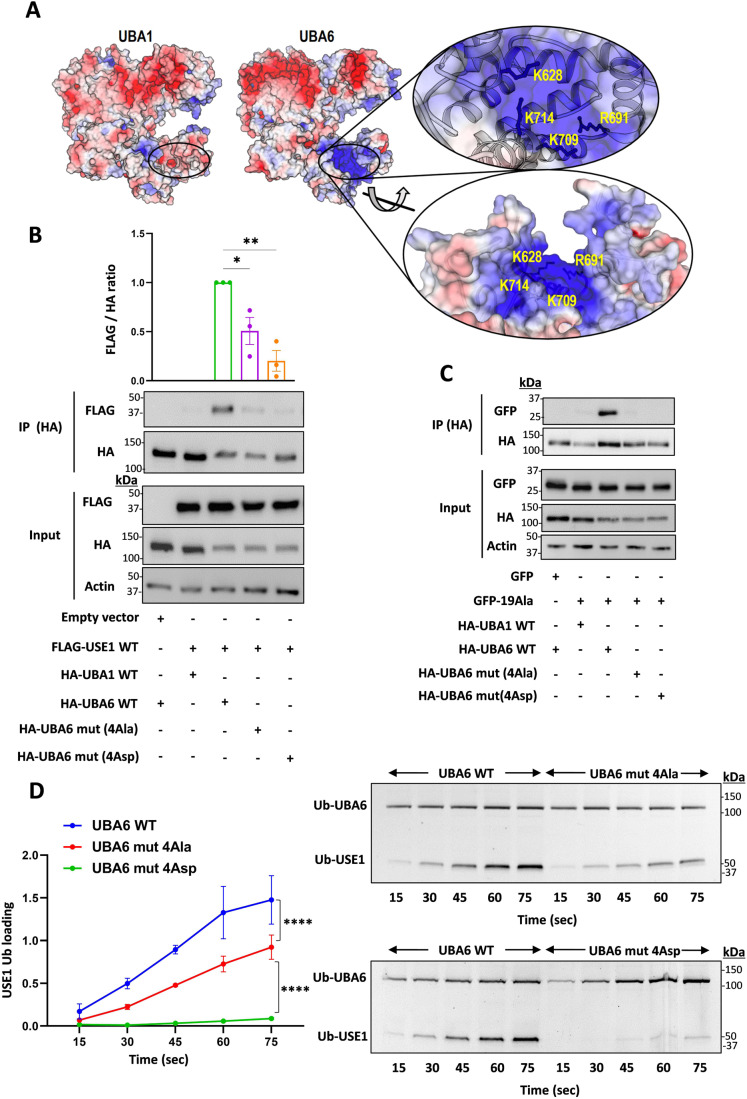
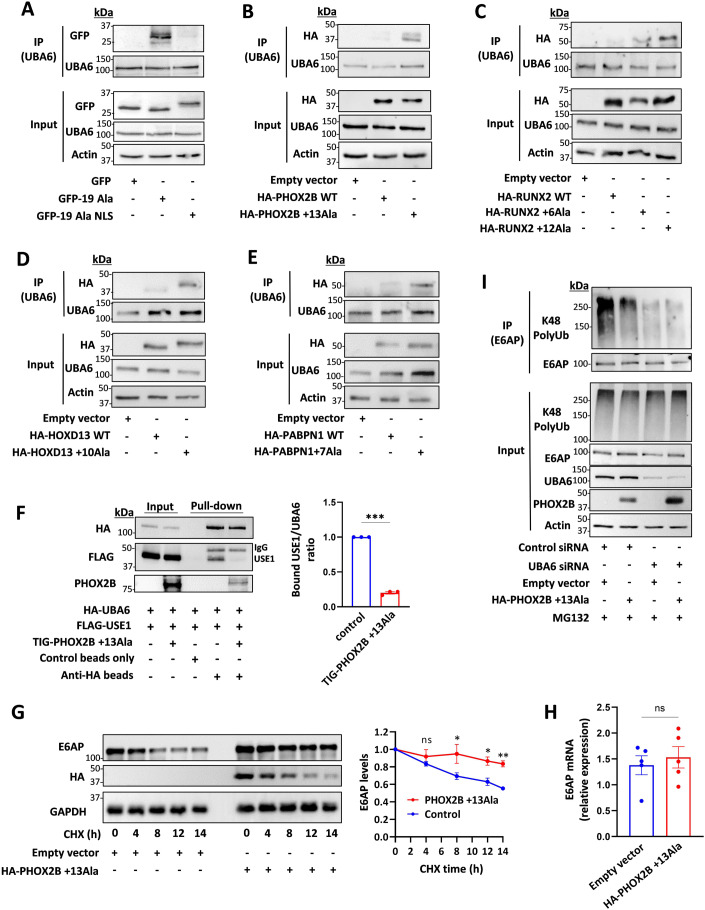
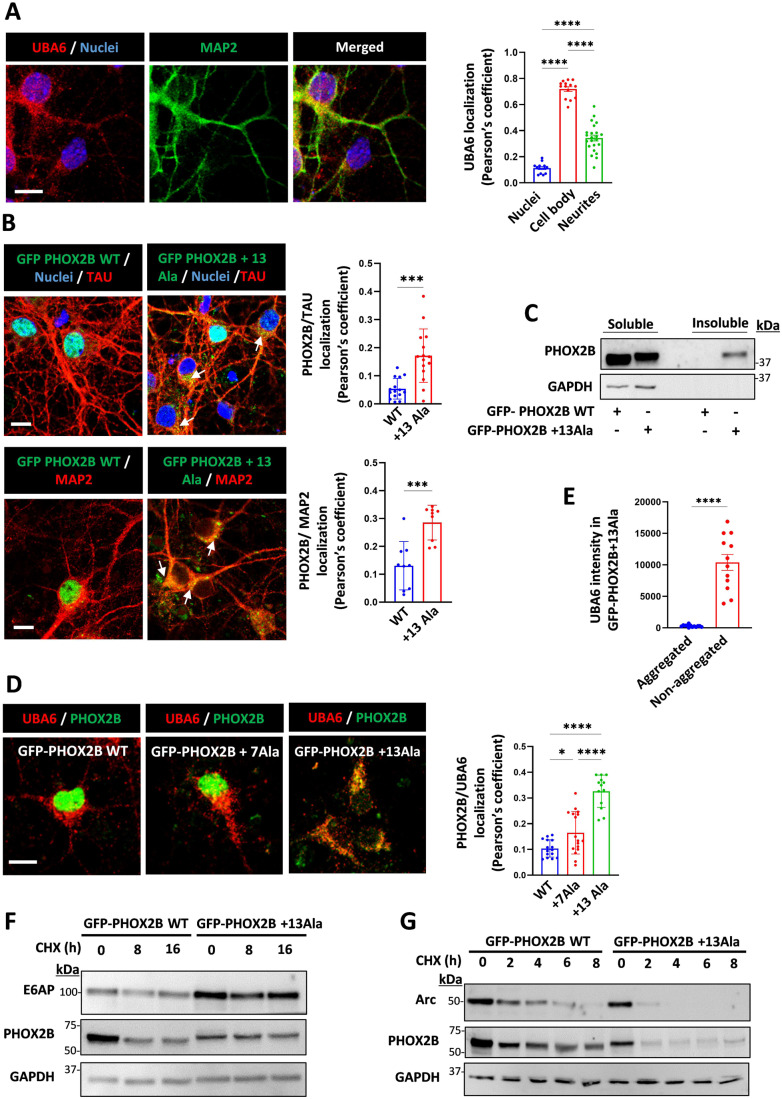
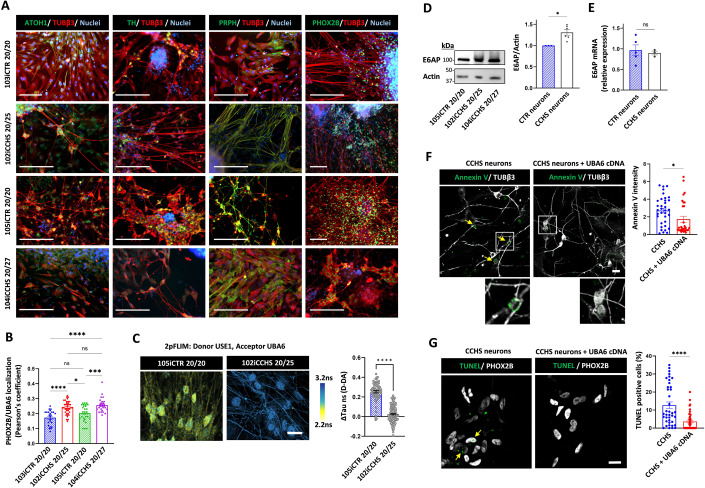
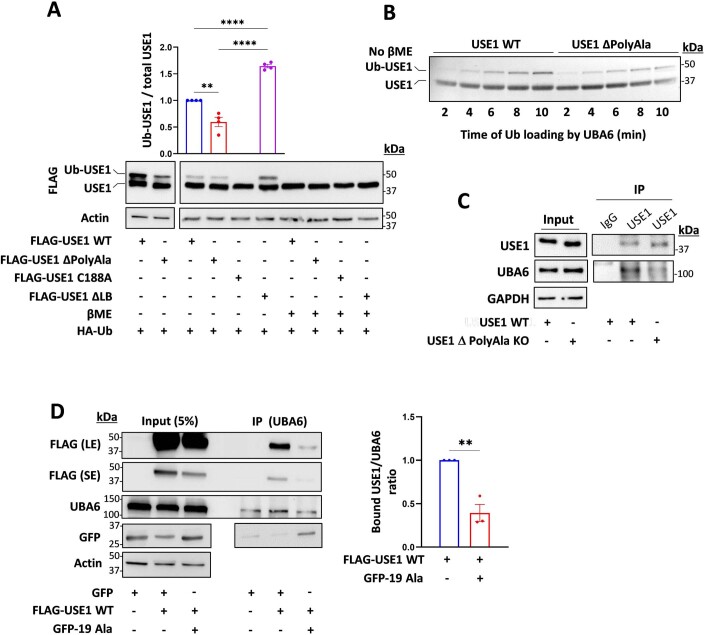
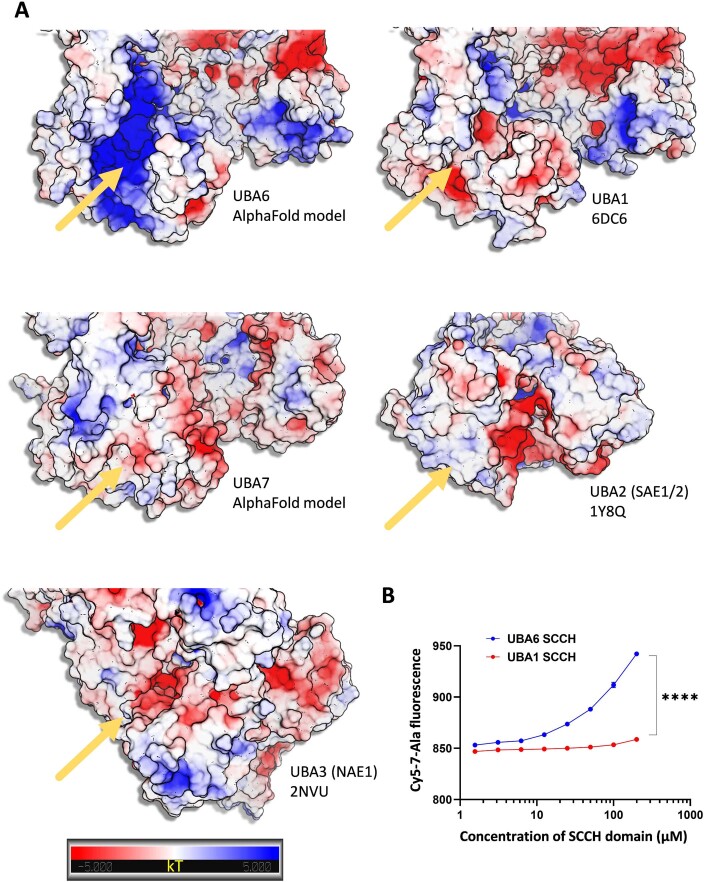
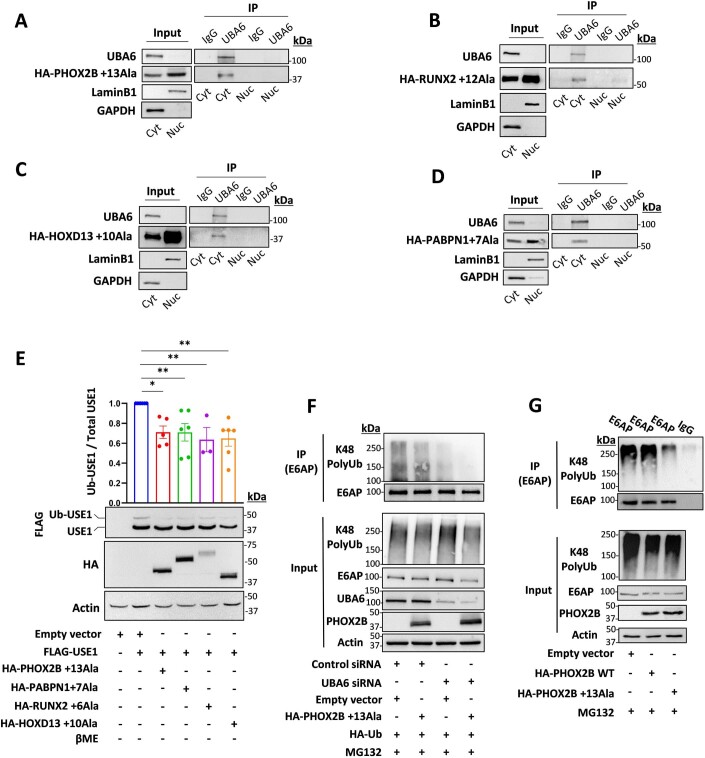
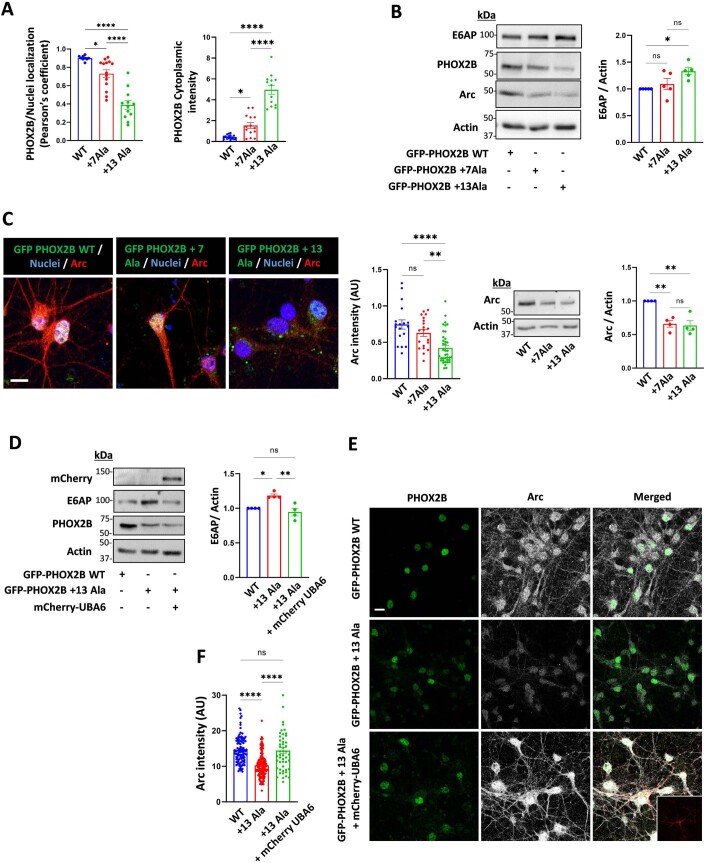
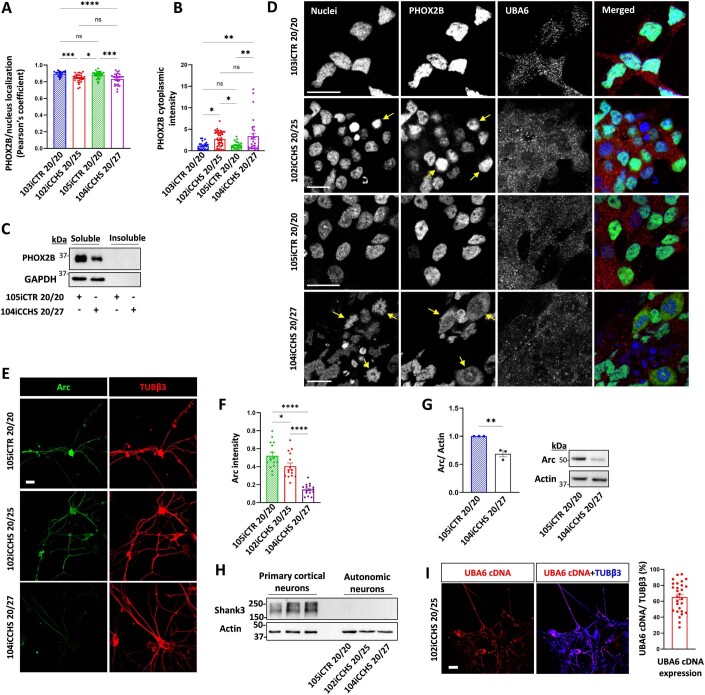
Expansion mutations in polyalanine stretches are associated with a growing number of diseases sharing a high degree of genotypic and phenotypic commonality. These similarities prompted us to query the normal function of physiological polyalanine stretches and to investigate whether a common molecular mechanism is involved in these diseases. Here, we show that UBA6, an E1 ubiquitin-activating enzyme, recognizes a polyalanine stretch within its cognate E2 ubiquitin-conjugating enzyme USE1. Aberrations in this polyalanine stretch reduce ubiquitin transfer to USE1 and, subsequently, polyubiquitination and degradation of its target, the ubiquitin ligase E6AP. Furthermore, we identify competition for the UBA6-USE1 interaction by various proteins with polyalanine expansion mutations in the disease state. The deleterious interactions of expanded polyalanine tract proteins with UBA6 in mouse primary neurons alter the levels and ubiquitination-dependent degradation of E6AP, which in turn affects the levels of the synaptic protein Arc. These effects are also observed in induced pluripotent stem cell-derived autonomic neurons from patients with polyalanine expansion mutations, where UBA6 overexpression increases neuronal resilience to cell death. Our results suggest a shared mechanism for such mutations that may contribute to the congenital malformations seen in polyalanine tract diseases.

Keywords: Autonomic Nervous System; Congenital Central Hypoventilation Syndrome; Trinucleotide Repeats; Ubiquitin Transfer System; Ubiquitin-Activating Enzyme.


Conflict of interest statement

The authors declare no competing interests.

Figures

Figure 1
Figure 1. A polyalanine stretch in USE1 regulates UBA6-USE1 ubiquitin transfer.
(A) Structure of the USE1 enzyme (PDB 5A4P) indicating the catalytic cysteine (Cys188), loop B (LB) with Trp195 masking Cys188, and model of the C-and N-terminal extensions including the alanine repeats (created by AlphaFold). (B) FLAG-wild type (WT) USE1, FLAG-USE1 mutant with aberrations in the polyalanine (2 A > 2 R), and FLAG-USE1 catalytic dead mutant (C188A) were co-expressed with HA-Ub in control or UBA6-depleted (Uba6 small inhibitory RNA, siRNA) HEK293T cells. Cell lysates were incubated with or without β mercaptoethanol (βME) and analyzed for ubiquitin loading. Results are normalized to control WT USE1. n = 4 biological replicates. (C) Time-dependent in vitro ubiquitin loading of WT and ΔPolyAla USE1 by UBA6. A Representative blot is shown in Figure EV1B. Quantification of USE1 ubiquitin loading is presented for n = 3 biological replicates. (D) Quantification of UBA6-USE1 interaction in WT and USE1 ΔPolyAla knockout (KO) HEK293T cells using FLIM-FRET. Representative 2pFLIM pseudo-colored images of WT cells and ΔPolyAla KO cells, stained for USE1 and UBA6 using secondary antibodies as donor (Alexa 488) and acceptor (Alexa 555), respectively. Scale bar is 200 µm. The comparison of the difference in lifetime (donor only to donor and acceptor lifetime) in nano seconds (ns) of WT and ΔPolyAla KO cells is shown (Control 0.099 ± 0.006, KO 0.055 ± 0.007) for n = 97 and 108 cells, respectively. (E) WT and ΔPolyAla KO cells were treated with cycloheximide (CHX) at the indicated times, and were analyzed for E6AP levels. Results are normalized to t = 0 for each type of cells. n = 4 biological replicates. (F) WT and ΔPolyAla KO cells were incubated for the last 6 h with the proteasome inhibitor MG132 (10 μM), and E6AP was immunoprecipitated from cell lysates for ubiquitination analysis (under reducing conditions with βME). (G) E6AP purified from HEK293T cells was incubated with bacterially produced UBA6, USE1 WT and USE1 mutants (ΔPolyAla and C188A) for an in vitro E6AP ubiquitination assay. E6AP ubiquitin conjugates (under reducing conditions with βME) was resolved by SDS-page (Asterisk (*) indicates the mono-ubiquitin conjugate). Data information: Data points in (BE) represent mean ± s.e.m. P values were calculated by One-way ANOVA Dunnett’s test (B), Two-way ANOVA Sidak’s test (C, E), Unpaired 2-tailed t test (D). *P < 0.05, **P < 0.01, ****P < 0.0001, ns non-significant. Source data are available online for this figure.
Figure 2
Figure 2. UBA6 interacts with polyalanine stretches.
(A) Electrostatic surface representation of the UBA6 structural model in comparison to UBA1. The location of key Arg and Lys residues forming the positively charged patch in UBA6 is presented. (B, C) HA-tagged constructs of WT UBA1, WT UBA6, and UBA6 mutants with Ala or Asp substitution mutations in Lys628, Arg691, Lys709, and Lys714 (UBA6 mut 4Ala or UBA6 mut 4Asp) were co-transfected with FLAG-USE1 (B) or empty GFP and GFP-polyAla (19Ala) (C) into HEK293T cells. Cell lysates were immunoprecipitated with anti-HA antibodies and the immunocomplexes were analyzed with anti-FLAG, anti-HA, and anti-GFP antibodies. (D) Representative gel of time-dependent in vitro ubiquitin loading of USE1 by WT UBA6, UBA6 mut 4Ala, and UBA6 mut 4Asp in the presence of fluorescein-labeled ubiquitin. Imaging of fluorescent ubiquitin conjugates was carried out with a laser scanner at 488 nm. Quantification of USE1 ubiquitin loading is presented. Data information: Data points in (BD) represent mean ± s.e.m. n = 3 biological replicates. P values were calculated by one-way ANOVA Dunnett’s test (B, C) or two-way ANOVA Tukey’s test (D). *P < 0.05, **P < 0.01, ****P < 0.0001. Source data are available online for this figure.
Figure 3
Figure 3. Polyalanine-expanded disease proteins interact with UBA6 and inhibit E6AP degradation.
(AE) HEK293T cells were transfected with the indicated constructs and immunoprecipitated for endogenous UBA6. (A) Empty GFP, and GFP-polyAla with or without a nuclear localization sequence (NLS). (B) WT and mutant PHOX2B (+13Ala). (C) WT and mutant RUNX2 (+6Ala and +12Ala). (D) WT and mutant HOXD13 (+10Ala). (E) WT and mutant PABPN1 (+7 Ala). (F) Cell lysates of HEK293T cells expressing HA-UBA6 and FLAG-USE1 were incubated with recombinant TIG-mutant PHOX2B. Anti-HA beads were used to pulldown UBA6 (beads only were used as control). The bound USE1/UBA6 ratio is shown. n = 3 biological replicates. (G) Cells were transfected with mutant PHOX2B or empty vector. The cells were treated with cycloheximide (CHX) at the indicated times, and were analyzed for E6AP levels. Results are normalized to t = 0. n = 3 biological replicates. (H) Quantification of E6AP mRNA in the cells transfected with empty vector or mutant PHOX2B. n = 5 biological replicates. (I) Control and UBA6-depleted HEK293T cells were transfected with mutant PHOX2B or empty vector and incubated for the last 6 h with the proteasome inhibitor MG132 (10 μM). Endogenous E6AP was immunoprecipitated from cell lysates for ubiquitination analysis. Data information: Data points in (FH) represent mean ± s.e.m. P values were calculated by paired 2-tailed t test (F), Two-way ANOVA Sidak’s test (G) and unpaired 2-tailed t test (H). *P < 0.05, **P < 0.01, ***P <0.001, ns non-significant. Source data are available online for this figure.
Figure 4
Figure 4. Cytoplasmic mutant PHOX2B interacts with UBA6 and alters the levels of E6AP and Arc in primary neurons.
(A) Mouse primary cortical neurons were labeled for endogenous UBA6 and MAP2. Scale bar 10 μm. Quantification of the association of UBA6 with the neuronal nucleus, cell body, and neurites is shown (Pearson’s coefficient). n = 50 neurons analyzed. (B) The neurons were transduced with lentiviral vectors expressing GFP-tagged WT PHOX2B or mutant PHOX2B (+13Ala), and were labeled for endogenous MAP2 and TAU (non-nuclear fraction of mutant PHOX2B marked with arrows). Scale bar 10 μm. The quantification presents the association of GFP-PHOX2B with MAP2 and TAU (Pearson’s coefficient). n = 30-50 neurons analyzed. (C) The PHOX2B transduced neurons (WT or +13Ala) were analyzed for the levels of PHOX2B in the soluble and sarkosyl-insoluble fractions. (D) The neurons were transduced with lentiviral vectors expressing GFP-tagged WT PHOX2B or mutant PHOX2B (+7 Ala and +13Ala) and were labeled for endogenous UBA6. The quantification of the association of GFP-PHOX2B with UBA6 (Pearson’s coefficient) is presented. Scale bar 10 μm. n = 30, n = 60, and n = 90 neurons analyzed for WT PHOX2B, mutant PHOX2B +7Ala and +13Ala, respectively. (E) Additional analysis of the images in Fig. 4D for the intensity of UBA6 in PHOX2B+13Ala aggregated or non-aggregated forms as detected by GFP fluorescence. n = 90 neurons analyzed. (F, G) The neurons were transduced with lentiviral vectors expressing GFP-WT PHOX2B or GFP-mutant PHOX2B +13Ala and were treated with cycloheximide (CHX) at the indicated times. Representative blots are presented for the levels of E6AP (F) and Arc (G). Data information: Data points in (A, B, D, E) represent mean ± s.e.m. P values were calculated by one–way ANOVA Tukey’s test (A, D), unpaired 2-tailed t test (B, E). *P < 0.05, ***P < 0.001, ****P < 0.0001. Source data are available online for this figure.
Figure 5
Figure 5. UBA6 overexpression rescues CCHS patient-derived autonomic neurons from neuronal death.
(A) Characterization of iPSC-derived autonomic neurons at day 31 of differentiation from healthy controls and CCHS patients. Immunocytochemistry of PHOX2B, βIII-tubulin (TUBβ3), tyrosine hydroxylase (TH) peripherin (PRPH), and atonal BHLH Transcription Factor 1 (ATOH1). Scale bar 200 μm. (B) Quantification of the association of endogenous UBA6 with endogenous PHOX2B (Pearson’s coefficient) in autonomic neurons from control and CCHS patients. Total number of neurons analyzed in different imaged fields was 160 for 103iCTR 20/20, 350 for 102iCCHS 20/25, 380 for 105iCTR 20/20 and 550 for 104iCCHS 20/27. Images are shown in Figure EV5D. (C) Representative 2pFLIM pseudo-colored images of control and CCHS patient-derived neurons, stained for USE1 and UBA6 using secondary antibodies as donor (Alexa 488) and acceptor (Alexa 555), respectively. Scale bar is 20 µm. Comparison of the difference in lifetime for each group, for the subtraction of donor only to donor and acceptor fluorescence lifetime. Control neurons 0.253 ± 0.012, patient neurons 0.025 ± 0.007 (n = 67 and 153 cells, respectively). (D) Analysis of E6AP levels in control (105iCTR 20/20) and CCHS patients (102iCCHS 20/25 and 104iCCHS 20/27). Results are normalized to control. n = 3–6 biological replicates. (E) Quantification of E6AP mRNA in the control and patient-derived autonomic neurons. n = 3–5 biological replicates. (F, G) Patient-derived autonomic neurons (102iCCHS 20/25) were transduced with mCherry-UBA6 cDNA lentiviral vectors. (F) Representative images of Annexin V signal (colored green and marked with arrows) of the transduced and non-transduced patient neurons. Scale bar 20 μm. Quantification of cell surface Annexin V intensity in different image fields (transduced n = 80 cells, non-transduced n = 92). (G) Representative images of TUNEL staining (colored green marked with arrows) of the transduced and non-transduced patient neurons. The percentage of the TUNEL positive PHOX2B expressing cells is shown. At least 1000 PHOX2B expressing cells were analyzed. Data information: Data points in (BG) represent mean ± s.e.m. P values were calculated by one-way ANOVA Tukey’s test (B), unpaired 2-tailed t test (C, EG) and paired 2-tailed t test (D). *P < 0.05, ***P < 0.001, ****P < 0.0001, ns non-significant. Source data are available online for this figure.
Figure EV1
Figure EV1. Polyalanine stretches regulate UBA6-USE1 interaction and ubiquitin transfer.
(A) FLAG-WT USE1, FLAG-USE1 ΔPolyAla, FLAG-USE1 C188A, and FLAG-USE1 ΔLB were co-expressed with HA-Ub in HEK293T cells. Cell lysates were incubated with or without β mercaptoethanol (βME) and analyzed for ubiquitin loading. Results are normalized to control WT USE1. n = 4 biological replicates. (B) A representative blot for time-dependent in vitro ubiquitin loading of WT and ΔPolyAla USE1 by UBA6 (quantification is presented in Fig. 1C). (C) WT and ΔPolyAla KO cells were treated with the cross-linker formaldehyde and cell lysates were immunoprecipitated with anti-USE1 or control IgG antibodies. Immunocomplexes were analyzed with anti-USE1 and anti-UBA6 antibodies. (D) FLAG-WT USE1, empty GFP and GFP-polyAla (19Ala) constructs were transfected into HEK293T cells. Cell lysates were immunoprecipitated with anti-UBA6 antibodies and the immunocomplexes were analyzed with anti-FLAG, anti-UBA6 and anti-GFP antibodies. The bound USE1/UBA6 ratio is shown. n = 3 biological replicates. Data information: Data points in (A, D) represent mean ± s.e.m. P values were calculated by one-way ANOVA Tukey’s test (A) or paired 2-tailed t test (D). **P< 0.01, ****P < 0.0001. Source data are available online for this figure.
Figure EV2
Figure EV2. Biophysical analysis of the interaction between a polyalanine peptide and the SCCH domains of the canonical E1 ubiquitin-like activating enzymes.
(A) AlphaFold models of UBA6 and UBA7 and the crystal structures of UBA1, UBA2 and UBA3 are shown. The structures were aligned and electrostatic potential was calculated as described in the methods. The yellow arrows indicate the location of the groove within the SCCH domains. UBA6, UBA1 and UBA7 form an extended lobe within the SCCH, which is missing in UBA2 and UBA3. The groove in UBA7 is covered and do not exist in UBA2 and UBA3. The grooves in UBA1 and UBA6 are highly similar in terms of structure but present significantly different electro potential surfaces. The gradient from negative (red) to positive (blue) charge is shown. The figure was prepared by PyMol. (B) Microscale thermophoresis interaction analysis of cy5-7Ala-peptide against UBA6 or UBA1 SCCH domain. The dose-response curve of cy5-7Ala-peptide titrated against increasing concentrations of the SCCH domain is presented. Results are mean ± s.e.m. n = 4 biological replicates, Two-way ANOVA, Sidak’s test. ****P < 0.0001.
Figure EV3
Figure EV3. Cytoplasmic polyalanine-expanded disease proteins interact with UBA6 and decrease USE1 ubiquitin loading and E6AP polyubiquitination.
(AD) HEK293T cells were transfected with the indicated constructs: (A) HA-mutant PHOX2B (+13Ala). (B) HA-mutant RUNX2 (+12Ala). (C) HA-mutant HOXD13 (+10Ala). (D) HA-mutant PABPN1 ( + 7 Ala). Endogenous UBA6 was immunoprecipitated from the nuclear fraction (Nuc, LaminB1 enriched) or the cytoplasmic (Cyt, GAPDH enriched) fraction (unrelated IgG was used as a control). The immunocomplexes were analyzed with anti-HA antibodies. (E) HEK293T cells were transfected with constructs expressing different polyalanine-expanded disease proteins (mutant PHOX2B, mutant RUNX2, mutant HOXD13, and mutant PABPN1) together with FLAG-USE1. Cell lysates were incubated without β mercaptoethanol and analyzed for ubiquitin loading. Results are mean ± s.e.m. normalized to control (empty vector, no disease protein). Paired 2-tailed t test. n = 3–6 biological replicates. (F) Control and UBA6-depleted HEK293T cells were transfected with HA-Ub, mutant PHOX2B or empty vector and incubated for the last 6 h with the proteasome inhibitor MG132 (10 μM). Endogenous E6AP was immunoprecipitated from cell lysates for ubiquitination analysis. (G) HEK293T cells were transfected with WT PHOX2B, mutant PHOX2B or empty vector and incubated for the last 6 h with the proteasome inhibitor MG132 (10 μM). Endogenous E6AP was immunoprecipitated from cell lysates for ubiquitination analysis (unrelated IgG was used as a control). ns non-significant, *P < 0.05, **P < 0.01.
Figure EV4
Figure EV4. UBA6 overexpression affects E6AP and Arc levels in mutant PHOX2B transduced neurons.
(AC) Mouse primary cortical neurons were transduced with lentiviral vectors expressing GFP-tagged WT PHOX2B or mutant PHOX2B (+7Ala or +13Ala). (A) Quantification of the association of GFP-PHOX2B with the nucleus (Pearson’s coefficient) is presented as well as GFP-PHOX2B cytoplasmic intensity, related to Fig. 4C. (B) Analysis of E6AP and Arc levels in the WT and mutant PHOX2B-expressing neurons (n = 5 and n = 4 biological replicates, respectively). (C) Quantification of Arc intensity in the GFP-PHOX2B expressing neurons is presented (image scale bar 10 μm) as well as a blot showing Arc protein levels. Results represent the average values from neurons in different imaged fields. n = 20, n = 30 and n = 100 neurons analyzed for WT PHOX2B, mutant PHOX2B +7Ala and +13Ala, respectively. (DF) The neurons were transduced with lentiviral vectors expressing GFP-WT PHOX2B, GFP-mutant PHOX2B (+13Ala) with or without lentiviruses encoding for mCherry-UBA6. (D), E6AP levels were analyzed in cell lysates. Results are normalized to WT PHOX2B. n = 4 biological replicates. (E, F) Quantification of Arc intensity in cycloheximide-treated GFP-PHOX2B expressing neurons that were positive or negative to mCherry. n = 110, n = 150 and n = 50 neuronal cell bodies analyzed for WT PHOX2B, mutant PHOX2B and mutant PHOX2B + UBA6, respectively. Inset shows mCherry signal. Scale bar 10 μm. AU arbitrary units. Data information: Data points in (AD, F) represent mean ± s.e.m. P values were calculated by one-way ANOVA Tukey’s test (AD, F). *P < 0.05, **P < 0.01, ****P < 0.0001, ns non-significant.
Figure EV5
Figure EV5. Patient-derived autonomic neurons showing cytoplasmic mislocalized soluble PHOX2B, and decreased Arc levels.
(A, B) Quantification of the association of endogenous PHOX2B with the nucleus (Pearson’s coefficient) in autonomic neurons from control and CCHS patients. Quantification is shown also for PHOX2B cytoplasmic intensity. Total number of neurons analyzed was 160 for 103iCTR 20/20, 350 for 102iCCHS 20/25, 380 for 105iCTR 20/20 and 550 for 104iCCHS 20/27. The results represent additional analysis from the same neurons analyzed in Fig. 5B. (C) Autonomic neurons from control and CCHS patients were analyzed for the levels of PHOX2B in the soluble and sarkosyl-insoluble fractions. (D) iPSC-derived human autonomic neurons from control and CCHS patients were labeled by nuclear staining (colored blue, abnormal nuclear morphology marked with arrows), and for endogenous PHOX2B (colored green) and endogenous UBA6 (colored red). Images indicate events of severe cytoplasmic mislocalization of PHOX2B (marked with arrows). Scale bar 10 μm. (E, F) Immunostaining of Arc (colored green) and TUBβ3 (colored red) in autonomic neurons from control and CCHS patients. Scale bar 20μm. For quantification, Arc intensity was normalized to TUBβ3 in different image fields. Number of neurons analyzed 105iCTR 20/20 n = 105, 102iCCHS 20/25 n = 220, 104iCCHS 20/27 n = 166. (G) Analysis of Arc levels in the autonomic neurons from control and CCHS patient-derived neurons. Results are normalized to control line. n = 3 biological replicates. (H) Analysis of shank3 levels in mouse primary cortical neurons and in autonomic neurons from control and CCHS patients. (I) Quantification of the abundance of UBA6 cDNA in CCHS patient-derived neurons transduced with mCherry tagged-UBA6 lentiviral vectors. Representative images are presented for mCherry (colored red) and TUBβ3 staining (colored blue) in the patient neurons (scale bar 20 μm). For quantification, the percentage of mCherry coverage from the TUBβ3 staining was calculated in different image fields (n = 80 neurons). Data information: Data points in (A, B, F, G, I) represent mean ± s.e.m. P values were calculated by one-way ANOVA Tukey’s test (A, B, F) or paired 2-tailed t test (G). *P < 0.05, **P < 0.01, ***P < 0.001 ****P < 0.0001, ns non-significant.

References

    1. Aichem A, Pelzer C, Lukasiak S, Kalveram B, Sheppard PW, Rani N, Schmidtke G, Groettrup M. USE1 is a bispecific conjugating enzyme for ubiquitin and FAT10, which FAT10ylates itself in cis. Nat Commun. 2010;1:13. doi: 10.1038/ncomms1012. - DOI - PubMed
    1. Akimoto G, Fernandes AP, Bode JW. Site-specific protein ubiquitylation using an engineered, chimeric E1 activating enzyme and E2 SUMO conjugating enzyme Ubc9. ACS Cent Sci. 2022;8:275–281. doi: 10.1021/acscentsci.1c01490. - DOI - PMC - PubMed
    1. Albrecht A, Mundlos S. The other trinucleotide repeat: polyalanine expansion disorders. Curr Opin Genet Dev. 2005;15:285–293. doi: 10.1016/j.gde.2005.04.003. - DOI - PubMed
    1. Amer-Sarsour F, Kordonsky A, Berdichevsky Y, Prag G, Ashkenazi A. Deubiquitylating enzymes in neuronal health and disease. Cell Death Dis. 2021;12:120. doi: 10.1038/s41419-020-03361-5. - DOI - PMC - PubMed
    1. Amiel J, Laudier B, Attie-Bitach T, Trang H, de Pontual L, Gener B, Trochet D, Etchevers H, Ray P, Simonneau M, et al. Polyalanine expansion and frameshift mutations of the paired-like homeobox gene PHOX2B in congenital central hypoventilation syndrome. Nat Genet. 2003;33:459–461. doi: 10.1038/ng1130. - DOI - PubMed