. 2024 Jan;16(1):40-63.
doi: 10.1038/s44321-023-00004-y. Epub 2023 Dec 14.

Highly secreted tryptophanyl tRNA synthetase 1 as a potential theranostic target for hypercytokinemic severe sepsis

Affiliations

Highly secreted tryptophanyl tRNA synthetase 1 as a potential theranostic target for hypercytokinemic severe sepsis

Yoon Tae Kim et al. EMBO Mol Med. 2024 Jan.

Erratum in

Abstract

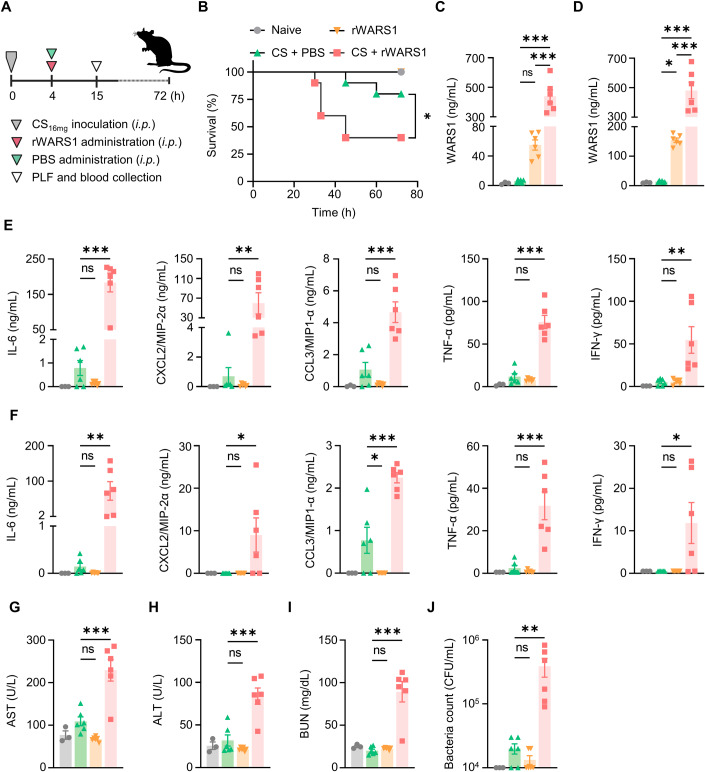
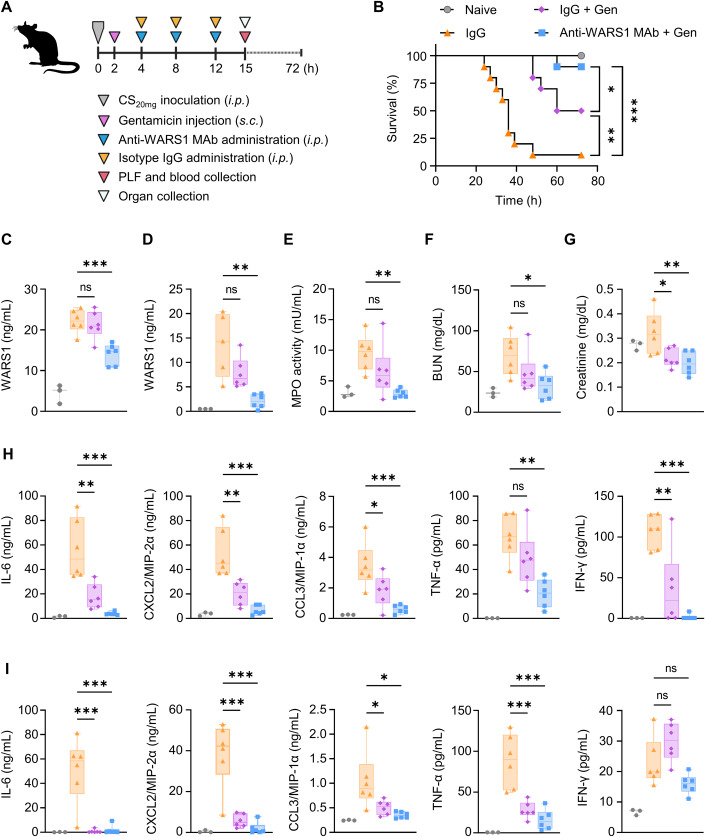
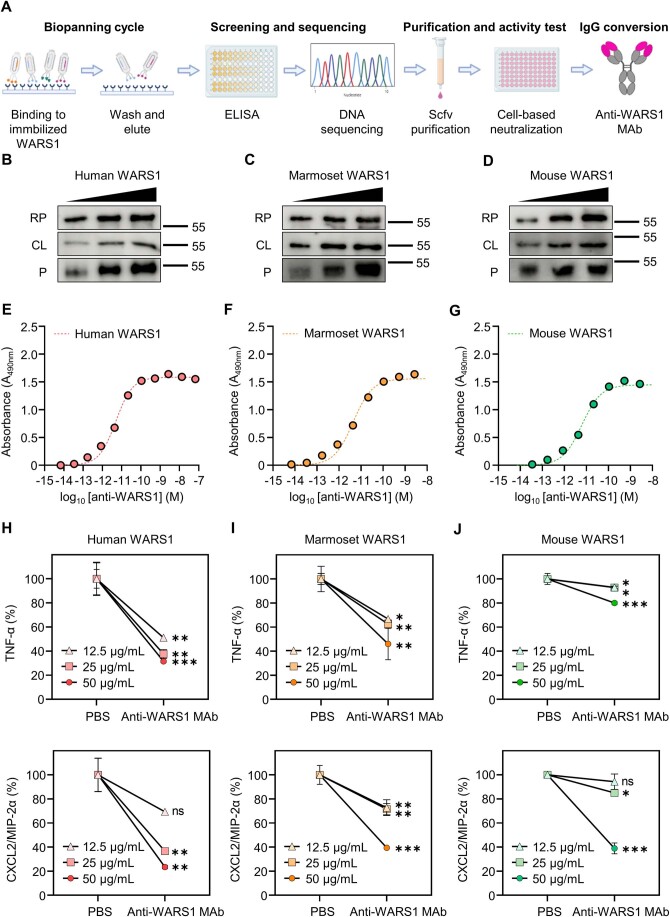
Despite intensive clinical and scientific efforts, the mortality rate of sepsis remains high due to the lack of precise biomarkers for patient stratification and therapeutic guidance. Secreted human tryptophanyl-tRNA synthetase 1 (WARS1), an endogenous ligand for Toll-like receptor (TLR) 2 and TLR4 against infection, activates the genes that signify the hyperinflammatory sepsis phenotype. High plasma WARS1 levels stratified the early death of critically ill patients with sepsis, along with elevated levels of cytokines, chemokines, and lactate, as well as increased numbers of absolute neutrophils and monocytes, and higher Sequential Organ Failure Assessment (SOFA) scores. These symptoms were recapitulated in severely ill septic mice with hypercytokinemia. Further, injection of WARS1 into mildly septic mice worsened morbidity and mortality. We created an anti-human WARS1-neutralizing antibody that suppresses proinflammatory cytokine expression in marmosets with endotoxemia. Administration of this antibody into severe septic mice attenuated cytokine storm, organ failure, and early mortality. With antibiotics, the antibody almost completely prevented fatalities. These data imply that blood-circulating WARS1-guided anti-WARS1 therapy may provide a novel theranostic strategy for life-threatening systemic hyperinflammatory sepsis.

Keywords: Anti-WARS1 Antibody; Hypercytokinemia; Sepsis; Theranostics; Tryptophanyl-tRNA Synthetase (WARS1).


Conflict of interest statement

MJ is the founder and a shareholder of MirimGENE Co., Ltd., Incheon, South Korea. The other authors declare no competing interests.

Figures

Figure 1
Figure 1. Elevated WARS1 levels correlate with inflammation, shock, organ damage, and mortality in critically ill patients with sepsis.
(A) Plasma levels of WARS1 (log10 scale) in healthy controls (n = 54), ICU-controls (n = 30), patients with sepsis (n = 100), and patients with septic shock (n = 89). (B) Plasma levels of WARS1 (log10 scale) between survivors (n = 109) and non-survivors (n = 80). (C) Kaplan–Meier survival plots of the 28-day mortality by optimal cut-off levels of WARS1 (stratified at 106.3 ng/mL). Each line indicates the survival probability over follow-up time with shaded error bands. HR hazard ratio. (D) Correlation between WARS1 levels and cytokine and chemokine levels in the WARS1high (n = 57) group (stratified above 106.3 ng/mL). Individual correlation results are reported with linear regression lines. (EH) Absolute neutrophil count (E), absolute monocyte count (F), lactate levels (G), and total SOFA score (H) in the WARS1low (n = 128–130) vs. WARS1high (n = 58–59) groups. Data information: Data are presented as median with 95% confidence interval (A, B, EH). Statistical analysis is performed with Kruskal–Wallis test (A), Mann–Whitney U-test (B, EH), log-rank test (C), and Pearson’s correlation coefficient test (D). *p < 0.05, **p < 0.01, ***p < 0.001. Source data are available online for this figure.
Figure 2
Figure 2. WARS1high levels are hallmarks of hyperinflammation, organ damage, and mortality in sepsis mouse model.
(A) Kaplan–Meier survival plots for mice inoculated with CS at different doses of 16–20 mg (n = 30 per group). (B) Release kinetics of plasma WARS1 in sepsis mice with CS16–20mg (n = 2–4 per group). Data are presented as mean ± SEM. Naïve vs. CS16mg, $$p < 0.01, $$$p < 0.001; Naïve vs. CS18mg, #p < 0.05, ###p < 0.001; Naïve vs. CS20mg, ***p < 0.001. (C) Plasma WARS1 levels at 9 and 15 h after CS18mg inoculation (n = 60). Each line indicates a connection of individual symbols between the two times. (D) Correlation between WARS1 levels and survival time in CS18mg-inoculated mice (n = 60). Individual correlation results are reported with linear regression lines. (E) Kaplan–Meier survival plots of WARS1low vs. WARS1high groups (stratified at 17.49 ng/mL) 15 h after CS18mg inoculation (n = 30 per group). (FJ) Levels of cytokine and chemokine (F), AST (G), ALT (H), BUN (I), and blood bacterial CFU (J) at 9 h after CS inoculation in the WARS1low vs. WARS1high groups (n = 25–30 per group). Data information: Data are presented as median with a 95% confidence interval (FJ). Statistical analysis is performed with log-rank test (A, E), ANOVA with Bonferroni corrections (B), Mann–Whitney U-test (C, FJ), and Pearson’s correlation coefficient test (D). ns, not significant; *p < 0.05, **p < 0.01, ***p < 0.001. Source data are available online for this figure.
Figure 3
Figure 3. WARS1 activated transcriptomic profiling designates hyperinflammatory sepsis gene expression in hPBMCs.
(A) Volcano plot depicting significantly up-regulated (red) or down-regulated (blue) genes (|log2 fold change| ≥ 5, false discovery rate (FDR) <0.01) from hFL-WARS1 (50 nM) treated hPBMCs compared with controls. |log2 fold change| ≤ 5 genes are shown in black, and FDR >0.01 genes fall under the gray dashed line. (B, C) Heat map showing selected upregulated genes in hPBMCs treated with hFL-WARS1 compared with controls, divided into cytokines (B) and chemokines (C), respectively. TPM, transcripts per million. (D, E) Functional annotations of cellular components (D) and biological processes (E) from hFL-WARS1-derived upregulated genes using database for annotation, visualization and integrated discovery (DAVID)-GO analysis tool. (F, G) Signaling pathway of GSEA (F) and IPA (G) from hFL-WARS1-derived upregulated genes. NES, normalized enrichment score. (H) Upstream transcription factors activated by hFL-WARS1 using TRRUST analysis tool. (I) Signaling pathway based on transcription factors activated by hFL-WARS1 using STRING analysis tool. Data information: The color and size of the dots represent the scale score and expression ratio of each value, respectively (A, DG). Statistical analysis is performed with Student’s t test (A, F), and Fisher’s exact test (D, E, G). Source data are available online for this figure.
Figure 4
Figure 4. WARS1 administration exacerbates cytokine and chemokine production, organ damages, and mortality in septic mice.
(A) Experimental scheme of CS16mg inoculated mild septic mouse model. (B) Kaplan–Meier survival plot for mice administered with PBS or rWARS1 (20 mg/kg) after CS16mg inoculation, naive mice were administered with PBS (n = 10 per group). (C, D) WARS1 levels in PLF (C) and plasma (D) at 15 h after CS inoculation (n = 3–6 per group). (E, F) Levels of cytokine and chemokine in PLF (E) and plasma (F) at 15 h after CS inoculation (n = 3–6 per group). (GJ) Serum levels of AST (G), ALT (H), BUN (I), and blood bacterial CFU (J) at 15 h after CS inoculation (n = 3–6 per group). Data information: Data are presented as mean ± SEM (CJ). Statistical analysis is performed with log-rank test (B), and ANOVA with Bonferroni corrections (CJ). ns, not significant; *p < 0.05, **p < 0.01, ***p < 0.001. Source data are available online for this figure.
Figure 5
Figure 5. Anti-WARS1 monoclonal antibody administration suppresses proinflammatory cytokine gene expressions in LPS-injected marmosets.
(A) Experimental scheme of the LPS (100 μg/kg) injected marmoset endotoxemia model. (B) Plasma WARS1 levels at indicated time points after LPS injection (n = 5 per group). (CE) Gene expression of cytokine and chemokine in whole blood of marmosets at indicated time points after LPS injection (n = 4–5 per group). (FH) Plasma levels of cytokine and chemokine at indicated time points after LPS injection (n = 3–5 per group). Data information: Data are presented as mean ± SEM. Statistical analysis is performed with ANOVA with Bonferroni corrections (BH). *p < 0.05, **p < 0.01, ***p < 0.001. Source data are available online for this figure.
Figure 6
Figure 6. WARS1 neutralization suppresses excessive inflammation and premature deaths in severely ill septic mice.
(A) Experimental scheme for CS20mg inoculated severe septic mouse model. (B) Kaplan-Meier survival plot for mice administered with control IgG or monoclonal anti-WARS1 antibody (10 mg/kg) after CS20mg inoculation, naïve mice were administered with PBS (n = 20 per group). The survival rate experiments to determine the efficacy of anti-WARS1 MAb were repeated two to three times. (C, D) Levels of WARS1 (C), cytokine and chemokine (D) in PLF at the indicated time points (n = 5–6 per group). (E, F) Levels of WARS1 (E), cytokine and chemokine (F) in plasma at indicated time points (n = 3–6 per group). Data information: Data are presented as mean ± SEM. Statistical analysis is performed with log-rank test (B), and ANOVA with Bonferroni corrections (CF). *p < 0.05, **p < 0.01, ***p < 0.001. Source data are available online for this figure.
Figure 7
Figure 7. WARS1 neutralization prevents organ damages in severely ill septic mice.
(A) Representative images of H&E-stained lung sections at 15 h after CS inoculation (magnification, 200×; scale bars, 100 μm). Arrows indicate areas of inflammation. (B) Representative images of IF-stained lung sections at 15 h after CS inoculation. Nuclei stained with DAPI (blue); MPO with Alexa Fluor 647 (red); neutrophils with Ly6G and Alexa Fluor 488 (green), (magnification, ×200; scale bars, 50 μm). (C) MPO activity in lung homogenates at 15 h after CS inoculation (n = 6 per group). (D) Gene expression of CCL and CXCL chemokine in lung homogenates at 15 h after CS inoculation (n = 6 per group). (E, F) Representative images of H&E-stained liver (E) and kidney (F) sections at 15 h after CS inoculation (magnification, ×200; scale bars, 100 μm). Arrows indicate areas of inflammation. (GJ) Serum levels of AST (G), ALT (H), BUN (I), and blood bacterial CFU (J) at 15 h after CS inoculation (n = 6 per group). Data information: Data are presented as mean ± SEM. Statistical analysis is performed with ANOVA with Bonferroni corrections (C, D, GJ). ns, not significant; *p < 0.05, **p < 0.01, ***p < 0.001. Source data are available online for this figure.
Figure 8
Figure 8. WARS1 neutralization in combined with antibiotics protects severely ill septic mice from fatality.
(A) Experimental scheme for the co-administration of antibiotics in a CS20mg inoculated severe septic mouse model. (B) Kaplan–Meier survival plot for mice administered with antibiotics (3 mg/kg) and control IgG or monoclonal anti-WARS1 antibody (10 mg/kg) after CS20mg inoculation, naïve mice were administered with PBS (n = 10 per group). The survival rate experiments to determine the efficacy of anti-WARS1 MAb with antibiotics were repeated two to three times. (C, D) WARS1 levels in PLF (C) and plasma (D) at 15 h after CS inoculation (n = 5–6 per group). (E) MPO activity in lung homogenates at 15 h after CS inoculation (n = 6 per group). (F, G) Serum levels of BUN (F), and creatinine (G) at 15 h after CS inoculation (n = 6 per group). (H, I) Levels of cytokine and chemokine in PLF (H) and plasma (I) at 15 h after CS inoculation (n = 6 per group). Data information: Box plots represent the median with interquartile range, the whiskers indicate min and max values (CI). Statistical analysis is performed with log-rank test (B), and ANOVA with Bonferroni corrections (CI). ns, not significant; *p < 0.05, **p < 0.01, ***p < 0.001. Source data are available online for this figure.
Figure EV1
Figure EV1. Sepsis and ICU cohort study.
(A) Flowchart of the sepsis and ICU cohort population in Asan Medical Center and Seoul National University Hospital. (B) Correlation between WARS1 levels and cytokine and chemokine levels in the ICU controls (n = 30). Individual correlation results are reported with linear regression lines. (C) Receiver operating characteristic (ROC) analysis by cut-off value of WARS1 between survivors and non-survivors. Data information: Statistical analysis is performed with Pearson’s correlation coefficient test (B), and ROC test (C).
Figure EV2
Figure EV2. The WARS1low group showed no positive correlation with cytokine and chemokine levels.
Correlation between WARS1 levels and cytokine and chemokine levels in the WARS1low (n = 130) group (stratified below 106.3 ng/mL). Individual correlation results are reported with linear regression lines. Statistical analysis is performed with Pearson’s correlation coefficient test.
Figure EV3
Figure EV3. Effect of WARS1-induced pro-inflammatory response in hPBMCs.
(A) TNF-α levels in the supernatant of PMA-differentiated THP-1 cells (n = 3) treated with hFL-WARS1 (50–100 nM) or LPS (100 ng/mL) with or without polymyxin B (50 μg/mL) for 9 h. (B) Gene expression of cytokine and chemokine in hPBMCs (n = 6) treated with hFL-WARS1 (50 nM) for 6 h. (C) Levels of cytokine and chemokine in the supernatants of hPBMCs (n = 6) treated with hFL-WARS1 (50 nM) for 6 h. Data information: Data are presented as mean ± SD (A), and ± SEM (B, C). Statistical analysis is performed with ANOVA with Bonferroni corrections (A), and Mann–Whitney U-test (B, C). ns, not significant; **p < 0.01, ***p < 0.001.
Figure EV4
Figure EV4. Generation and neutralizing effect of anti-WARS1 MAb.
(A) Production process of WARS1 monoclonal antibody. After selectively isolating a clone that binds to WARS1 from the phage library (biopanning cycle), affinity and specificity were assessed, followed by DNA screening and sequencing. Then, the purified scfv was used for the neutralization test (purification and activity test) and finally converted to IgG (IgG conversion). (BD) Immunoblot for human (B), marmoset (C), and mouse (D) WARS1 with anti-WARS1 MAb in recombinant full-length protein (RP), cell lysate (CL), and plasma (P). (E–G) Binding affinity of anti-WARS1 MAb to recombinant human (E), marmoset (F), and mouse (G) WARS1. (HJ) Levels of TNF-α and CXCL2/MIP-2α in the supernatant. J774A.1 cells (n = 3) were treated with a mixture of human (H), marmoset (I), and mouse (J) WARS1 and anti-WARS1 MAb or isotype IgG for 16 h. Data information: Data are presented as mean ± SD (HJ). Statistical analysis is performed with ANOVA with Bonferroni corrections (HJ). ns, not significant; *p < 0.05, **p < 0.01, ***p < 0.001.
Figure EV5
Figure EV5. Homology between human, marmoset, and mouse WARS1.
(A) Similarity of protein sequence between human, marmoset, and mouse FL-WARS1. (B) Levels of cytokine and chemokine in the supernatant of PMA-differentiated THP-1 cells (n = 3) treated with human, marmoset, and mouse WARS1 (50 nM) for 18 h. Data information: Data are presented as mean ± SD (B). Statistical analysis is performed with ANOVA with Bonferroni corrections (B). *p < 0.05, **p < 0.01, ***p < 0.001.

References

    1. Abraham E, Anzueto A, Gutierrez G, Tessler S, San Pedro G, Wunderink R, Dal Nogare A, Nasraway S, Berman S, Cooney R, et al. Double-blind randomised controlled trial of monoclonal antibody to human tumour necrosis factor in treatment of septic shock. NORASEPT II Study Group. Lancet. 1998;351:929–933. doi: 10.1016/S0140-6736(05)60602-2. - DOI - PubMed
    1. Abraham E, Wunderink R, Silverman H, Perl TM, Nasraway S, Levy H, Bone R, Wenzel RP, Balk R, Allred R, et al. Efficacy and safety of monoclonal antibody to human tumor necrosis factor alpha in patients with sepsis syndrome. A randomized, controlled, double-blind, multicenter clinical trial. TNF-alpha MAb Sepsis Study Group. JAMA. 1995;273:934–941. doi: 10.1001/jama.1995.03520360048038. - DOI - PubMed
    1. Ahn YH, Park S, Choi JJ, Park BK, Rhee KH, Kang E, Ahn S, Lee CH, Lee JS, Inn KS, et al. Secreted tryptophanyl-tRNA synthetase as a primary defence system against infection. Nat Microbiol. 2017;2:17015. doi: 10.1038/nmicrobiol.2017.15. - DOI - PubMed
    1. Bolger AM, Lohse M, Usadel B. Trimmomatic: a flexible trimmer for Illumina sequence data. Bioinformatics. 2014;30:2114–2120. doi: 10.1093/bioinformatics/btu170. - DOI - PMC - PubMed
    1. Cavaillon JM, Singer M, Skirecki T. Sepsis therapies: learning from 30 years of failure of translational research to propose new leads. EMBO Mol Med. 2020;12:e10128. doi: 10.15252/emmm.201810128. - DOI - PMC - PubMed

Publication types

Associated data