. 2024 Jan;16(1):158-184.
doi: 10.1038/s44321-023-00013-x. Epub 2023 Dec 20.

Bcl-xL targeting eliminates ageing tumor-promoting neutrophils and inhibits lung tumor growth

Affiliations

Bcl-xL targeting eliminates ageing tumor-promoting neutrophils and inhibits lung tumor growth

Anita Bodac et al. EMBO Mol Med. 2024 Jan.

Abstract

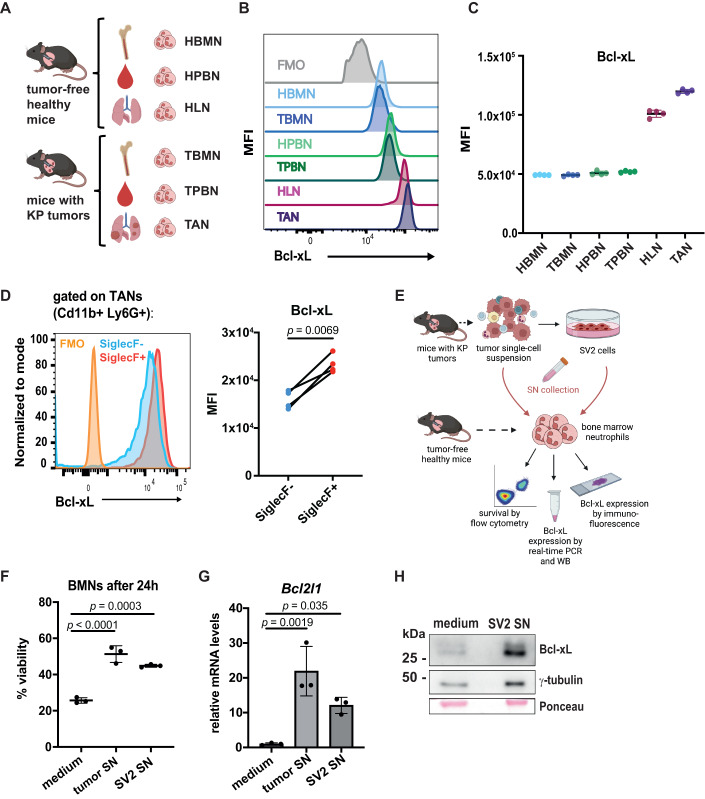
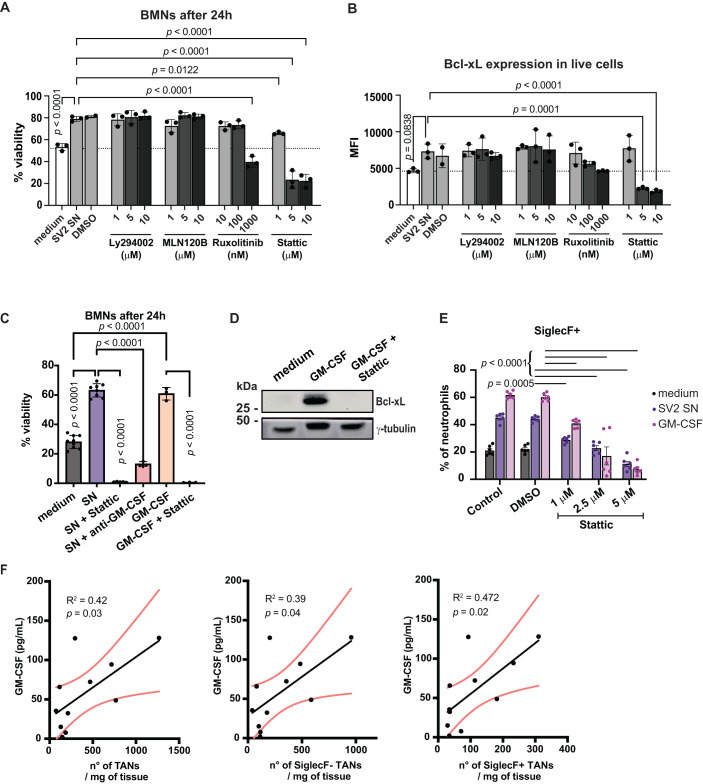
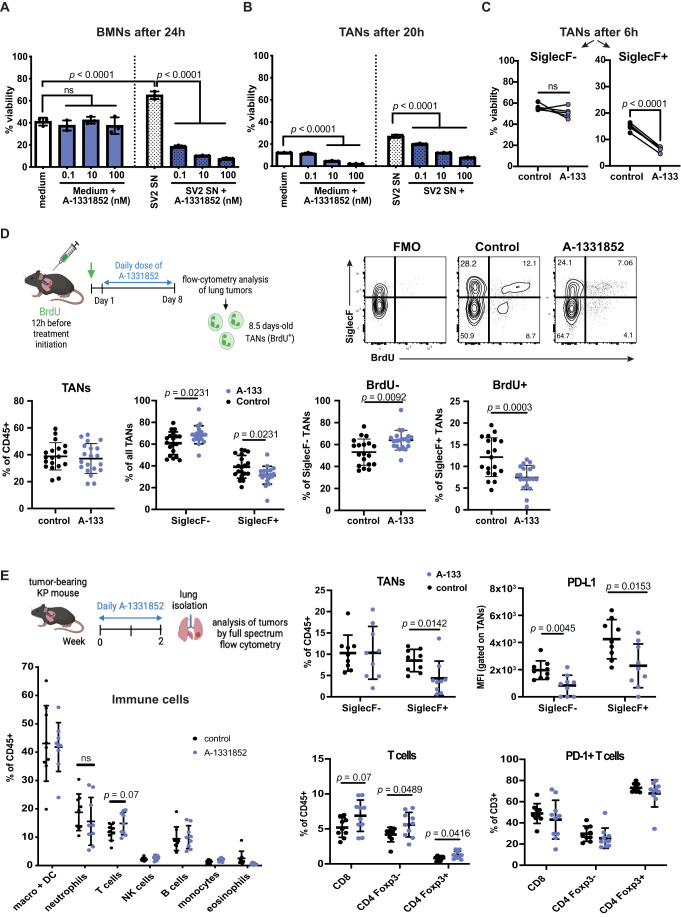
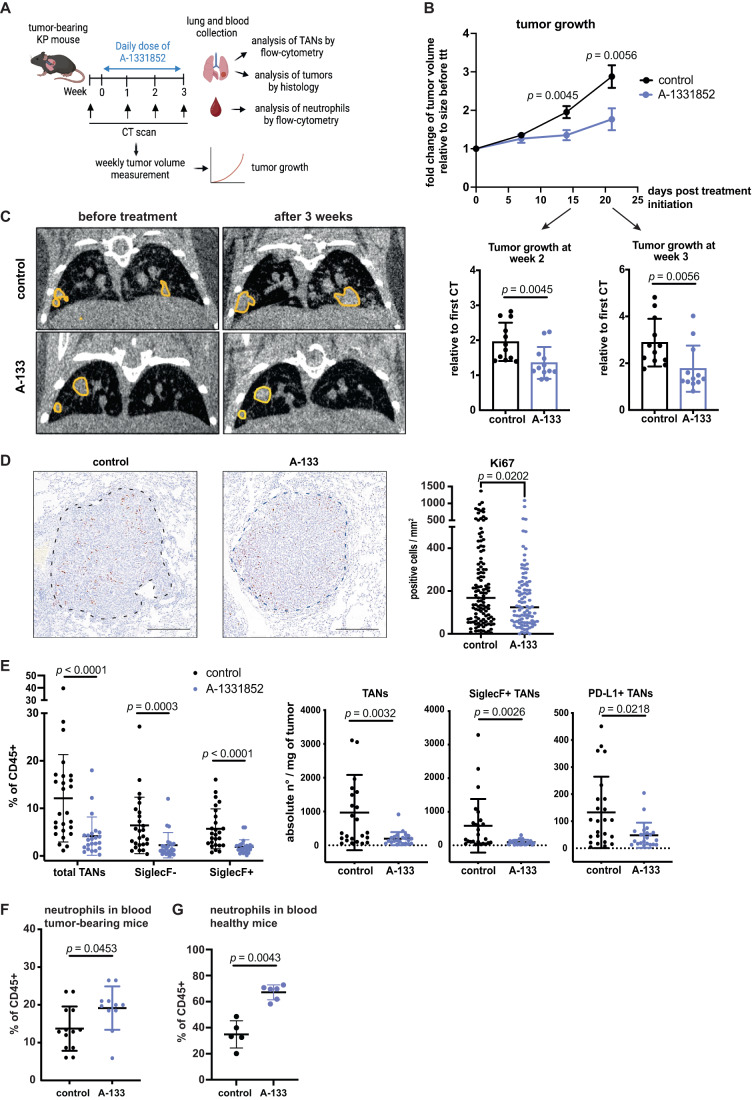
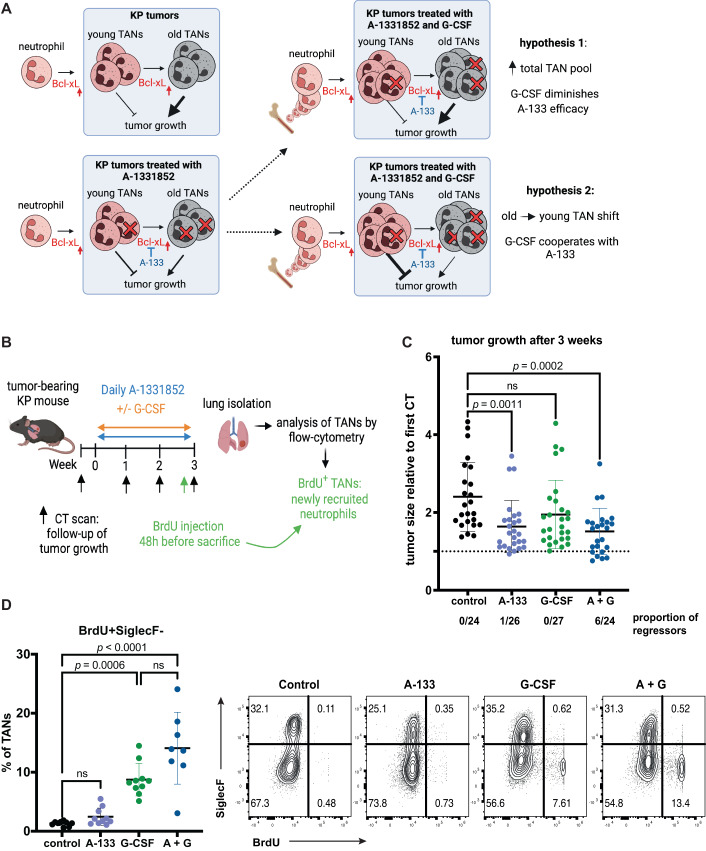
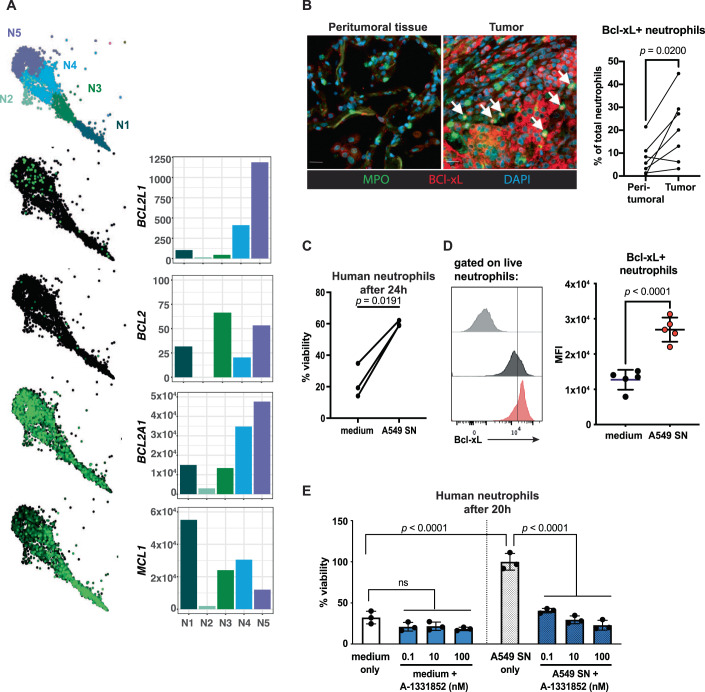
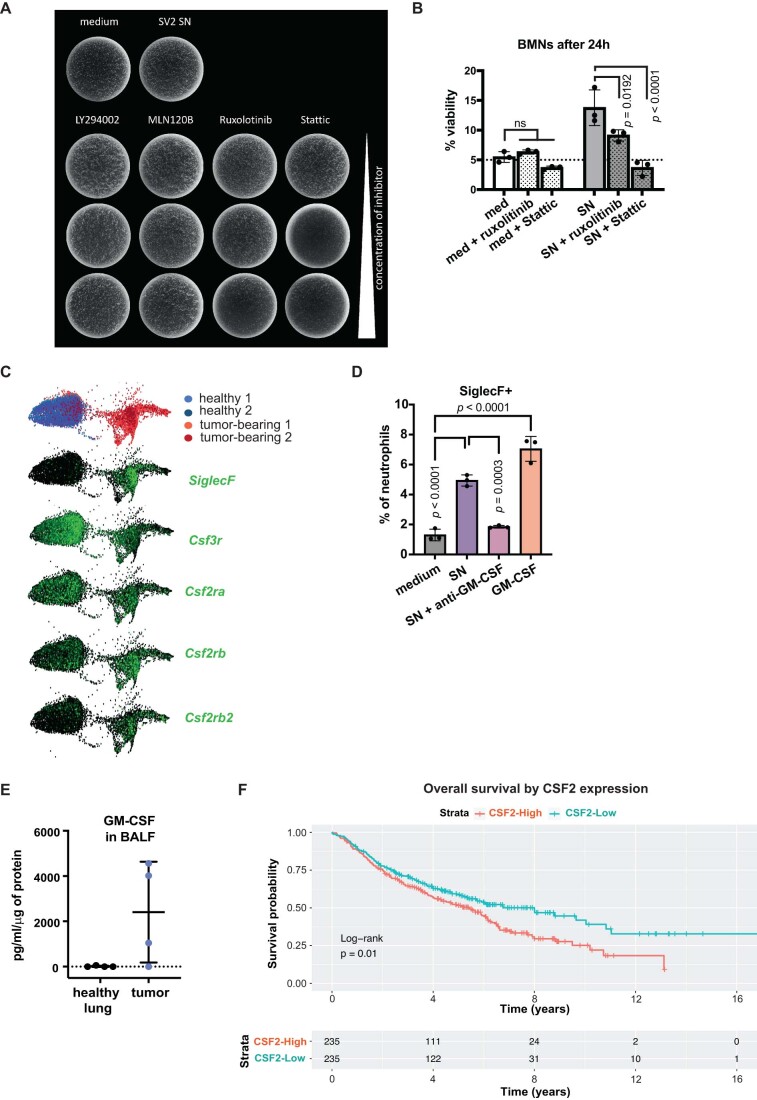
Elevated peripheral blood and tumor-infiltrating neutrophils are often associated with a poor patient prognosis. However, therapeutic strategies to target these cells are difficult to implement due to the life-threatening risk of neutropenia. In a genetically engineered mouse model of lung adenocarcinoma, tumor-associated neutrophils (TAN) demonstrate tumor-supportive capacities and have a prolonged lifespan compared to circulating neutrophils. Here, we show that tumor cell-derived GM-CSF triggers the expression of the anti-apoptotic Bcl-xL protein and enhances neutrophil survival through JAK/STAT signaling. Targeting Bcl-xL activity with a specific BH3 mimetic, A-1331852, blocked the induced neutrophil survival without impacting their normal lifespan. Specifically, oral administration with A-1331852 decreased TAN survival and abundance, and reduced tumor growth without causing neutropenia. We also show that G-CSF, a drug used to combat neutropenia in patients receiving chemotherapy, increased the proportion of young TANs and augmented the anti-tumor effect resulting from Bcl-xL blockade. Finally, our human tumor data indicate the same role for Bcl-xL on pro-tumoral neutrophil survival. These results altogether provide preclinical evidence for safe neutrophil targeting based on their aberrant intra-tumor longevity.

Keywords: Bcl-xL; Lung Adenocarcinoma; Mouse Models of Lung Cancer; Tumor-associated Neutrophils.


Conflict of interest statement

FR is a co-founder of Cellestia. EM serves in the scientific advisory board of InhaTarget Therapeutics. The remaining authors declare no competing interests.

Figures

Figure 1
Figure 1. Tumor-associated neutrophils overexpress the anti-apoptotic protein Bcl-xL.
(A) Scheme describing the different neutrophil populations analyzed. For healthy naive mice: bone marrow-derived neutrophils (HBMN), healthy peripheral blood neutrophils (HPBN), healthy lung neutrophils (HLN). For tumor-bearing mice: bone marrow-derived neutrophils (TBMN), peripheral blood-derived neutrophils (TPBN) and tumor-associated neutrophils (TAN). (B) Representative flow cytometry histograms showing Bcl-xL levels in different neutrophil populations in naive mice and mice with KP tumors. (C) Median fluorescence intensity (MFI) of Bcl-xL in indicated populations (n = 4 biological replicates). (D) Representative flow cytometry histograms showing Bcl-xL levels in SiglecF and SiglecF+ TANs and corresponding MFI quantification (n = 4). (E) Scheme representing the experimental setup for the neutrophil survival assay. (F) Percentage of viable neutrophils after 24 h in medium, tumor-derived supernatant (SN) or SV2 cell-derived SN (n = 3 biological replicates). (G) Real-time PCR analysis of Bcl2l1 in BMNs upon incubation with medium or supernatant from tumors or from SV2 cells. Data are shown as mean ± SD of n = 3 mice of a representative experiment reproduced three times. (H) Western blot analysis of Bcl-xL expression in BMNs after 24 h incubation in medium or SV2 SN. γ-tubulin and Ponceau red were used as loading control. Data information: In vitro assays were performed at least three times. All results are shown as mean ± SD. and statistical analysis was performed using paired t test (D) or one-way ANOVA (F). For (F), the experiment was replicated three times. For (G), significance was determined by ordinary one-way ANOVA with Dunnett’s multiple comparisons test. Source data are available online for this figure.
Figure 2
Figure 2. Bcl-xL is induced by GM-CSF-mediated JAK-STAT signaling.
(A) Percentage of viable bone marrow neutrophils (BMN) after 24 h of incubation with medium, SV2 cell supernatant (SN), DMSO as control or SN with the indicated doses of Ly294002 (PI3K inhibitor), MLN120B (IKKβ inhibitor), ruxolitinib (JAK1/2 inhibitor) or stattic (STAT3 inhibitor). The mean basal neutrophil survival (incubated with medium) is indicated with a dashed line. (B) Mean fluorescence intensity (MFI) of Bcl-xL expression in neutrophils from (A). The mean basal intensity is indicated with a dashed line. (C) Percentage of viable BMNs after 24 h of incubation. (D) Western blot analysis of Bcl-xL from BMNs incubated with GM-CSF (10 ng/mL) and stattic (5 µM) for 24 h. γ-tubulin was used as a loading control. (E) SiglecF surface protein expression measured in BMNs (n = 6 biological replicates) incubated with SV2 SN or GM-CSF and with or without stattic at the indicated concentrations for 24 h. (F) Pearson correlation analysis between the frequency of TANs (gated on CD45+CD11b+Ly6G+ cells), SiglecF TANs and SiglecF+ TANs and GM-CSF levels in individual tumors (n = 11). Data information: Data are shown as mean ± SD. For (A, B), data represent BMNs from n = 3 mice. For (C), data for control (n = 9), SN (n = 8), and SN + stattic (n = 5) are pooled from three independent experimental groups, and for the others, n = 3 represents three biological replicates. Significance was determined using ordinary one-way ANOVA with Dunett’s (A, B) or Tukey’s (C) multiple comparison test. For (E), significance was determined using two-way ANOVA with Tukey’s multiple comparisons test. Source data are available online for this figure.
Figure 3
Figure 3. A-1331852 reduces TAN survival in vitro and in vivo.
(A, B) Bone marrow (A) and TAN viability (B) (% of live cells out of total) after 24 h in vitro culture in medium only or with increasing doses of A-1331852. (C) SiglecF and SiglecF+ TAN viability (% of live cells out of total) after 6 h in vitro culture in medium only or with 50 nM of A-1331852. TANs were obtained from n = 5 tumors. (D) Prevalence of total, SiglecF+, SiglecF-, BrdU-SiglecF and BrdU+SiglecF+ TANs. Each data point represents a single tumor. For control group, n = 18 tumors from three mice and n = 20 tumors from three A-1331852-treated mice. (E) Percentage of the different immune cell populations in KP tumors in mice treated for 2 weeks with A-1331852. Each data point corresponds to one tumor. n = 8 tumors from two control mice were analyzed and n = 9 tumors from three A-1331852-treated mice. Data information: All data are shown as mean ± SD. For (A, B), significance was determined by ordinary one-way ANOVA with Tukey’s multiple comparisons test. For (A), the experiment was replicated three times. For (CE), significance was based on a two-tailed Student’s t test (paired analysis for (C)). ns non-significant. Source data are available online for this figure.
Figure 4
Figure 4. Bcl-xL blockade reduces tumor growth in vivo.
(A) Scheme showing the experimental design. Tumor-bearing mice were treated daily for 3 weeks. For these mice and for controls, tumors were measured one day before treatment initiation and then once weekly until the endpoint. (B) Evolution of tumor volume over 3 weeks in control mice or A-1331852-treated mice and dot plots showing the number of tumors analyzed (n = 12 tumors per group). Data show the ratio of tumor volumes relative to the initial volume size before treatment. (C) Examples of μCT scans of KP lungs with highlights of tumors in yellow before treatment initiation and 3 weeks post-treatment. (D) Representative IHC images and dot plot showing the quantification of Ki67+ cells. Measurements are reported as the number of positive cells per mm2 of lesion area. Each dot represents a single lesion analyzed. Scale bars: 200 μm. (E) Left, percentage of total TANs, SiglecF and SiglecF+ TANs out of CD45+ cells in control (n = 24 tumors) and A-1331852-treated mice (n = 22 tumors analyzed). Right, absolute numbers are shown for total TANs, SiglecF+ TANs, and PD-L1+ TANs per tumor. (F) Percentage of neutrophils in blood from tumor-bearing mice in controls (n = 13) or after 3-weeks treatment (n = 11). (G) Percentage of neutrophils in blood from healthy mice in controls (n = 5) or after 3-days treatment (n = 6). Data information: Data are shown as mean ± SD, except for (D), where the median is shown, and except for (B), where data are shown as mean ± SEM. Significance was determined by the Mann–Whitney test for (B, E, F, G) and unpaired t test for (D). Source data are available online for this figure.
Figure 5
Figure 5. G-CSF potentiates the anti-tumor effect of Bcl-xL blockade.
(A) Scheme representing the rationale and possible outcomes for combining Bcl-xL inhibition with G-CSF-mediated young neutrophil recruitment to tumors. (B) Scheme representing the treatment strategy. Control, A-1331852-treated, G-CSF, G-CSF + A-1331852-treated mice were treated daily, and tumor growth was measured by μCT once weekly for 3 weeks. n = 3 mice/group. BrdU injection 48 h before sacrifice enabled to track neutrophils that are newly recruited to the tumors. (C) Tumor growth was measured after 3 weeks, relative to the tumor volume size measured before treatment. Each data point represents a single tumor and the proportion of regressing tumors is shown below each group. n = 24 tumors analyzed for control and A-1331852 + G-CSF (A + G) groups, n = 26 for A-1331852 (A-133) and n = 27 for G-CSF-treated mice. (D) The percentage of BrdU+ newly recruited TANs (gated on CD11b+ Ly6G+ SiglecF cells) and representative FACS plots showing the recruitment of BrdU+ neutrophils to the tumors in the indicated treatment conditions. n = 10 tumors analyzed for control, A-1331852 and G-CSF and n = 8 tumors for A-1331852 + G-CSF. Data information: Data are shown as mean ± SD. Significance was determined by the Kruskal–Wallis test followed by Dunn’s multiple comparisons test. ns non-significant. Source data are available online for this figure.
Figure 6
Figure 6. Human neutrophils upregulate Bcl-xL in tumors and survive longer with tumor cell-conditioned medium.
(A) Representative images of the available single-cell transcriptomics showing the five TAN subsets from patients with lung cancer. BCL2L1, BCL-2, BCL2A1, and MCL1 expression are shown per subset. (B) Representative example of neutrophils (MPO+ cells) and Bcl-xL co-immunostaining in seven LUAD patient samples and quantification of the percentage of Bcl-xL+ neutrophils in matched tumor and peritumoral tissue. White arrows indicate MPO+ Bcl-xL+ cells. Scale bars: 20 μm. (C) Percentage of live healthy blood donor-derived neutrophils after 24 h of incubation with A549 tumor cell line supernatant. (D) Representative flow cytometry and quantification showing Bcl-xL upregulation in human blood-derived neutrophils upon incubation with tumor cell line supernatant after 24 h. n = 5 donors. (E) Viability of human neutrophils with A549 SN and increasing doses of A-1331852 in vitro after 18 h of incubation. n = 3 biological replicates. Data information: For (D, E), data are shown as mean ± SD. For (BD), significance was determined with a paired t test. For (E), significance was determined with a one-way ANOVA followed by Šídák’s multiple comparisons test. ns non-significant. Source data are available online for this figure.
Figure EV1
Figure EV1. Bcl-xL expression analysis in neutrophils and TANs.
(A) Gene set enrichment analysis (GSEA) showing downregulation of the apoptosis pathway in TANs compared to HLNs. (B) Volcano plot showing differentially expressed genes (DE) in TANs versus HLNs. The anti-apoptotic genes Bcl2l1, Bcl2a1b and Mcl1 are highlighted in dark blue. (C) Real-time PCR showing Bcl-2, Bcl2l1, Bcl2a1 and Mcl1 gene expression in TANs (n = 11 biological replicates) normalized to expression in HLNs (n = 5). Rpl30 was used as a reference gene. (D) Immunofluorescence staining of neutrophils (MPO) and Bcl-xL in tumors of KP mice. Scale bar: 100 µm. (E) Representation of neutrophil subsets in naive and tumor-bearing mice from the available single-cell transcriptomics. SiglecF, Bcl2l1, Bcl-2, Bcl2a1b and Mcl1 expressions are highlighted in green. (F) Representative flow cytometry gating strategy of alive bone marrow-extracted neutrophils after 24 h incubation with medium or SV2 SN. Data information: For (A), statistical significance was calculated by permutation tests (number of random permutations = 105). For (B), differential gene expression was computed with limma and significance assessed with the moderated t test. Genes with P value < 0.01 are highlighted in red (n = 1335, n = 471 with LFC > 0, n = 864 with LFC < 0). Total number of genes tested n = 5397. (C) Data are shown as mean ± SD and significance was obtained with two-way ANOVA with Sidàk’s multiple comparisons test. ns non-significant.
Figure EV2
Figure EV2. Bcl-xL induction by GM-CSF-mediated JAK-STAT signaling.
(A) Representative images of BMNs incubated with increasing doses of pathway inhibitors observed with brightfield microscopy. (B) BMN viability was measured by flow cytometry 24 h after incubation with indicated doses of ruxolitinib (1 μM) or stattic (10 μM) in medium or SV2 supernatant, with BMNs extracted from n = 3 mice. (C) Representative images of SiglecF, Csf3r, Csf2ra, Csf2rb and Csf2rb2 from publicly available single-cell RNA sequencing data. (D) Percentage of SiglecF+ BMNs after 24 h of incubation. n = 3 biological replicates. (E) GM-CSF concentration measured in the bronchoalveolar lavage fluid (BALF) from healthy (n = 4) and tumor-bearing mice (n = 4). (F) Kaplan–Meier curves for overall survival and P value of pairwise differences between groups with high or low CSF2 expression from the combined LUAD transcriptome dataset. Data information: For (B, D, E), data are shown as mean ± SD. For (B, D), significance was determined by ordinary one-way ANOVA with Tukey’s multiple comparisons test. ns non-significant.
Figure EV3
Figure EV3. A-1331852 decreases TAN ageing.
(A) Scheme representing BH3-mimetics inhibition specificity. (B) Viability (%) of BMNs incubated with 0.1, 10 and 100 nM of Venetoclax, Navitoclax or A-1331852 in medium or SV2 SN for 24 h. n = 3 biological replicates. (C) Upper part: percentage of viable (AnnexinV-7-AAD-), early (AnnexinV+7-AAD), and late apoptotic (AnnexinV+7-AAD+) BMNs incubated with medium or SV2 SN with or without A-1331852. TNF (5 ng/mL) was used as control to induce neutrophil apoptosis. n = 3 biological replicates. Lower part: Western blot analysis of cleaved-caspase-3 (CC3). Histone H3 (hH3) was used as loading control. (D) Healthy lung neutrophils (HLN) survival after 24 h with SV2 SN and with A-1331852 (10 nM) (HLNs were extracted from n = 5 healthy non-tumor-bearing mice). (E) % of surviving TANs after 24 h, with SV2, SV2 + A-1331852 with or without preliminary incubation with the pan-caspase inhibitor z-VAD-FMK (20 μM). TANs are from n = 3 tumors. (F) Scheme showing the experimental design and plots showing flow cytometry analysis of neutrophils, SiglecF+ and SiglecF+BrdU+ 6-days-old TANs in control KP mice (n = 7 tumors), mice treated with Navitoclax (n = 12 tumors) or with Venetoclax (n = 14). (G) Real-time PCR analysis of expression of the indicated genes in TANs extracted from n = 4 control or n = 5 A-1331852 treated tumors. (H) MFI of Bcl-xL expression in SiglecF and SiglecF+ TANs in mice from the same experiment as reported in Fig. 3E. n = 9 tumors for each group. Data information: All data are shown as mean ± SD. For (B), conditions with drugs in the medium were analyzed compared to the medium-only condition, and drugs in SV2 SN were compared to the SV2 SN condition and significance was determined by ordinary one-way ANOVA with Dunnett’s multiple comparisons test. For (C), significance was based on two-way ANOVA with Tukey’s multiple comparisons test. For (E), significance was determined by ordinary one-way ANOVA with Tukey’s multiple comparisons test. For (F), total TANs were analyzed by Kruskal–Wallis with Dunn’s multiple comparisons test. SiglecF+BrdU+ TANs were analyzed by ordinary one-way ANOVA and Dunn’s multiple comparisons test. For (G), significance was based on a two-tailed Student’s t test. For (H), significance was based on two-way ANOVA. ns non-significant.
Figure EV4
Figure EV4. Intermittent A-1331852 treatment restores selective targeting against SiglecF+ TANs.
(A) Scheme describing the treatment regimen and experimental setup. Mice were treated with A-1331852 for 5 days then with two days break, for a duration of 3 weeks. Lung tumors were then isolated and the TAN population was analyzed by flow cytometry. (B) Graphs showing the percentages of total TANs, SiglecF and SiglecF+ TANs. n = 14 tumors were analyzed for control mice (vehicle treated) and n = 19 tumors from A-133-treated mice. Data shown are mean ± SD. Significance was determined with a Mann–Whitney test for total TANs and two-tailed t test for SiglecF and SiglecF+ percentages. ns non-significant.
Figure EV5
Figure EV5. Bcl-xL blockade does not affect the viability of lung tumor cells.
(A) Viability of SV2 and T5 cell lines, measured with PrestoBlue after 48 and 72 h of incubation with serial dilutions of A-1331852. n = 3 technical replicates. (B) Clonogenic assay performed with 100, 200, 400 single SV2 cells incubated with 0.1, 10 or 100 nM of A-1331852. n = 3 technical replicates. (C) Data show percentage of viable Ly6G- cells after 18 h of 10 nM of A-1331852 incubation (n = 5 tumors). (D) Plots showing the growth of single tumors in control (n = 12), A-1331852-treated (n = 11), neutrophil-depleted (n = 12) and neutrophil-depleted in combination with A-1331852 (d + A-133, n = 16) KP mice. TAN proportions out of total CD45+ and SiglecF+ cells out of total TANs are shown for single tumors for control (n = 13), A-1331852-treated (n = 8), neutrophil-depleted (n = 10) and neutrophil-depleted in combination with A-1331852 (n = 13). Blood neutrophil levels are also shown for n = 3 in control mice, A-1331852-treated and depletion with A-1331852, and n = 2 for neutrophil-depleted only mice. Data information: Data are shown as mean ± SD. For (C), significance was determined based on a paired t test. For (D), ordinary one-way ANOVA with Tukey’s multiple comparisons test was performed for the tumor growth and Kruskal–Wallis with Dunn’s multiple comparisons test was performed for the other panels. ns, non-significant.

References

    1. Al-Shami A, Mahanna W, Naccache PH. Granulocyte-macrophage colony-stimulating factor-activated signaling pathways in human neutrophils. Selective activation of Jak2, Stat3, and Stat5B. J Biol Chem. 1998;273:1058–1063. doi: 10.1074/jbc.273.2.1058. - DOI - PubMed
    1. Ancey PB, Contat C, Boivin G, Sabatino S, Pascual J, Zangger N, Perentes JY, Peters S, Dale Abel E, Kirsch DG, et al. GLUT1 expression in tumor-associated neutrophils promotes lung cancer growth and resistance to radiotherapy. Cancer Res. 2021;81:2345–2357. doi: 10.1158/0008-5472.CAN-20-2870. - DOI - PMC - PubMed
    1. Ancey PB, Contat C, Boivin G, Sabatino S, Pascual J, Zangger N, Perentes JY, Peters S, Dale Abel E, Kirsch DG et al (2021b) Gene expression Omnibus GSE140159. Datasethttps://www.ncbi.nlm.nih.gov/geo/query/acc.cgi?acc=GSE140159
    1. Bayne LJ, Beatty GL, Jhala N, Clark CE, Rhim AD, Stanger BZ, Vonderheide RH. Tumor-derived granulocyte-macrophage colony-stimulating factor regulates myeloid inflammation and T cell immunity in pancreatic cancer. Cancer Cell. 2012;21:822–835. doi: 10.1016/j.ccr.2012.04.025. - DOI - PMC - PubMed
    1. Blayney DW, Schwartzberg L. Chemotherapy-induced neutropenia and emerging agents for prevention and treatment: a review. Cancer Treat Rev. 2022;109:102427. doi: 10.1016/j.ctrv.2022.102427. - DOI - PubMed

Publication types