. 2024 Feb;16(2):334-360.
doi: 10.1038/s44321-023-00015-9. Epub 2024 Jan 2.

Shaping immune landscape of colorectal cancer by cholesterol metabolites

Affiliations

Shaping immune landscape of colorectal cancer by cholesterol metabolites

Yibing Bai et al. EMBO Mol Med. 2024 Feb.

Abstract

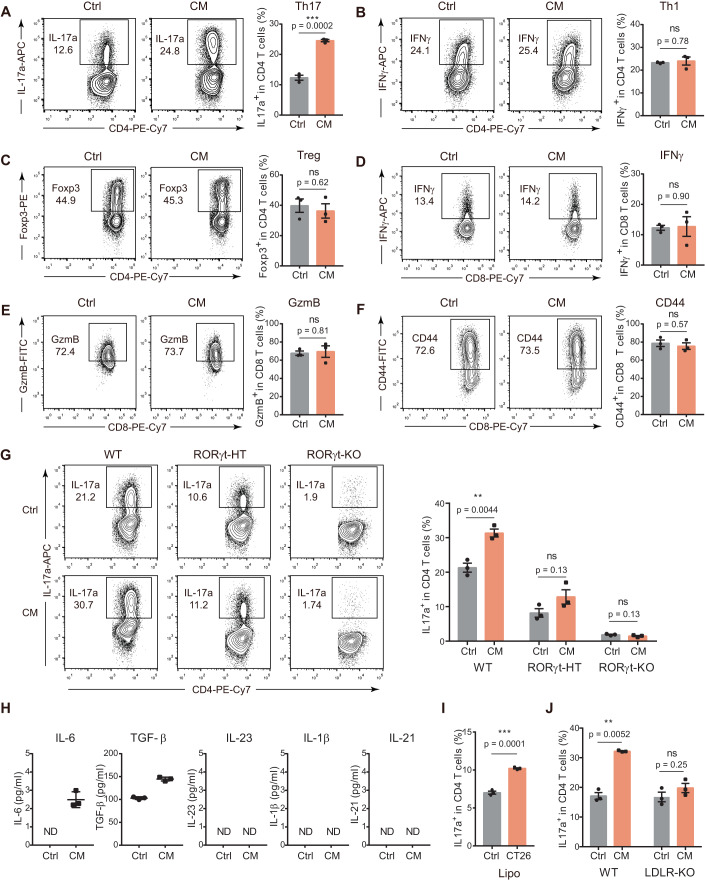
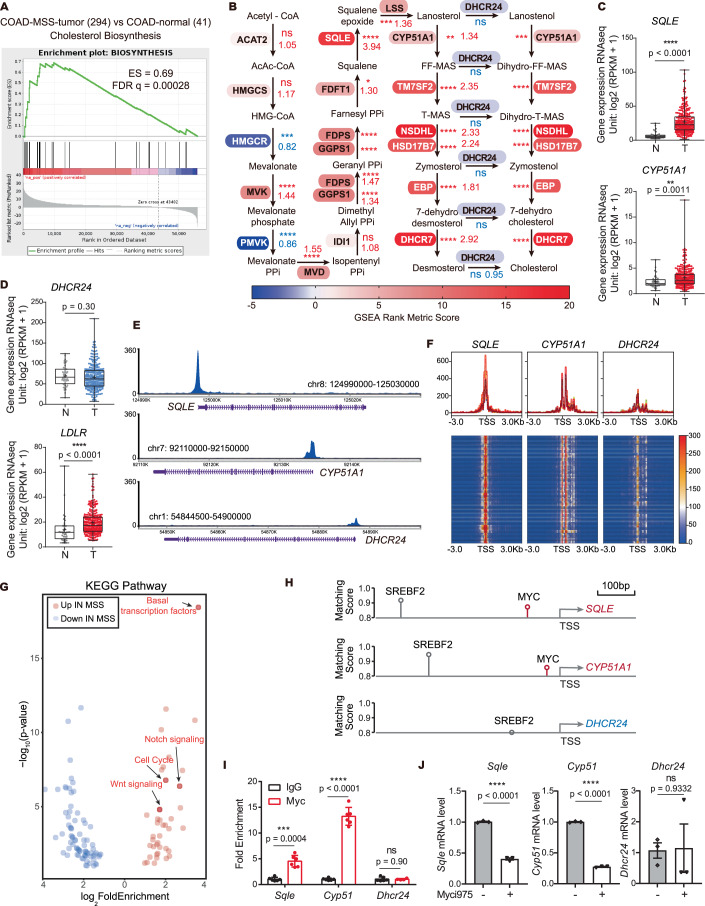
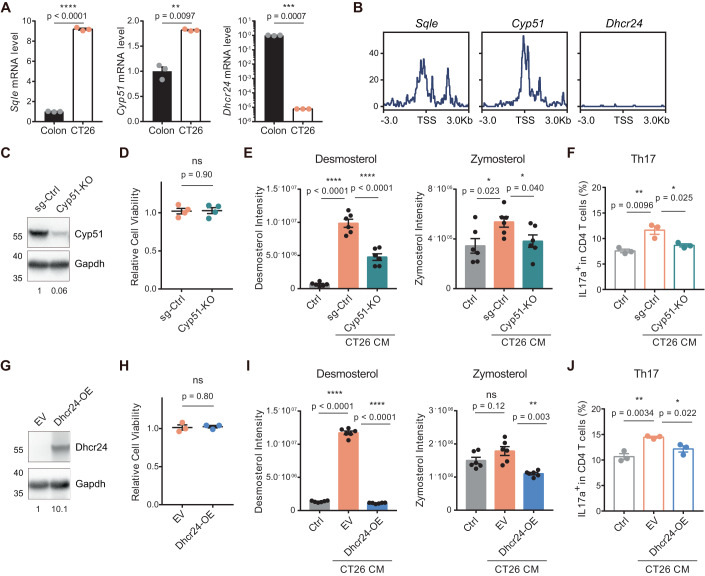
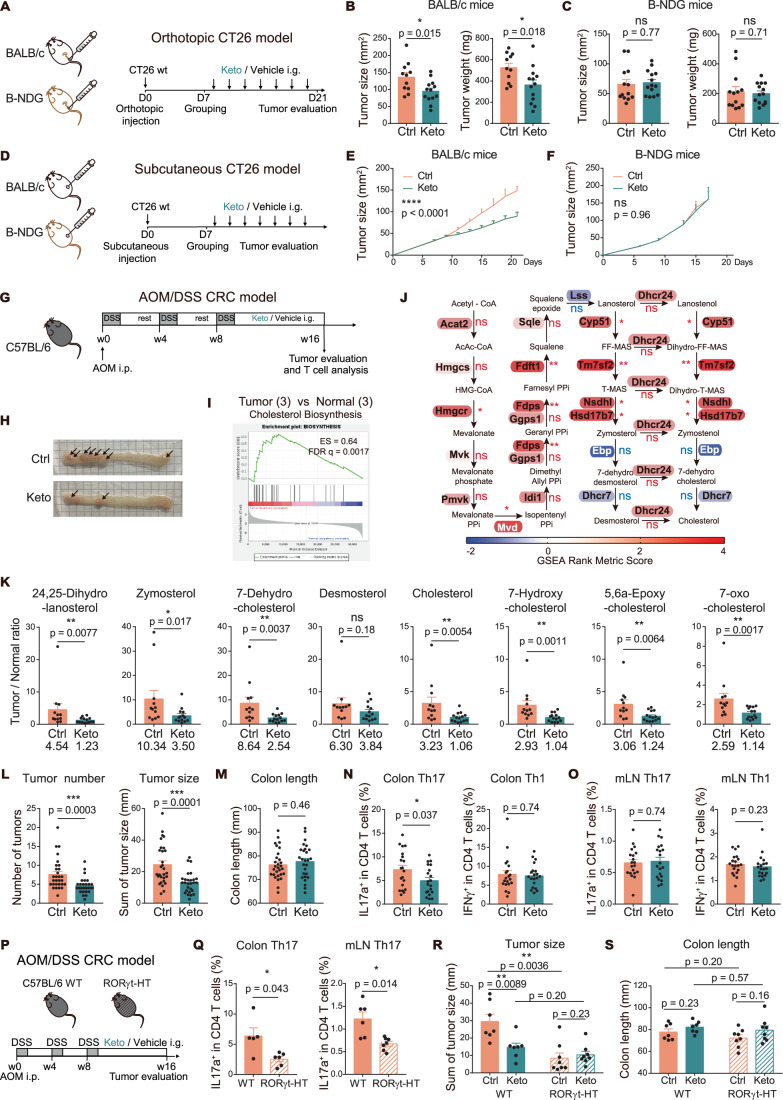
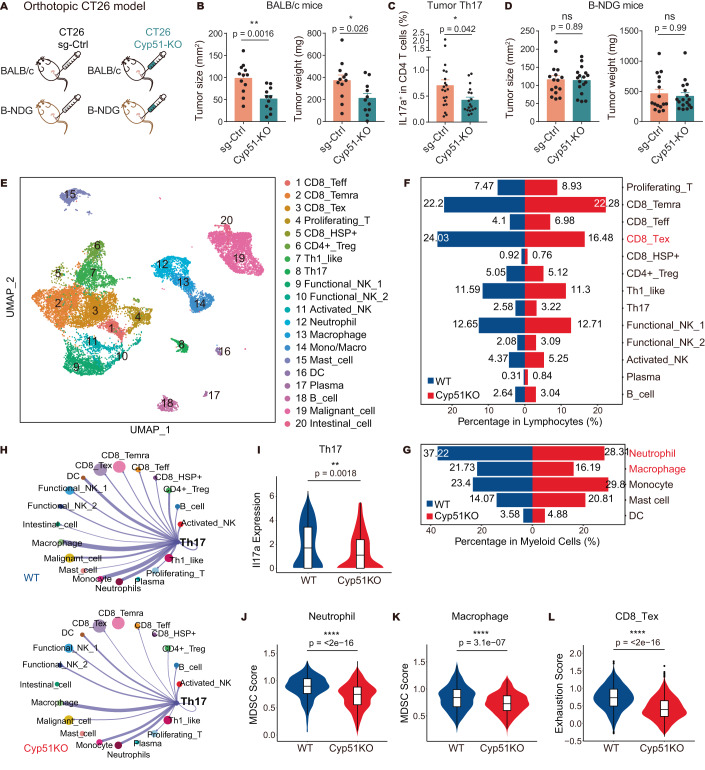
Cancer immunotherapies have achieved unprecedented success in clinic, but they remain largely ineffective in some major types of cancer, such as colorectal cancer with microsatellite stability (MSS CRC). It is therefore important to study tumor microenvironment of resistant cancers for developing new intervention strategies. In this study, we identify a metabolic cue that determines the unique immune landscape of MSS CRC. Through secretion of distal cholesterol precursors, which directly activate RORγt, MSS CRC cells can polarize T cells toward Th17 cells that have well-characterized pro-tumor functions in colorectal cancer. Analysis of large human cancer cohorts revealed an asynchronous pattern of the cholesterol biosynthesis in MSS CRC, which is responsible for the abnormal accumulation of distal cholesterol precursors. Inhibiting the cholesterol biosynthesis enzyme Cyp51, by pharmacological or genetic interventions, reduced the levels of intratumoral distal cholesterol precursors and suppressed tumor progression through a Th17-modulation mechanism in preclinical MSS CRC models. Our study therefore reveals a novel mechanism of cancer-immune interaction and an intervention strategy for the difficult-to-treat MSS CRC.

Keywords: Asynchronous Cholesterol Biosynthesis; Colorectal Cancer with Microsatellite Stability; Cyp51 Targeted Therapy; Distal Cholesterol Precursors; Th17.


Conflict of interest statement

The authors declare no competing interests.

Figures

Figure 1
Figure 1. Specific polarization of Th17 cells by secreted lipophilic factors of MSS CRC cells.
(AC) Th17 (A), Th1 (B), and Treg (C) induction in the presence of the conditioned medium of CT26 cells. Naive CD4+ T cells were stimulated with plate-bound anti-CD3/CD28 and cytokines to induce Th17, Th1 or Treg differentiation. Concentrated conditioned medium (CM) or control blank medium (Ctrl) (2.5% v/v) was added on Day 2. Th17 (IL-17a+ gated on CD4+), Th1 (IFNγ+ gated on CD4+), and Treg (Foxp3+ gated on CD4+) percentages were analyzed on Day 4 (n = 3). (D, E) CD8+ T cell effector functions in the presence of the conditioned medium of CT26 cells. Naive CD8+ T cells were stimulated with plate-bound anti-CD3/CD28. Concentrated conditioned medium (CM) or control blank medium (Ctrl) (2.5% v/v) was added on Day 1. CD8+ T cell effector functions (D) IFNγ+ gated on CD8+; (E) GzmB+ gated on CD8+) was analyzed on Day 2 (n = 3). (F) CD8+ T cell activation in the presence of the conditioned medium of CT26 cells. Naive CD8+ T cells were stimulated with plate-bound anti-CD3/CD28, in the presence of concentrated conditioned medium (CM) or control blank medium (Ctrl) (2.5% v/v). CD8+ T cell activation (CD44+ gated on CD8+) was analyzed on Day 1 (n = 3). (G) Th17 induction of Rorc-/-(RORγt-KO), Rorc+/-(RORγt-HT) or Rorc+/+ (WT) naive CD4+ T cells in the presence of the conditioned medium of CT26 cells (n = 3). (H) Levels of indicated cytokines in the conditioned medium of CT26 cells. ND not detected (n = 3). (I) Th17 induction in the presence of the lipoproteins isolated from CT26 CM or lipoproteins isolated from control blank medium (n = 3). (J) Th17 induction of Ldlr-/- (LDLR-KO) or Ldlr+/+(WT) naive CD4+ T cells in the presence of the conditioned medium of CT26 cells. (n = 3). Data information: in (AG), representative flow cytometry plots are shown in the left and corresponding quantified data in the right. In (AJ), data are presented as mean ± SEM. In (AG, I, J), two-tailed unpaired Student’s t test was used when variances were similar, whereas a two-tailed unpaired t test with Welch’s correction was used when variances were different. Data are representative of five (A) or two (BJ) independent experiments. P levels < 0.01**, < 0.001***. Source data are available online for this figure.
Figure 2
Figure 2. Human MSS CRC tumors had elevated levels of distal cholesterol precursors.
(A) Experimental approach for the LC-MS based sterol analysis. (B) Intensity of the identified sterols in human MSS CRC tumors (T) and paired adjacent normal tissues (N). Fold change of the mean level of each sterol in tumor vs normal tissue (T/N) is labeled under each graph. Two-tailed Wilcoxon matched-pairs signed rank test (n = 41). (C) Absolute quantification of desmosterol in the human MSS CRC tumors and paired adjacent normal tissues. Fold change of the mean level of desmosterol in tumors vs normal tissues (T/N) is labeled under graph. Two-tailed Wilcoxon matched-pairs signed-rank test (n = 41). (D) Absolute quantification of desmosterol in the interstitial fluid of human MSS CRC tumors (T-IF) and paired adjacent normal tissues (N-IF). Fold change of the mean level of desmosterol in tumors interstitial fluid vs normal tissue interstitial fluid (IF T/N) is labeled under graph. Two-tailed Wilcoxon matched-pairs signed-rank test (n = 9). (E) Th17 induction in the presence of desmosterol at indicated concentrations. Naive CD4+ T cells were stimulated with plate-bound anti-CD3/CD28 and cytokines to induce Th17 differentiation. Two-tailed unpaired Student’s t test (n = 3). (F) Intensity of the desmosterol in the plasma samples of human MSS CRC patients before (Pre) and after (Post) surgical resection of tumors. Fold change of the mean level of each sterol in plasma before vs after surgical resection (Pre/Post) is labeled under each graph. Two-tailed Wilcoxon matched-pairs signed-rank test (n = 8). Data information: in (BF), data are presented as mean ± SEM. P levels < 0.05*, < 0.01**, < 0.001***, < 0.0001****. Source data are available online for this figure.
Figure 3
Figure 3. An asynchronous upregulation pattern of the cholesterol biosynthesis pathway in human CRC.
(A) Gene set enrichment analysis (GSEA) of the cholesterol biosynthesis pathway in MSS CRC tumor tissues (n = 294) and normal tissues (n = 41) in the TCGA colon adenocarcinoma (COAD) database. (B) GSEA rank metric scores and transcriptional levels of enzymes in the cholesterol biosynthesis pathway. Blue and red represents downregulation and upregulation in tumors. P value of gene expression between MSS CRC tumors (n = 294) and normal tissues (n = 41) (two tailed Mann-Whitney test) is labeled by the side of each gene. (ns P > 0.05, *P ≤ 0.05, **P < 0.01, ***P < 0.001, ****P < 0.0001). (C, D) Transcriptional levels of indicated genes in MSS CRC tumors (n = 294) and normal tissues (n = 41) from COAD. Whiskers denote minimum to maximum. Box indicates the interquartile range (25–75%); center line indicates the median. “+” indicates mean. Two tailed Mann–Whitney test. (E) Representative ATAC-seq sequencing tracks of the SQLE, CYP51A1 and DHCR24 gene locus in tumor sample in TCGA-COAD. Regions shown represent: SQLE chr8: 124990000 to 125030000, CYP51A1 chr7:92110000 to 92150000, DHCR24 chr1:54844500 to 54900000. (F) Top panel, ATAC-seq sequencing tracks of the 6000-bp regions centered at the transcription start site (TSS) of indicated genes from 81 CRC tumor samples in TCGA-COAD (n = 81). Bottom panel, heatmap representation of the ATAC-seq chromatin accessibility of TSS regions of indicated genes. Each row represents one CRC tumor sample (n = 81). (G) Scatterplots of differentially enriched KEGG signaling pathways in MSS CRC relative to normal colon tissues (Fisher’s Exact test, P ≤ 0.01 and fold-change ≥2). Representative enriched pathways are indicated by arrowheads. (H) Detailed view of SQLE, CYP51A1 and DHCR24 promoters for enriched TF motifs. The lollipops plots depict the location and matching score of TF motifs found in gene promoters. (I) Analysis of direct Myc binding in Sqle, Cyp51 or Dhcr24 promoters by ChIP-qPCR in CT26 cells. The Myc ChIP signals were normalized to the IgG control and the fold enrichment is shown. For Sqle and Cyp51 (n = 6), two-tailed unpaired Student’s t test with Welch’s correction (n = 6); for Dhcr24, two-tailed unpaired Student’s t test (Myc, n = 4; IgG, n = 6). Data are representative of three independent experiments. (J) Transcriptional levels of Sqle, Cyp51 and Dhcr24 in CT26 cells treated with Myci975 (2 μM) or vehicle for 24 h (n = 3). Data are representative of two independent experiments. Data information: in (IJ), data are presented as mean ± SEM. P levels < 0.05*, < 0.01**, < 0.001***, < 0.0001****. Source data are available online for this figure.
Figure 4
Figure 4. The asynchronous cholesterol biosynthesis pathway led to accumulation of distal cholesterol precursors.
(A) Transcriptional levels of Sqle, Cyp51 and Dhcr24 in CT26 cells and normal colon of BALB/c mice (n = 3). (B) ATAC-seq sequencing tracks of the 6000-bp regions centered at the transcription start site (TSS) of indicated genes from CT26 cells. (C) Knockout of Cyp51 in CT26 cells by sgRNA. Cyp51 protein level was first normalized to Gapdh level, and then normalized to sg-Ctrl. (D) Cell viability of Cyp51-KO CT26 cells (Cyp51-KO) and sg-control CT26 cells (sg-Ctrl). Two-tailed unpaired Student’s t test (n = 4). (E) Intensity of indicated distal cholesterol precursors in the control blank medium (Ctrl) and the conditioned media of Cyp51-KO CT26 cells (Cyp51-KO) and sg-control CT26 cells (sg-Ctrl) (n = 6). (F) IL-17a production of CD4+ T cells in the presence of control blank medium, Cyp51-KO CT26 CM, or sg-control CT26 CM. Two-tailed unpaired Student’s t test (n = 3). (G) Ectopic expression of Dhcr24 in CT26 cells. Dhcr24 protein level was first normalized to Gapdh level, and then normalized to EV. EV empty vector; Dhcr24-OE: Dhcr24-overexpression vector. (H) Cell viability of Dhcr24-OE CT26 cells and EV-control CT26 cells. Two-tailed unpaired Student’s t test (n = 3). (I) Intensity of indicated distal cholesterol precursors in control blank medium (Ctrl), EV CT26 CM and Dhcr24-OE CT26 CM. (n = 6). (J) IL-17a production of CD4+ T cells in the presence of control blank medium (Ctrl), EV CT26 CM, or Dhcr24-OE CT26 CM. Two-tailed unpaired Student’s t test (n = 3). Data information: in (A, DF, HJ), data are presented as mean ± SEM. In (A, E, I), two-tailed unpaired t test was used when variances were similar, whereas a two-tailed unpaired t test with Welch’s correction was used when variances were different. In (C, F, H, J), data are representative of two independent experiments. P levels < 0.05*, < 0.01**, < 0.001***, < 0.0001****. Source data are available online for this figure.
Figure 5
Figure 5. Cyp51 inhibition by ketoconazole suppressed CRC progression through a Th17-dependent mechanism.
(AC) Orthotopic CT26 transplant model. (A) Schematic illustration. (B) Tumor burden of orthotopic CT26 transplant MSS CRC in immune-competent BALB/c mice treated with ketoconazole (Keto) or vehicle control (Ctrl) (Ctrl, n = 11; Keto, n = 13; Data pooled from two independent experiments). Two-tailed unpaired Student’s t test. (C) Tumor burden of orthotopic CT26 transplant MSS-CRC in lymphocyte-deficient B-NDG mice treated with ketoconazole (Keto) or vehicle control (Ctrl) (Ctrl, n = 13; Keto, n = 14). Two-tailed unpaired Student’s t test. (DF) Subcutaneous CT26 model. (D) Schematic illustration. (E) Tumor progression of subcutaneous CT26 transplant MSS CRC in immune-competent BALB/c mice treated with ketoconazole (Keto) or vehicle control (Ctrl) (n = 15). Two-way ANOVA. (F) Tumor progression of subcutaneous CT26 transplant MSS CRC in lymphocyte-deficient B-NDG mice treated with ketoconazole (Keto) or vehicle control (Ctrl) (n = 5). Data are representative of two independent experiments. Two-way ANOVA. (GO) AOM/DSS induced CRC model of wildtype C57BL/6 mice. (G) Schematic illustration. (H) Representative images of mouse colon with tumors (arrows). (I, J) Cholesterol biosynthesis pathway of mouse AOM/DSS CRC tumor. (I) Gene set enrichment analysis (GSEA) of the cholesterol biosynthesis pathway in tumor tissues (n = 3) and adjacent normal tissues (n = 3). (J) GSEA rank metric scores and transcriptional levels of the cholesterol biosynthesis enzymes. Blue and red represents downregulation and upregulation in tumor. Two-tailed unpaired t test P value of gene expression between CRC tumors (n = 3) and normal tissues (n = 3) is labeled by the side of each gene. (K) Sterol profiles of mouse AOM/DSS CRC tumors and adjacent normal tissues. Treatment of ketoconazole (Keto) or vehicle control (Ctrl) was performed as shown in (G). The ratio of sterol intensity in tumor vs paired adjacent normal tissue (Tumor/Normal ratio) reflected accumulation of sterols in tumors. Mean value of each ratio is labeled under each graph. Two-tailed Mann–Whitney test (Ctrl, n = 12; Keto, n = 14). (L) Tumor burden of mice treated with ketoconazole (Keto, n = 27) or vehicle control (Ctrl, n = 29). Left panel, total number of tumors on colon. Two tailed Mann-Whitney test. Right panel, total tumor size indicated by sum of the diameter of each tumor. Two-tailed unpaired Student’s t test with Welch’s correction. (M) Colon length of mice treated with ketoconazole (Keto, n = 27) or vehicle control (Ctrl, n = 29). Two-tailed unpaired Student’s t test. (N) Th17 and Th1 infiltration in the colon of mice treated with ketoconazole (Keto) or vehicle control (Ctrl) (n = 20). Two-tailed unpaired Student’s t-test if data fitted a normal distribution, Mann–Whitney test if data did not fit a normal distribution. (O) Th17 and Th1 levels in the mesenteric lymph nodes of mice treated with ketoconazole (Keto) or vehicle control (Ctrl) (n = 20). Two-tailed unpaired Student’s t test if data fitted a normal distribution, Mann–Whitney test if data did not fit a normal distribution. Data pooled from three independent experiments (LO). (PS) AOM/DSS induced CRC model of Rorc+/- C57BL/6 mice. (P) Schematic illustration. (Q) Left panel, Th17 infiltration in the colon of CRC bearing Rorc+/- mice (RORγt-HT, n = 6) and wildtype mice (WT, n = 5). Right panel, Th17 infiltration in the mesenteric lymph nodes of CRC-bearing Rorc+/- mice (RORγt-HT, n = 7) and wildtype mice (WT, n = 6). Two-tailed unpaired Student’s t test with Welch’s correction. (R) Tumor burden of Rorc+/- or WT mice treated with ketoconazole (Keto) or vehicle control (Ctrl). Total tumor size was indicated by sum of the diameter of each tumor (WT-Ctrl, n = 7; WT-Keto, n = 7; RORγt-HT-Ctrl, n = 8; RORγt-HT-Keto, n = 8). Two-tailed unpaired Student’s t test if data fitted a normal distribution, Mann–Whitney test if data did not fit a normal distribution. (S) Colon length of Rorc+/- or WT mice treated with ketoconazole (Keto) or vehicle control (Ctrl) (WT-Ctrl, n = 7; WT-Keto, n = 7; RORγt-HT-Ctrl, n = 8; RORγt-HT-Keto, n = 8). Two-tailed unpaired Student’s t test. Data information: in (B, C, E, F, KO, QS), data are presented as mean ± SEM. P levels < 0.05*, < 0.01**, < 0.001***, < 0.0001****. Source data are available online for this figure.
Figure 6
Figure 6. Blocking DCP production of tumor cells suppressed MSS CRC progression and reshaped tumor immune microenvironment.
(A) Schematic illustration of the orthotopic CT26 model with Cyp51 knockout. (B) Tumor burden of orthotopic CT26 MSS CRC in BALB/c mice transplanted with Cyp51-KO CT26 cells (Cyp51-KO, n = 11) or sg-control CT26 cells (sg-Ctrl, n = 12). Two-tailed unpaired Student’s t test. Data are representative of two independent experiments. (C) Th17 population in the tumors of BALB/c mice orthotopically transplanted with Cyp51-KO CT26 cells (Cyp51-KO, n = 18) or sg-control CT26 cells (sg-Ctrl, n = 20). Data pooled from two independent experiments. Mann–Whitney test. (D) Tumor burden of orthotopic CT26 MSS CRC in B-NDG mice transplanted with Cyp51-KO CT26 cells (Cyp51-KO, n = 17) or sg-control CT26 cells (sg-Ctrl, n = 16). Data pooled from two independent experiments. Two-tailed unpaired Student’s t test (tumor size), Mann–Whitney test (tumor weight). (EL) scRNA-Seq analysis of the orthotopic CT26 tumors in BALB/c mice transplanted with Cyp51-KO CT26 cells (labeled as Cyp51KO) or sg-control CT26 cells (labeled as WT). (E) Uniform manifold approximation and projection (UMAP) plot of 17,674 cells from Cyp51KO and WT tumors, showing the formation of 20 main clusters. Each dot corresponds to a single cell and color represent different cell populations. NK natural killer cells, Teff effector T cells, Temra recently activated effector memory or effector T cells, Tex exhausted T cells, Treg regulatory T cells, DC dendritic cells. (F) Effects of Cyp51-KO on the tumor-infiltrating lymphocyte compartments. (G) Effects of Cyp51-KO on the tumor-infiltrating myeloid cell compartments. (H) Circos plots showing cell-cell interaction networks which were sourced from Th17 cluster, line width indicates the number of interacting cytokine-receptor pairs between linked cell clusters. (I) Violin plot showing the expression level of Il17a in Th17 cells (WT, n = 134; Cyp51KO, n = 192 cells). (J) Violin plot showing the MDSC score in neutrophiles (WT, n = 447; Cyp51KO, n = 551 cells). (K) Violin plot showing the MDSC score in macrophages (WT, n = 261; Cyp51KO, n = 315 cells). (L) Violin plot showing the exhaustion score in exhausted CD8+ T cells (WT, n = 1248; Cyp51KO, n = 982 cells). Data information: in (BD), data are presented as mean ± SEM. In (IL), box indicates the interquartile range (25–75%); center line indicates the median; Wilcoxon rank-sum test. P levels < 0.05*, < 0.01**, < 0.0001****. Source data are available online for this figure.
Figure EV1
Figure EV1. Caco2 cells polarized Th17 cells without affecting other T cell subtypes.
(AC) Th17 (A), Th1 (B), and Treg (C) induction in the presence of the conditioned medium of Caco2 cells. Naive CD4+ T cells were stimulated with plate-bound anti-CD3/CD28 and cytokines to induce Th17, Th1 or Treg differentiation. Concentrated conditioned medium (CM) or control blank medium (Ctrl) (2.5% v/v) was added in on Day 2. Th17 (IL-17a+ gated on CD4+), Th1 (IFNγ+ gated on CD4+), and Treg (Foxp3+ gated on CD4+) percentages were analyzed on Day 4 (n = 4). (D, E) CD8+ T cell effector functions in the presence of the conditioned medium of Caco2 cells. Naive CD8+ T cells were stimulated with plate-bound anti-CD3/CD28. Concentrated conditioned medium (CM) or control blank medium (Ctrl) (2.5% v/v) was added in on Day 1. CD8+ T cell function (D) IFNγ+ gated on CD8+; (E) GzmB+ gated on CD8+ was analyzed on Day 2 (n = 4). (F) CD8+ T cell activation in the presence of the conditioned medium of Caco2 cells. Naive CD8+ T cells were stimulated with plate-bound anti-CD3/CD28, in the presence of concentrated conditioned medium (CM) or control blank medium (Ctrl) (2.5% v/v). CD8+ T cell activation (CD44+ gated on CD8+) was analyzed on Day 1. (n = 4). Data information: in (AF), data are presented as mean ± SEM. Representative flow cytometry plots are shown in the left and corresponding quantified data in the right; two-tailed unpaired Student’s t test. Data are representative of two independent experiments. P level < 0.01**. Source data are available online for this figure.
Figure EV2
Figure EV2. Accumulation of distal cholesterol precursors in the tumor microenvironment of MSS CRC.
(A) Intensity of sterols in the interstitial fluid of human MSS CRC tumors (T-IF) and paired adjacent normal tissues (N-IF). Fold change of the mean level of each sterol in tumor interstitial fluid vs normal tissue interstitial fluid (T/N) is labeled under each graph (n = 36). (B) Th1 induction in the presence of desmosterol at different concentrations. Naive CD4+ T cells were stimulated with plate-bound anti-CD3/CD28 and cytokines to induce Th1 differentiation, in the presence of desmosterol or vehicle control. Th1 (IFNγ+ gated on CD4+) polarization were analyzed on Day 4 (n = 4). (C) Treg induction in the presence of desmosterol at different concentrations. Naive CD4+ T cells were stimulated with plate-bound anti-CD3/CD28 and cytokines to induce Treg differentiation, in the presence of desmosterol or vehicle control. Treg (Foxp3+ gated on CD4+) polarization were analyzed on Day 4 (n = 3). (D) Th17 induction in the presence of desmosterol at different concentrations. Naive CD4+ T cells from Rorc-/- (RORγt-KO), Rorc+/- (RORγt-HT) or Rorc+/+ (WT) mice were stimulated plate-bound anti-CD3/CD28 and cytokines to induce Th17, in the presence of desmosterol or vehicle control. Th17 (IL-17a+ gated on CD4+) percentage was analyzed on Day 4 (n = 4). (E, F) CD8+ T cell function in the presence of desmosterol at different concentrations. Naive CD8+ T cells were stimulated with plate-bound anti-CD3/CD28, in the presence of desmosterol or vehicle control. CD8+ T cell function (E) IFNγ+ gated on CD8+; (F) GzmB+ gated on CD8+ were analyzed on Day 2 (n = 4). (G) CD8+ T cell activation in the presence of desmosterol at different concentrations. Naive CD8+ T cells were stimulated with plate-bound anti-CD3/CD28, in the presence of desmosterol or vehicle control. CD8+ T cell activation (CD44+ gated on CD8+) were analyzed on Day 1 (n = 4). (H) Absolute quantification of zymosterol and 7-dehydrocholesterol in the interstitial fluid of human MSS CRC tumors (T-IF) and paired adjacent normal tissues (N-IF). Fold change of the mean level of indicated sterol in tumors interstitial fluid vs normal tissue interstitial fluid (IF T/N) is labeled under graph (n = 9). (I, J) Intensity of indicated distal cholesterol precursors in the control blank medium (Ctrl) and the conditioned media of mouse MSS CRC cell CT26 (n = 10), mouse MSI CRC cell MC38 (n = 10), human MSS CRC cell Caco2 (n = 6), and human MSI CRC cell HCT116 (n = 6). Two-tailed unpaired t test was used when variances were similar, whereas a two-tailed unpaired t test with Welch’s correction was used when variances were different. (K) Intensities of the 13C-labeled sterols in CT26 and MC38 cells (n = 6). Two-tailed unpaired t test was used when variances were similar, whereas a two-tailed unpaired t test with Welch’s correction was used when variances were different. (L) Th17 induction in the presence of the conditioned medium of MC38 cells (n = 3). (M) Intensity of the sterols in the plasma samples of human MSS CRC patients before (Pre) and after (Post) surgical resection of tumors. Fold change of the mean level of each sterol in plasma before vs after surgical resection (Pre/Post) is labeled under each graph (n = 8). Data information: in (AM), data are presented as mean ± SEM. In (BG, L) two-tailed unpaired Student’s t test; data are representative of two independent experiments. In (A, H, M), two-tailed Wilcoxon matched-pairs signed-rank test. P levels < 0.05*, < 0.01**, < 0.001***, < 0.0001****. Source data are available online for this figure.
Figure EV3
Figure EV3. MSS CRC and MSI CRC had different programs of cholesterol metabolism.
(A) Left: GSEA of cholesterol biosynthesis pathway in MSI-H CRC tumors (n = 89) and MSS CRC tumors (n = 294) in COAD. Right: GSEA rank metric score and transcriptional levels of enzymes in the cholesterol biosynthesis pathway. Blue and red represents downregulation and upregulation in tumor. P value of gene expression between tumor and normal tissue (two tailed Mann–Whitney test) is labeled by the side of each gene. (ns P > 0.05, *P ≤ 0.05, **P < 0.01, ***P < 0.001, ****P < 0.0001). (B) Transcriptional levels of LDLR in MSI tumors (MSI-H-T, n = 89) and MSS tumors (MSS-T, n = 294) from the COAD database. Whiskers denote minimum to maximum. Box indicates the interquartile range (25–75%); center line indicates the median. “+” indicates mean. Two tailed Mann–Whitney test. Source data are available online for this figure.
Figure EV4
Figure EV4. Recapitulation of the asynchronous upregulation pattern of the cholesterol biosynthesis pathway in MSI CRC MC38 cells.
(A) Schematic illustration of the experimental procedure. (B) Transcriptional levels of Sqle, Cyp51 and Dhcr24 in wildtype (WT) and the genetic manipulated MC38 cells as described in panel A (nSrebp2), n = 3. (C) Intensity of indicated distal cholesterol precursors in the control blank medium (Ctrl), and the conditioned media of MC38 cells, n = 8. Two-tailed unpaired Student’s t test if data fitted a normal distribution, Mann–Whitney test if data did not fit a normal distribution. (D) Th17 induction with CM of above-mentioned cells or CT26-CM as positive control, n = 3, two-tailed unpaired Student’s t test. Data information: in (BD), data are presented as mean ± SEM. P levels < 0.01**, < 0.001***, < 0.0001****. Source data are available online for this figure.
Figure EV5
Figure EV5. Single-cell analysis of CT26 tumors (WT or Cyp51KO) in BALB/c mice as described in Fig. 6.
(A) Heatmap showing the gene expression levels of chemokines/growth factors and related receptors across all cell clusters. Z-score was calculated by mean expression level and indicated by color. (B) Violin plot showing the MDSC score in all cell clusters. The neutrophils and macrophages are major contributor of the suppressive function of myeloid derived suppressive cells (MDSC) (Dysthe and Parihar, 2020) in tumor. (C) Heatmap showing the expression levels of tumor growth/metastasis related genes across myeloid cell populations. Z-score was calculated by mean expression level and indicated by color. (D) Heatmap showing the expression levels of immunosuppression related genes across myeloid cell populations. Z-score was calculated by mean expression level and indicated by color. (E) Heatmap showing the expression levels of immune checkpoint genes across all cell populations. Z-score was calculated by mean expression level and indicated by color.

References

    1. Akbay EA, Koyama S, Liu Y, Dries R, Bufe LE, Silkes M, Alam MM, Magee DM, Jones R, Jinushi M, et al. Interleukin-17A promotes lung tumor progression through neutrophil attraction to tumor sites and mediating resistance to PD-1 blockade. J Thorac Oncol. 2017;12:1268–1279. doi: 10.1016/j.jtho.2017.04.017. - DOI - PMC - PubMed
    1. Benjamini Y, Hochberg Y. Controlling the false discovery rate - a practical and powerful approach to multiple testing. J R Stat Soc B. 1995;57:289–300.
    1. Borst J, Ahrends T, Babala N, Melief CJM, Kastenmuller W. CD4(+) T cell help in cancer immunology and immunotherapy. Nat Rev Immunol. 2018;18:635–647. doi: 10.1038/s41577-018-0044-0. - DOI - PubMed
    1. Brown MS, Radhakrishnan A, Goldstein JL. Retrospective on cholesterol homeostasis: the central role of Scap. Annu Rev Biochem. 2018;87:783–807. doi: 10.1146/annurev-biochem-062917-011852. - DOI - PMC - PubMed
    1. Codarri L, Gyulveszi G, Tosevski V, Hesske L, Fontana A, Magnenat L, Suter T, Becher B. RORgammat drives production of the cytokine GM-CSF in helper T cells, which is essential for the effector phase of autoimmune neuroinflammation. Nat Immunol. 2011;12:560–567. doi: 10.1038/ni.2027. - DOI - PubMed