. 2024 Feb;16(2):386-415.
doi: 10.1038/s44321-023-00017-7. Epub 2024 Jan 2.

Apelin-VEGF-C mRNA delivery as therapeutic for the treatment of secondary lymphedema

Affiliations

Apelin-VEGF-C mRNA delivery as therapeutic for the treatment of secondary lymphedema

Justine Creff et al. EMBO Mol Med. 2024 Feb.

Abstract

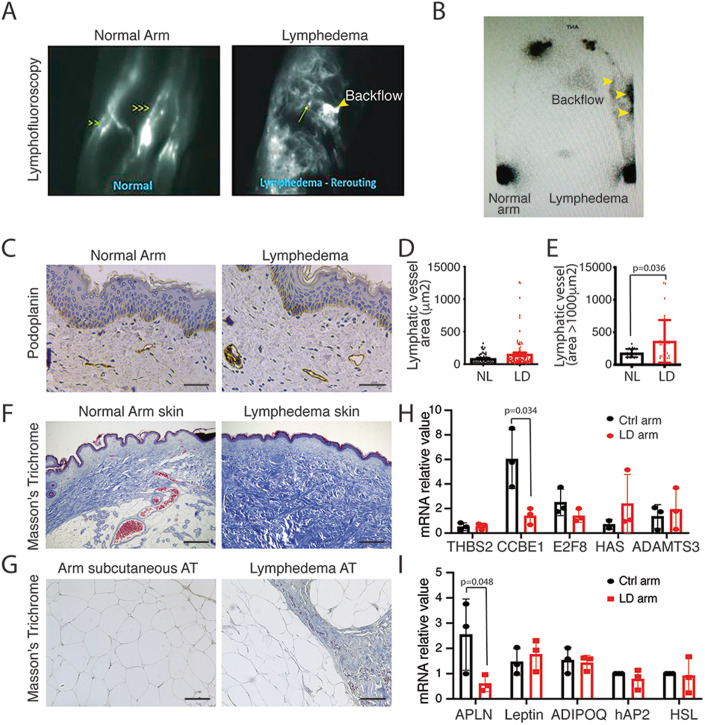
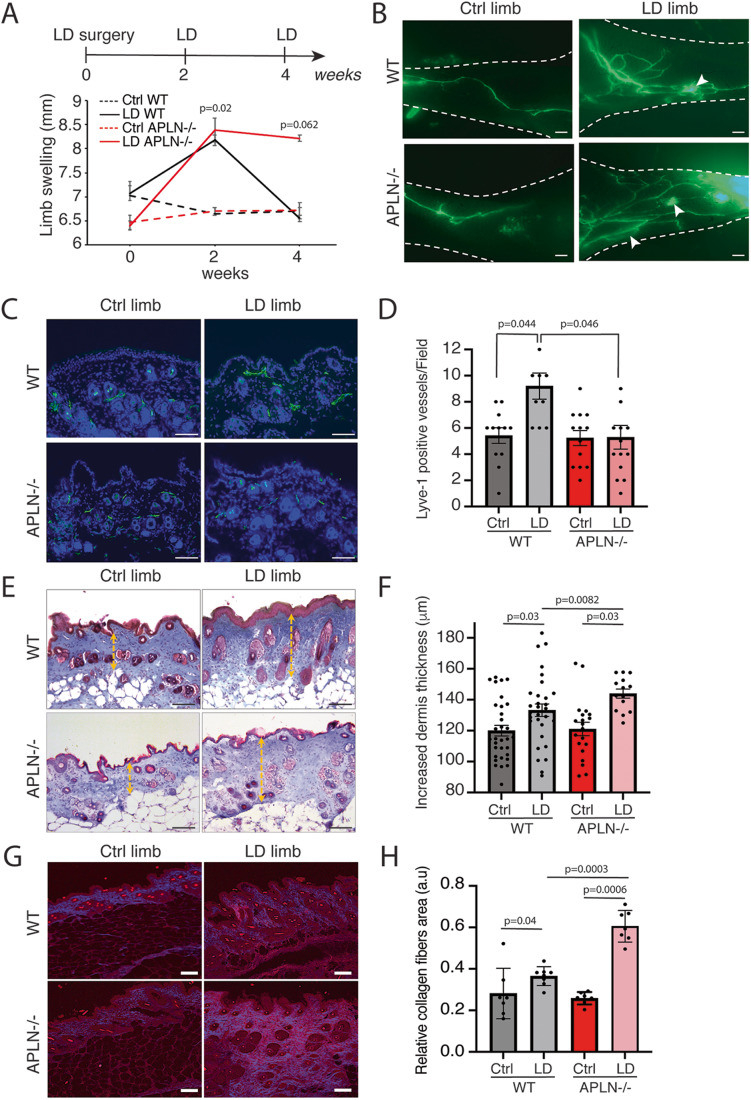
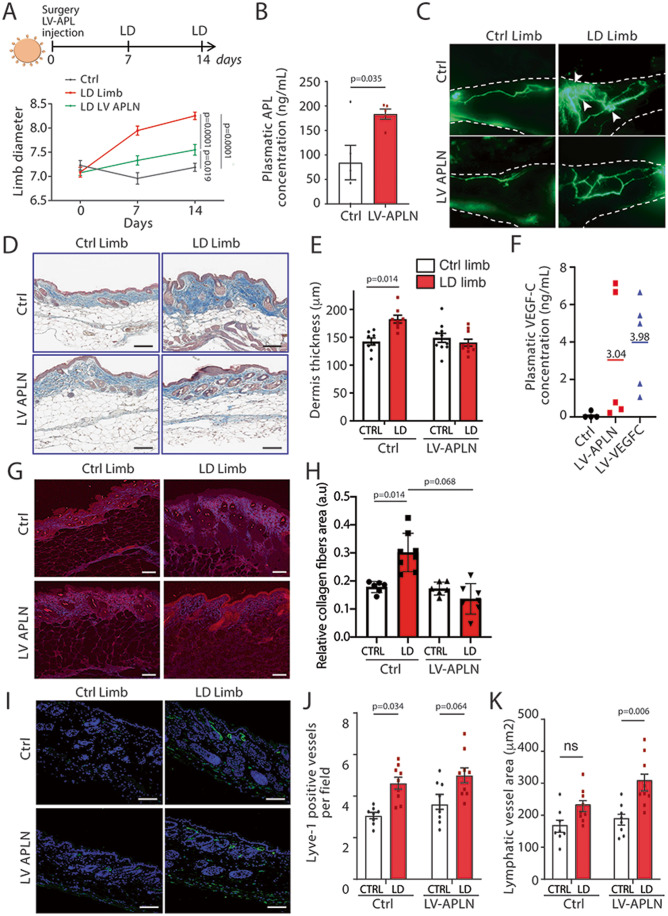
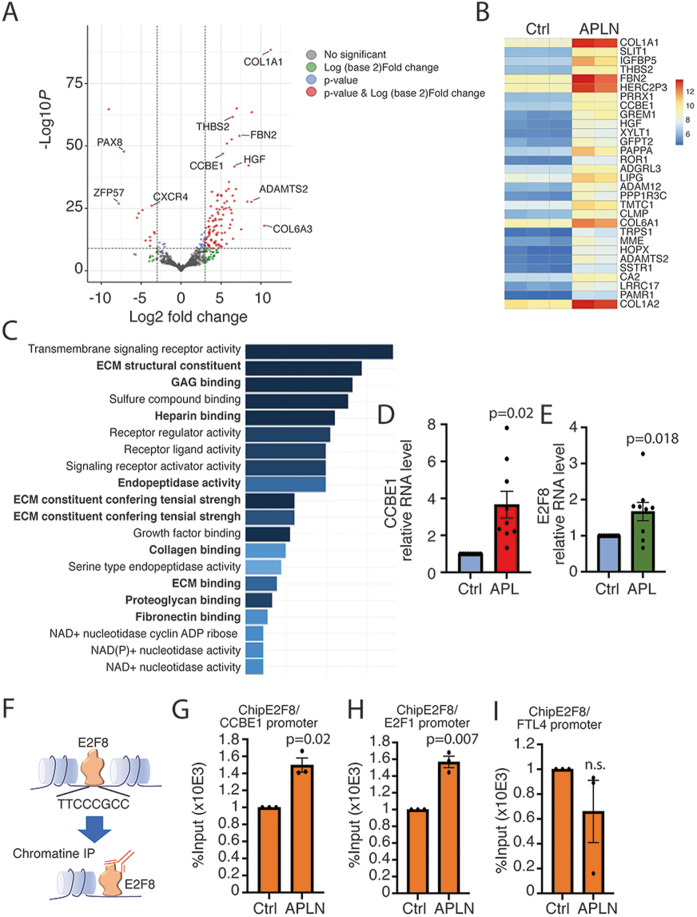
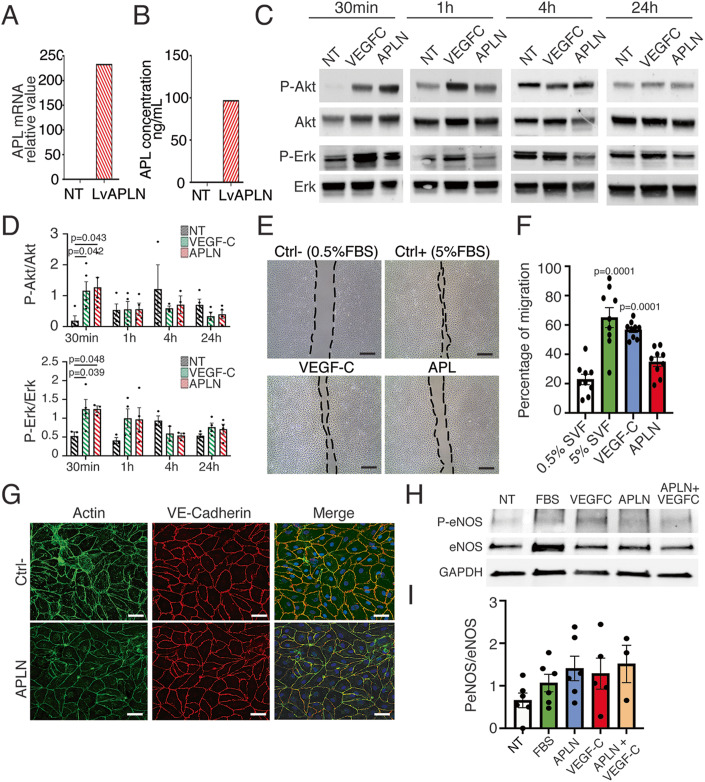
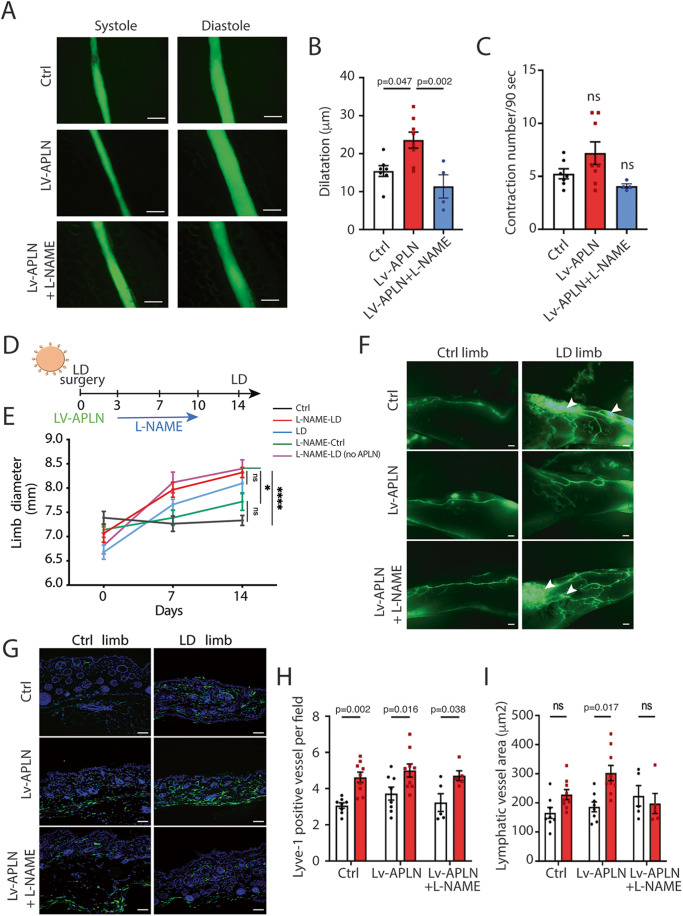
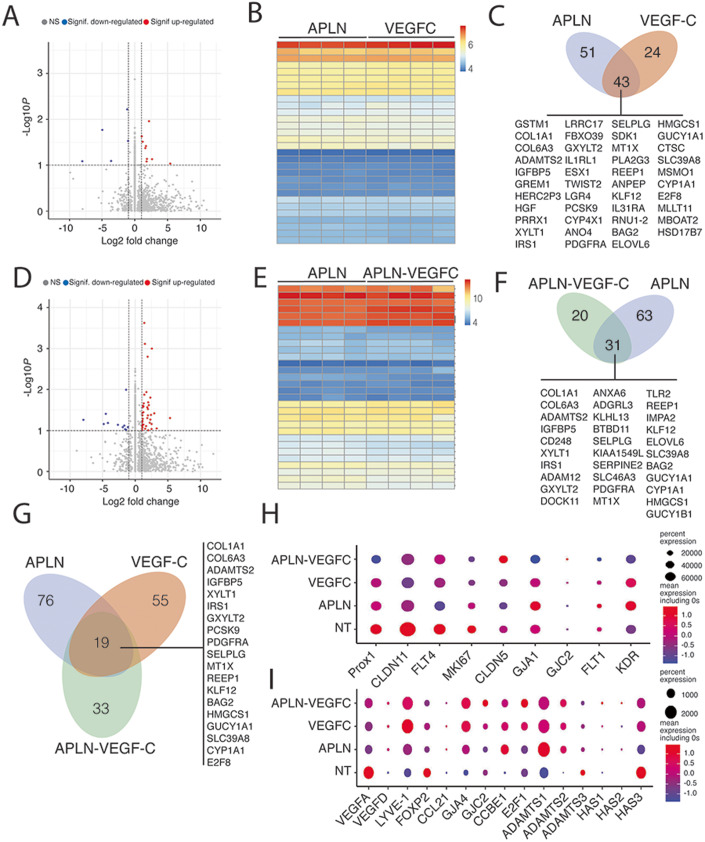
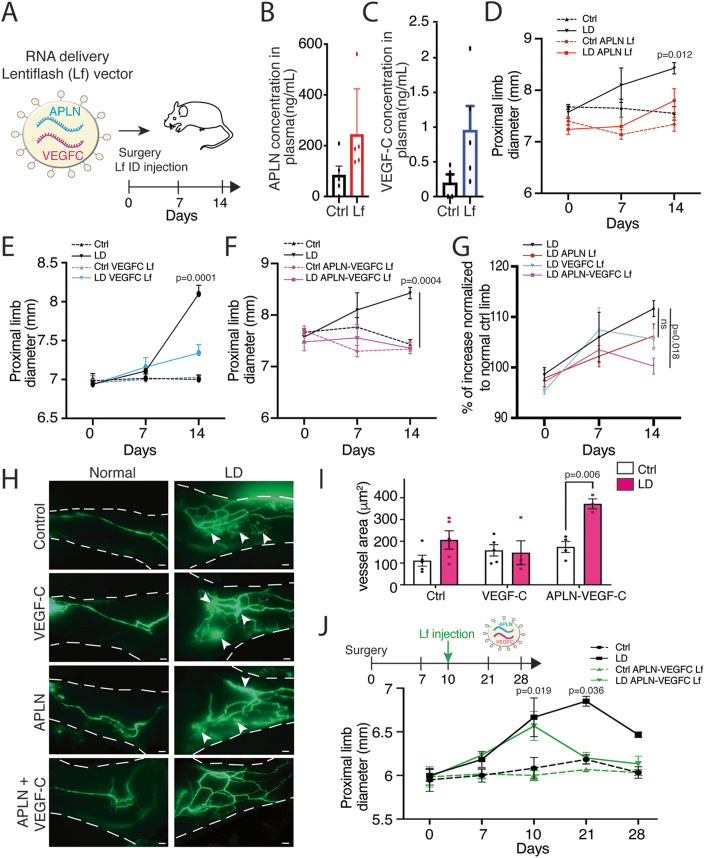
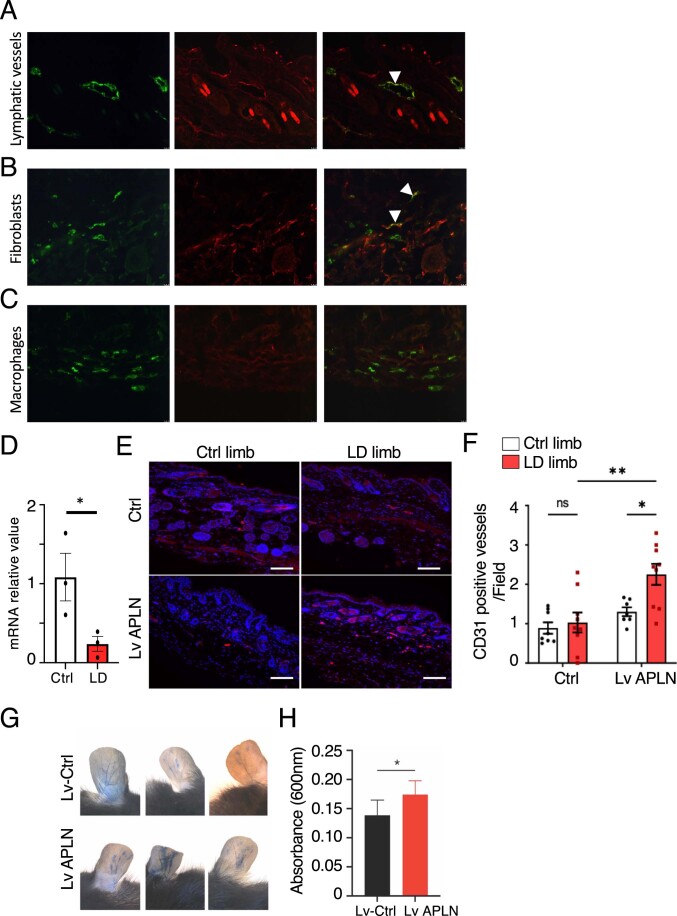
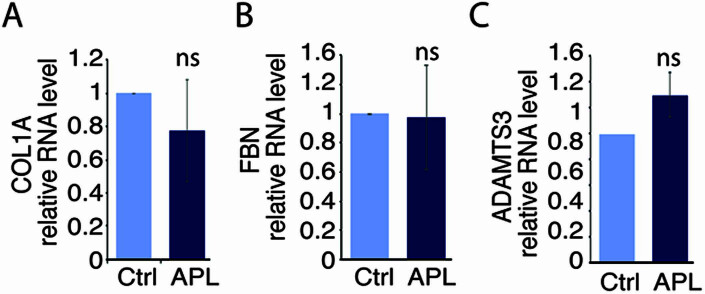
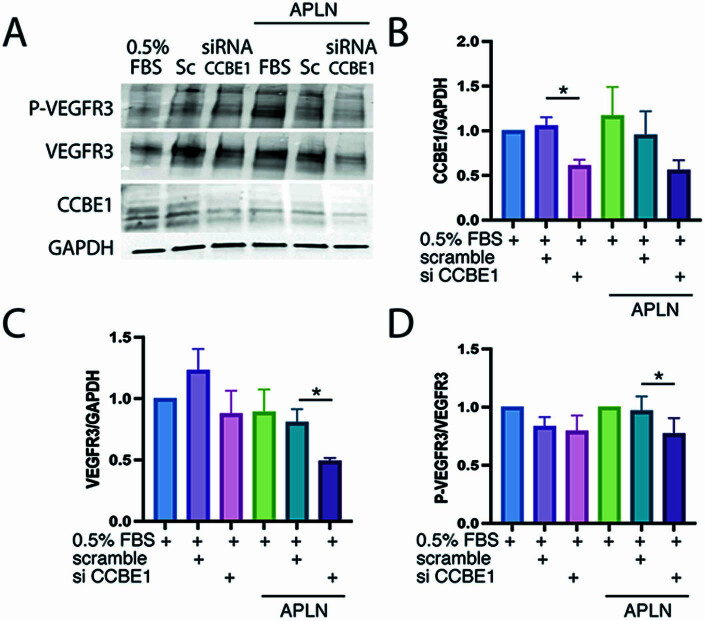
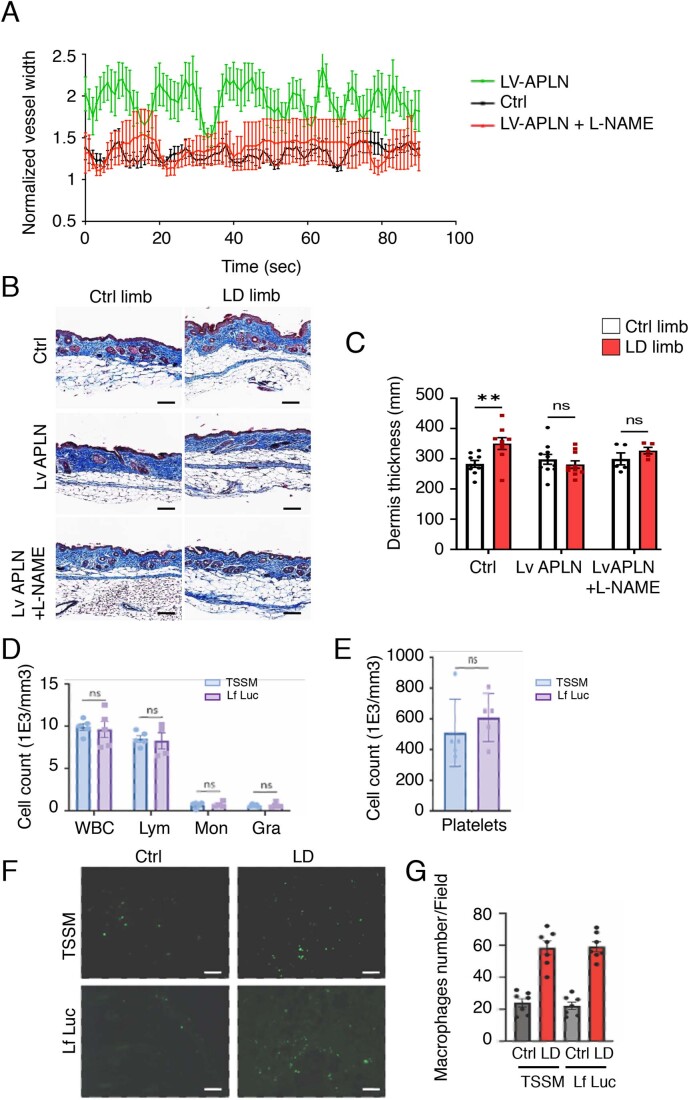
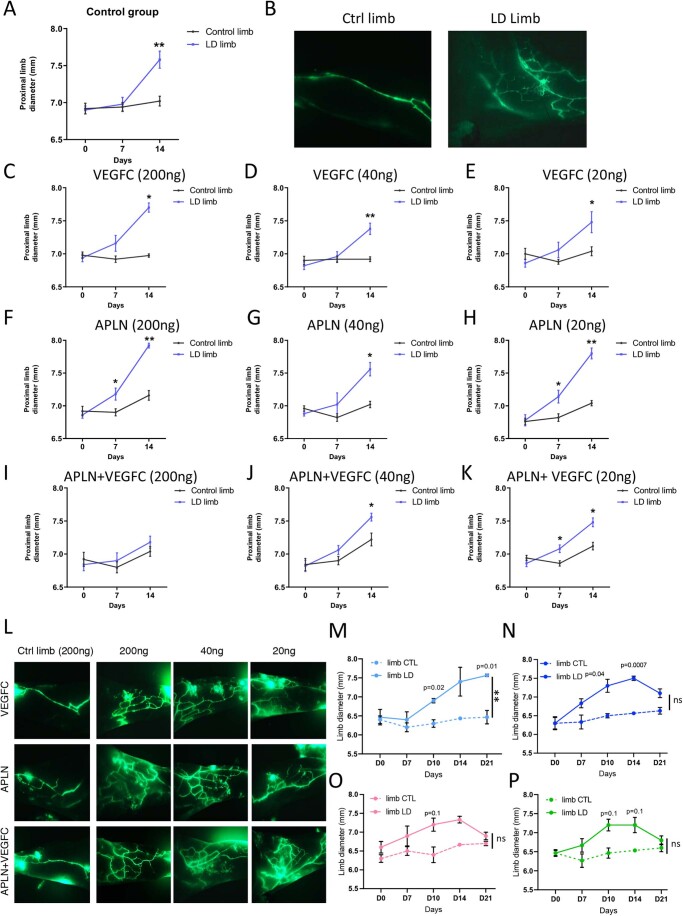
Secondary lymphedema (LD) corresponds to a severe lymphatic dysfunction leading to the accumulation of fluid and fibrotic adipose tissue in a limb. Here, we identified apelin (APLN) as a powerful molecule for regenerating lymphatic function in LD. We identified the loss of APLN expression in the lymphedematous arm compared to the normal arm in patients. The role of APLN in LD was confirmed in APLN knockout mice, in which LD is increased and associated with fibrosis and dermal backflow. This was reversed by intradermal injection of APLN-lentivectors. Mechanistically, APLN stimulates lymphatic endothelial cell gene expression and induces the binding of E2F8 transcription factor to the promoter of CCBE1 that controls VEGF-C processing. In addition, APLN induces Akt and eNOS pathways to stimulate lymphatic collector pumping. Our results show that APLN represents a novel partner for VEGF-C to restore lymphatic function in both initial and collecting vessels. As LD appears after cancer treatment, we validated the APLN-VEGF-C combination using a novel class of nonintegrative RNA delivery LentiFlash® vector that will be evaluated for phase I/IIa clinical trial.

Keywords: Apelin; Collector; VEGF-C; lymphedema; mRNA.


Conflict of interest statement

The authors declare no competing interests.

Figures

Figure 1
Figure 1. Reduced APLN expression in human LD.
(A) Lymphofluoroscopy of the upper limb LD shows dermal lymph backflow associated with hypervascularization of tortuous initial lymphatics (right panel) compared to normal arm (left panel). (B) Lymphoscintigraphy of woman who developed LD after breast cancer shows reduced but lasting lymphatic drainage and lymph node perfusion. (C) Immunodetection of the lymphatic networks in the LD skin shows dilated lymphatic vessels (scale bar: 50 μm) (n = 8). (D) Quantification of the lymphatic vessel diameters. Data represent mean ± SEM (n = 8). (E) Quantification of the dermis lymphatic density. Data represent mean ± SEM of three biological replicates (unpaired t test; *P < 0.05). (F) Masson’s trichome staining of the human lymphedematous skin shows strong fibrosis (scale bar: 50 μm) (n = 8). (G) Masson’s trichome staining of the human LD subcutaneous AT shows fibrosis (scale bar: 50 μm) (n = 8). (H) Quantitative RT-PCR analysis of the genes involved in fibrosis and VEGF-C maturation in dermolipectomy samples from patients with LD. Data represent mean ± SEM of three biological replicates (paired t test; P = O.O34. (I) Quantitative RT-PCR analysis of the adipokines in dermolipectomy samples from patients with LD. Data represent mean ± SEM of three biological replicates (paired t test; P = 0.058). Source data are available online for this figure.
Figure 2
Figure 2. LD increases in APLN-KO mice.
(A) Schematic of the experimental design of secondary LD mice model. Quantification of proximal limb swelling 2 and 4 weeks after surgery on control limb, LD limb from APLN-KO mice and control littermates. Data represent mean ± SEM (n = 9) (two-way ANOVA). (B) Lymphangiography reveals dermal backflow (white arrows) and pathological remodeling of lymphatic vessel after LD in APLN-KO mice 4 weeks post surgery (scale bar: 1 mm). (C) Lyve1 immunodetection of the skin lymphangiogenesis in APLN-KO mice (scale bar: 50 μm). (D) Quantification of lymphangiogenesis in the skin from APLN-KO mice. Data represent mean ± SEM (n = 10–14 mice) (one-way ANOVA). (E) Masson’s trichrome staining of LD in APLN-KO mice (scale bar: 50 μm). (F) Quantification of dermis fibrosis in APLN-KO mice 4 weeks post surgery. Data represent mean ± SEM (n = 5) (one-way ANOVA). (G) SHG signal from deep, collagen-rich layer within dermis (scale bar: 50 μm). (H) Quantification of the relative collagen area. Data represent mean ± SEM (n = 7–8) (one-way ANOVA). Source data are available online for this figure.
Figure 3
Figure 3. APLN prevents secondary LD.
(A) Schematic of the experimental design of secondary LD model in mice injected APLN lentivector (LV-APLN). Quantification of proximal limb swelling at 7 and 14 days after surgery on the control limb, LD limb (n = 17) or LD treated with APLN lentivector (n = 20). Data represent mean ± SEM (two-way ANOVA). (B) EIA dosage of circulating APLN in plasma of control (n = 5) or APLN-treated mice (n = 5). Data represent mean ± SEM (unpaired t test). (C) Lymphangiography reveals pathological remodeling of lymphatic vessels and dermal backflow in LD that is reversed by LV-APLN (n = 10) (scale bar: 1 mm). (D) Masson’s trichrome staining of the skin from mice with LD treated or not with APLN (scale bar: 50 μm). (E) Quantification of dermis thickness. Data represent mean ± SEM (n = 5) (two-way ANOVA). (F). EIA dosage of circulating VEGF-C in plasma of control (n = 5) or APLN-treated mice (n = 5). (G) SHG signal from deep, collagen-rich layer within dermis (scale bar: 50 μm). (H) Quantification of the relative collagen area. Data represent mean ± SEM (n = 6–8) (two-way ANOVA). (I) Lyve1 immunodetection of the skin lymphangiogenesis in APLN-treated mice (scale bar: 50 μm). (J) Quantification of lymphangiogenesis in APLN-treated mice. Data represent mean ± SEM (Ctrl n = 8, LD n = 9) (two-way ANOVA). (K) Quantification of lymphatic dilatation in APLN-treated mice. Data represent mean ± SEM (Ctrl n = 8, LD n = 9) (two-way ANOVA). Source data are available online for this figure.
Figure 4
Figure 4. APLN controls lymphatic endothelial cell gene expression.
(A) Bulk RNA sequencing in HDLEC treated with APLN-conditioned medium. Volcano plot showing log2FC (fold change) values calculated between control and APLN-treated HDLECs for 24 h. Red and blue dots: significantly (P value adjusted  <  0.05) up- (log2FC > 0.5) and downregulated genes (log2FC < -0.5), respectively. (B) Heatmap of the top 30 significantly upregulated genes (P value adjusted < 0.05 and log2FC > 0.5). Expression levels are plotted as log10 normalized counts for each sample. Red represents higher FC; Dark blue represents lower FC. (C) Top significantly (FDR  <  0.05) enriched Gene Ontology (GO) terms for biological processes of significantly upregulated genes after APLN treatment at 24 h time point. (D, E) qRT-PCR validation of CCBE1 (D) and E2F8 (E) in APLN-stimulated HDLEC. Data represent mean ± SEM (three independent replicates)(unpaired t test). (F) Schematic representation of chromatin immunoprecipitation (Chip) by E2F8. (G) Chip analysis of E2F8 on CCBE1 promoter. Data represent mean ± SEM (three independent replicates) (unpaired t test). (H) Chip analysis of E2F8 on E2F1 promoter. Data represent mean ± SEM (three independent replicates) (unpaired t test). (I) Chip analysis of E2F8 on Flt4 promoter. Data represent mean ± SEM (three independent replicates) (unpaired t test, ns non significant). Source data are available online for this figure.
Figure 5
Figure 5. APLN plays a role in LD through Akt/eNOS activation in lymphatic endothelial cells.
HDLEC were treated in vitro with conditioned media of NIH3T3 cells infected APLN lentivector. (A) Relative expression of APLN in NIH3T3 evaluated by RT-qPCR on NIH3T3 transduced by APLN lentivector. Data represent pool of Lv-transduced cells. (B) Expression of APLN in conditioned media evaluated by EIA. Data represent pool of Lv-transduced cells. (C) Representative phospho-AKT/AKT and phosphor-Erk/Erk immunoblots of HDLEC treated with FBS, conditioned medium containing VEGF-C or APLN. (D) Graphs represent quantification of phospho/total protein ratio of at least three independent experiments. All graphical data are mean ± SEM. *P < 0.05, two-way ANOVA. (E) Representative images of scratch wound healing assay on HDLEC stimulated by VEGF-C or APLN. (scale bar: 100 μm). (F) Quantification of migration. Data represent mean ± SEM (n = 9) (one-way ANOVA). (G) F-actin and VE-Cadherin immunostaining of HDLEC after APLN treatment reveals no effect on lymphatic endothelial monolayer junctions (n = 3) (scale bar: 25 μm). (H) Representatives phospho-eNOS/eNOS immunoblots of HDLEC treated with FBS, conditioned medium containing VEGF-C or APLN. (I) Graphs represent quantification of phospho/total protein ratio of at least three independent experiments. Data represent mean ± SEM (n = 6) (one-way ANOVA). Source data are available online for this figure.
Figure 6
Figure 6. APLN-induced vasodilatation of lymphatic vessels is mediated by eNOS signaling.
(A) Contractile activity of collecting lymphatic vessels in control mice (n = 7) treated with APLN lentivector (n = 8) and L-NAME (n = 4) was investigated by filming autonomous collecting vessel contraction in vivo (scale bar: 100 μm). (B, C) graphs represent the number of vessel contractions per film (90 s) and the dilatation of collecting lymphatic vessels (differences between maximum and minimum diameter). Data represent mean ± SEM (n = 8) (one-way ANOVA). (D) Schematic of the experimental design of secondary LD mice model. (E) Quantification of proximal limb swelling at 7 and 14 days after surgery on control limb, LD limb (n = 9) or LD treated with APLN lentivector (n = 10) followed or not by treatment with L-NAME (n = 5). Data represent mean ± SEM (two-way ANOVA). (F) Representative images of lymphangiography from mice treated with LV-APLN and L-NAME. (scale bar: 1 mm). (G) Skin sections were stained with Lyve1 (green) to assess the number of lymphatic capillaries in control (n = 9), LV-APLN (n = 9) or LV-APLN + L-NAME (n = 5) treated mice. (scale bar: 50 μm). (H, I) Graphs show the number of lymphatic vessels (Lyve1+) (H) and the vasodilatation (vessel area) (I) according the experimental conditions. Data represent mean ± SEM (n = 8) (two-way ANOVA). Source data are available online for this figure.
Figure 7
Figure 7. APLN and VEGF-C exhibit complementary effects on lymphatic endothelial cells.
Comparison of bulk RNA sequencing in HDLEC treated with APLN-, VEGF-C-, or APLN + VEGF-C-conditioned media. (AC) Bulk RNA sequencing in HDLEC treated with APLN- and VEGF-C-conditioned medium. (A) Volcano plot showing log2FC (fold change) values calculated between APLN- and VEGF-C-treated HDLECs. Red and blue dots: significantly (P value adjusted  <  0.05) up- (log2FC > 0.5) and downregulated genes (log2FC < -0.5), respectively. (B) Heatmap comparison of the top 30 significantly regulated genes in APLN- and VEGF-C-treated HDLEC. (C) Schematic representation of the number of genes upregulated (43) by both APLN and VEGF-C. (D, E) Bulk RNA sequencing in HDLEC treated with APLN and APLN-VEGF-C-conditioned medium. (D) Volcano plot showing log2FC (fold change) values calculated between APLN- and APLN-VEGF-C-treated HDLECs. Red and blue dots: significantly (P value adjusted  <  0.05) up- (log2FC > 0.5) and downregulated genes (log2FC < -0.5), respectively. (E) Heatmap comparison of the top 30 significantly regulated genes in APLN- and APLN-VEGF-C-treated HDLEC. (F) Schematic representation of the number of genes upregulated (31) by both APLN and APLN-VEGF-C. (G) Schematic representation of the number of genes upregulated (19) by both APLN, VEGF-C, and APLN + VEGF-C. (H) Dot plots showing the expression of known lymphatic markers in nontreated (NT), APLN, VEGF-C and APLN + VEGF-C-treated HDLEC. (I) Dot plots showing the expression of known lymphatic markers in NT, APLN, VEGF-C, and APLN + VEGF-C-treated HDLEC. Source data are available online for this figure.
Figure 8
Figure 8. APLN-VEGF-C mRNA delivery: a new treatment option for LD.
(A) Schematic representation of the experimental procedure. Lentiflash-containing 2 mRNA (APLN and VEGFC) is injected intradermally at the time of the surgery. (B, C) EIA dosage of circulating APLN (B) and VEGF-C (C) in plasma of control (n = 5) or LentiFlash®-treated mice Data represent mean ± SEM (5 independent replicates) (unpaired t test). (D) Quantification of proximal limb swelling at 7 and 14 days after surgery on control and LD limb from nontreated mice (black) or mice treated with APLN LentiFlash® vector (red). Data represent mean ± SEM (n = 10) (two-way ANOVA). (E) Quantification of proximal limb swelling 7 and 14 days after surgery on and LD limb from nontreated mice (black) or mice treated with VEGF-C LentiFlash® vector (blue). Data represent mean ± SEM (n = 10) (two-way ANOVA). (F) Quantification of proximal limb swelling 7 and 14 days after surgery on control and LD limb from nontreated mice (black) or mice treated with APLN-VEGF-C LentiFlash® vector (pink). Data represent mean ± SEM (n = 10) (two-way ANOVA). The same control group was used in 8D and 8 F. (G) Percentage of increase in LD limb compared to the normal limb on the same mouse after treatment with APLN, VEGF-C, or APLN + VEGF-C LentiFlash® vector. Data represent mean ± SEM (n = 10) (two-way ANOVA). (H) Representatives images of lymphangiography from mice treated with VEGF-C-, APLN-, or APLN-VEGF-C LentiFlash® vectors. (scale bar: 1 mm). (I) Quantification of lymphatic dilatation in APLN-VEGF-C-treated mice. Data represent mean ± SEM (n = 9) (two-way ANOVA). (J) Quantification of proximal limb swelling in mice treated with APLN-VEGF-C LentiFlash® vector after LD development (10 days post surgery). Data represent mean ± SEM (n = 8) (two-way ANOVA). Source data are available online for this figure.
Figure EV1
Figure EV1. Effect of APLN vector on skin angiogenesis.
(A) Skin section staining with Lyve1 (green) and APJ (red). Scale bar = 50 µm. (B) Skin section staining with vimentin (green) and APJ (red). Scale bar = 50 µm. (C) Skin section staining with CD68 (green) and APJ (red). Scale bar = 50 µm. (D) APLN mRNA expression in skin from ctrl and LD limb. Data represent mean ± SEM (n = 3) (*P < 0.05, unpaired t test). (E) Skin sections of control or LD limb from LV-APLN-treated mice were stained for CD31 (red). DNA was stained with DAPI. Scale bar = 100 µm. (F) Quantification of blood vessels per field according the limb and treatment of mice. Data represent mean ± SEM (n = 9 control and n = 8 APLN-treated mice) (*P < 0.05, **P < 0.01, one-way ANOVA). (G) Vascular permeability assay by Evans blue extravasation. Left ear intradermally injected with 2 µL of control lentivector, right ear injected with 2 µL of APLN lentivector. (H) Quantification of extravasated Evans blue dye. Data represent mean ± SEM (*P < 0.05, unpaired t test).
Figure EV2
Figure EV2. Gene expression in APLN-stimulated HDLEC.
(AC). RT-qPCR showing the expression of COL1A (A), FBN (B), and ADAMTS3 (C) in APLN-stimulated HDLEC. Data represent mean ± SEM (ns=non significant, unpaired t test).
Figure EV3
Figure EV3. Stimulation of VEGFR3 phosphorylation by APLN.
(A) Representatives phospho-VEGFR3/VEGFR3 and CCBE1 immunoblots of HDLEC treated with APLN +/− siRNA CCBE1. (B) Graphs represent quantification of CCBE1/GAPDH protein ratio from at least three independent experiments. Data represent mean ± SEM (n = 3 independent replicates) (*P < 0.05, two-way ANOVA). (C) Graphs represent quantification of VEGFR3/GAPDH protein ratio from at least three independent experiments. Data represent mean ± SEM (n = 3 independent replicates) (*P < 0.05, two-way ANOVA). (D) Graphs represent quantification of phospho/total protein ratio of VEGFR3 from at least three independent experiments. Data represent mean ± SEM (n = 3 independent replicates) (*P < 0.05, two-way ANOVA).
Figure EV4
Figure EV4. Effect of L-NAME on dermis fibrosis.
(A) Graph represent mean vessel width normalized to the minimum vessel width. (LV-APLN n = 8, Ctrl n = 7 and LV-APLN + L-NAME n = 4). (B) Fibrosis was evaluated by Masson’s trichrome staining of the skin in control mice (n = 9) treated with APLN lentivector (n = 9) and LV-APLN + L-NAME (n = 5). (scale bar: 50 μm). (C) graph display the quantification of dermis thickness. Data represent mean ± SEM (n = 9) (**P < 0.01, two-way ANOVA). (D) Number of total circulating white blood cells, lymphocytes, monocytes and granulocytes in blood from mice 2 weeks after Lentiflash-APLN intradermal injection. Data represent mean ± SEM (n = 5) (ns = non significant, unpaired t test). (E) Number of blood platelet cells from mice 2 weeks after Lentiflash-APLN intradermal injection. Data represent mean ± SEM (n = 5) (ns=non significant, unpaired t test). (F) Representative images of macrophages (F4/80) immunodetection at the site of injection in skin from mice injected with Lf (Lf Luc) or adjuvant (TSSM) (scale bar = 50 μm). (G) Quantification of the number of macrophages at the site of Lf injection or TSSM control. Data represent mean ± SEM (n = 7).
Figure EV5
Figure EV5. VEGF-C-, APLN, and APLN-VEGF-C Lf dose response.
(A) Quantification of proximal limb swelling at 7 and 14 days after surgery on control limb, LD limb or LD treated with TSSM. Data represent mean ± SEM (n = 5) (**P < 0.001, two-way ANOVA). (B) Representatives images of lymphangiography from mice treated with TSSM. Scale bar: 1 mm. (CE) Quantification of proximal limb swelling 7 and 14 days after surgery on control or LD treated with 200 ng (C), 40 ng (D), or 20 ng (E) of VEGF-C LentiFlash® vector. Data represent mean ± SEM (n = 5) (*P < 0.05, *P < 0.001, two-way ANOVA). (FH) Quantification of proximal limb swelling 7 and 14 days after surgery on control or LD treated with 200 ng (F), 40 ng (G), or 20 ng (H) of APLN LentiFlash® vector. Data represent mean ± SEM (n = 5) (*P < 0.05, *P < 0.001, two-way ANOVA). (IK). Quantification of proximal limb swelling 7 and 14 days after surgery on control or LD treated with 200 ng (I), 40 ng (J), or 20 ng (K) of APLN-VEGF-C LentiFlash® vector. Data represent mean ± SEM (n = 5) (*P < 0.05, *P < 0.001, two-way ANOVA). (L) Representatives images of lymphangiography from mice treated with 200 ng, 40 ng, or 20 ng VEGF-C-, APLN-, or APLN-VEGF-C LentiFlash® vectors. Scale bar: 1 mm. (M) Quantification of proximal limb swelling in mice treated with TSSM. Data represent mean ± SEM (n = 5) (**P < 0.001, two-way ANOVA). (N) Quantification of proximal limb swelling in mice treated with APLN-VEGF-C LentiFlash® vector Batch 1 after LD development (10 days post surgery). Data represent mean ± SEM (n = 5) (two-way ANOVA). (O) Quantification of proximal limb swelling in mice treated with APLN-VEGF-C LentiFlash® vector Batch 2 after LD development (10 days post surgery). Data represent mean ± SEM (n = 5) (two-way ANOVA). (P) Quantification of proximal limb swelling in mice treated with APLN-VEGF-C LentiFlash® vector Batch 3 after LD development (10 days post surgery). Data represent mean ± SEM (n = 5) (two-way ANOVA).

References

    1. Alders M, Mendola A, Ades L, Al Gazali L, Bellini C, Dallapiccola B, Edery P, Frank U, Hornshuh F, Huisman SA, et al. Evaluation of clinical manifestations in patients with severe lymphedema with and without CCBE1 mutations. Mol Syndromol. 2013;4:107–113. doi: 10.1159/000342486. - DOI - PMC - PubMed
    1. Baik JE, Park HJ, Kataru RP, Savetsky IL, Ly CL, Shin J, Encarnacion EM, Cavali MR, Klang MG, Riedel E, et al. TGF-beta1 mediates pathologic changes of secondary lymphedema by promoting fibrosis and inflammation. Clin Transl Med. 2022;12:e758. doi: 10.1002/ctm2.758. - DOI - PMC - PubMed
    1. Bernier-Latmani J, Cisarovsky C, Mahfoud S, Ragusa S, Dupanloup I, Barras D, Renevey F, Nassiri S, Anderle P, Squadrito ML, et al. Apelin-driven endothelial cell migration sustains intestinal progenitor cells and tumor growth. Nat Cardiovasc Res. 2022;1:476–490. doi: 10.1038/s44161-022-00061-5. - DOI - PMC - PubMed
    1. Berta J, Hoda MA, Laszlo V, Rozsas A, Garay T, Torok S, Grusch M, Berger W, Paku S, Renyi-Vamos F, et al. Apelin promotes lymphangiogenesis and lymph node metastasis. Oncotarget. 2014;5:4426–4437. doi: 10.18632/oncotarget.2032. - DOI - PMC - PubMed
    1. Bonet F, Inacio JM, Bover O, Anez SB, Belo JA. CCBE1 in cardiac development and disease. Front Genet. 2022;13:836694. doi: 10.3389/fgene.2022.836694. - DOI - PMC - PubMed