. 2024 Mar;31(3):489-497.
doi: 10.1038/s41594-023-01178-2. Epub 2024 Jan 4.

Transcription-induced domains form the elementary constraining building blocks of bacterial chromosomes

Affiliations

Transcription-induced domains form the elementary constraining building blocks of bacterial chromosomes

Amaury Bignaud et al. Nat Struct Mol Biol. 2024 Mar.

Abstract

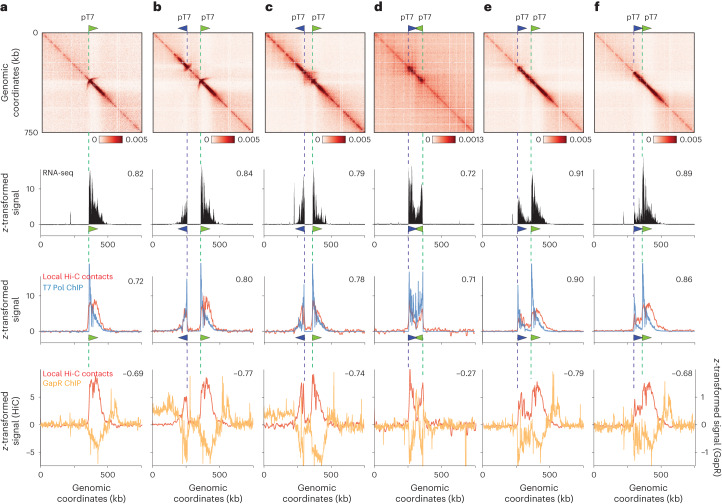
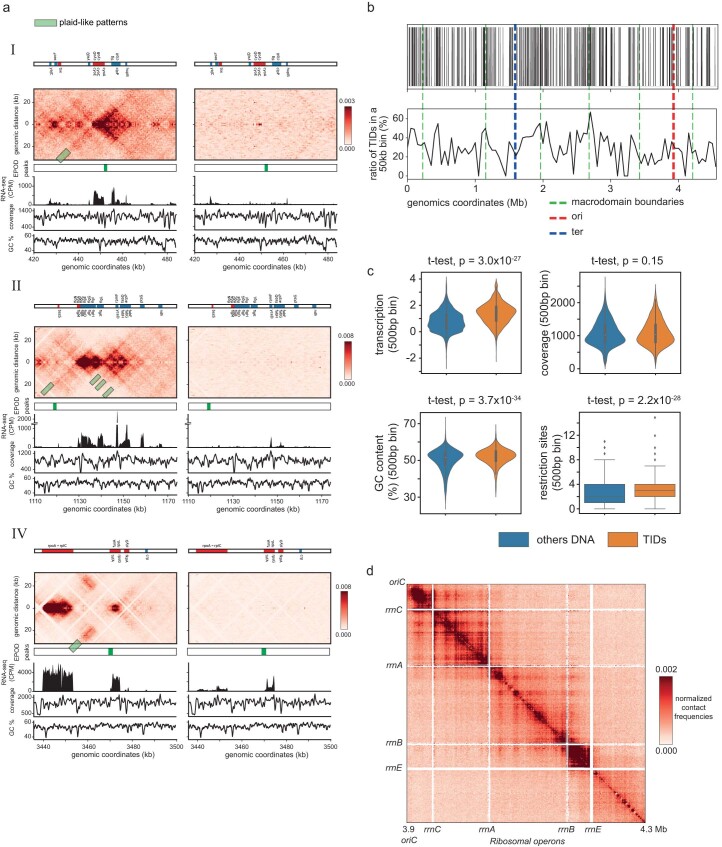
Transcription generates local topological and mechanical constraints on the DNA fiber, leading to the generation of supercoiled chromosome domains in bacteria. However, the global impact of transcription on chromosome organization remains elusive, as the scale of genes and operons in bacteria remains well below the resolution of chromosomal contact maps generated using Hi-C (~5-10 kb). Here we combined sub-kb Hi-C contact maps and chromosome engineering to visualize individual transcriptional units. We show that transcriptional units form discrete three-dimensional transcription-induced domains that impose mechanical and topological constraints on their neighboring sequences at larger scales, modifying their localization and dynamics. These results show that transcriptional domains constitute primary building blocks of bacterial chromosome folding and locally impose structural and dynamic constraints.


Conflict of interest statement

The authors declare no competing interests. The funders had no role in study design, data collection and analysis, decision to publish or preparation of the manuscript.

Figures

Fig. 1
Fig. 1. The bacterial chromosome is structured by tens of small transcriptionally active 3D units.
a, Hi-C normalized contact map of WT E. coli cells (bin: 1 kb). The five yellow squares I–V underline representative 64-kb regions magnified in either b or in Extended Data Fig. 1. b, Magnifications of regions III and V in absence (left) and presence (right) of rifampicin. Ec RNAP: E. coli RNA Pol II. For each window and condition: Top: a schematic representation of the region’s genetic content, with the names of genes within the 10% most transcribed indicated in blue and red for forwards and reverse orientation, respectively, and silent EPODs regions in green. Middle: normalized contact map (bin: 0.5 kb). Bottom: RNA-seq profile in CPM. Plaid-like pattern positions are pointed with greenish rectangles on the maps. c, Venn diagram of EPODs labeled regions and of regions labeled as bundle domain. The metric used corresponds to the total size of the corresponding regions, in kb. d, Top: pileup of 50 kb contact map windows (bin: 0.5 kb) centered on the start codons (AUG) of the 5% (left) and 10% (right) most transcribed genes of the genome. Bottom: corresponding pileup of transcription (RNA-seq) tracks. Green arrowheads indicate a faint stripe signal extending from the TSS. e, Pileup of 50-kb contact map windows centered on the TSS of the to 10% and 20% most transcribed TUs (that is operons). Bottom: corresponding pileup of transcription (RNA-seq) tracks.
Fig. 2
Fig. 2. Contact profile of single, active transcription unit within an entire genome.
a, Hi-C contact maps (bin: 1 kb) of E. coli chromosome carrying a single T7 promoter (green triangle), in absence (left) or presence (right) of rifampicin. Ec RNAP: E. coli RNA Pol II. Top: cells grown in glucose media, when the T7 RNA Pol is not expressed. Middle: cells grown in presence of arabinose, with expression of the T7 RNA Pol. Bottom: log2 ratio contact maps with and without induction of the T7 promoter. Magnification of the T7 promoter region, represented using Serpentine flexible binning (Methods). b, Magnification of the T7 promoter in the normalized contact maps, with and without induction and in presence and absence of rifampicin. From left to right: T7 promoter off, no rif; T7 on, no rif; T7 on, + rif. For each window and condition, a schematic representation of the region’s genetic content is presented on the top, with the operons within the 10% most transcribed indicated in blue and red for forwards and reverse orientation, respectively (that is, secDEF and cyoABCD). The corresponding RNA-seq tracks (CPM) are plotted under the maps. In presence of T7 RNA Pol and rifampicin, the numbered labels on the map highlight the features discussed in the text: (1) arched stripe pattern; (2) bundle region. c, Average genome structures using Shrek of the corresponding 2D contact maps of the E. coli bacterial chromosome in the different conditions. The green, red and blue arrows represent the pT7, ori and ter positions, respectively. The 3D representations are not the physical structure of the genome, but the average structure of the population of cells that we observed. d, Modeling of the Hi-C contact maps using the RNA Pol distribution on the genome and using the second model (Methods).
Fig. 3
Fig. 3. Supercoiling and contacts resulting from combination of pairs of transcription units.
af, Genomic characterization of chromosomal regions carrying pairs of pT7 promoters in different orientations. The orientations are as follows: a single promoter (a), two divergent promoters at 100 kb (b), 60 kb (c), two convergent promoters at 100 kb (d), two unidirectional (collinear) promoters at 100 kb (e) and 60 kb (f). From top to the bottom: Hi-C contact map (first row; bin: 1 kb), RNA-seq track (second row; in CPM), T7 RNA Pol ChIP–seq track (third row, blue curve) and short-range Hi-C contacts (third row, red curve), and GapR ChIP–seq revealing positive supercoiling (fourth row, yellow curve) and short-range Hi-C contacts (fourth row, red curve). Values on the top right corner of each panel are the Spearman correlation coefficients of the track with the short-range Hi-C contacts. All tracks are z-transformed.
Fig. 4
Fig. 4. Dynamic influence of the T7 transcription unit.
a, Positions of the parS tags inserted in a TID enriched region (parSpMT1 near yajQ gene) and a poorly expressed region (parSP1 near crl gene). The T7 promoter was inserted at the lacZ promoter position in-between the two parS tags. The arrows on the right indicate how we measure the lateral (pink) and longitudinal (green) positions in bh and in Extended Data Fig. 6d–f. In bh, the positions of one or two parS tags in one or two conditions are compared. The x axis represents either the relative longitudinal or lateral relative position. 0 (and 1) corresponds to the cell periphery, whereas 0.5 corresponds to the middle of the cell. For each panel, a cell cartoon illustrates the position that the two monitored loci tend to occupy. Statistical differences between the distributions are analyzed with a two-sample Kolmogorov–Smirnov test. On each plot, the dotted lines indicate the median of the tags positions, and the significance of the one-sided t-test between average position of both conditions is indicated by NS (not significant) or stars (*P < 5 × 10−2; **P < 1 × 10−3; ***P < 1 × 10−4; ****P < 1 × 10−5). The errors bars are defined as the 95% confidence interval of 1,000 bootstraps. Finally, a gray area can highlight the peripheral localization where and if foci redistribution occurs. b,c, The longitudinal (b) and lateral (c) foci positions of parSpMT1 and parSP1 (as shown in a), in absence of T7 transcription, are plotted (t-test P value: 0.62, 8.7 × 10−8, respectively). The lateral position of the transcribed parSpMT1 tag region is shifted toward the periphery of the nucleoid cnompared to the inactive parSP1 region. d, Lateral position of the parSpMT1 tag in absence or presence of rifampicin (t-test P value: 8.3 × 10−4). e, Lateral position of the parSpMT1 and parSP1 tags in the presence of T7 transcription (t-test P value: 0.12). f, Lateral position of the parSP1 tag with or without T7 transcription (t-test P value: 3.5 × 10−5). g, Longitudinal position of the parSpMT1 tag in absence or presence of rifampicin (t-test P value: 1.5 × 10−5). h, Same as g but in presence of T7 transcription (t-test P value: 6.8 × 10−2). i, Colocalization of pairs of parS tags from a flanking the T7 unit. The proportion of cells presenting at least one couple of foci closer than 200 nm of less was plotted. Each replicate is an average of 400 cells. Statistical differences are measured by an analysis of variance (ANOVA) Kruskal–Wallis test with Bonferroni correction, *P < 0.033, **P < 0.0021, ***P < 0.0002, ****P < 0.0001. Replicates: N = 7–9. j, Positions of the three lacO arrays inserted in the vicinity of the T7 promoter. LacI–YFP foci dynamics was analyzed for 100 time intervals of 1 s, for each replicate (N = 3–6)) the median MSDα measurement for ~1,000 trajectories of the fluorescently labeled loci was computed. Experiments were performed in the absence of rifampicin upon induction of the T7 TU. Statistical differences are measured by an ANOVA Kruskal–Wallis test with Bonferroni correction, *P < 0.033, **P < 0.0021, ***P < 0.0002, ****P < 0.0001. k, E. coli, V. cholerae and S. cerevisiae genes pileups. Left: pileup for each species of 50-kb windows contact maps centered on TSS of the 10% most transcribed genes. Bottom: corresponding RNA-seq pileup profiles. l, Schematic representation of the proposed nucleoid structuring into a mosaic of small 3D transcriptional units or TIDs. We propose that TIDs tend to cluster together, and/or relocalize to the nucleoid periphery, resulting in enriched contacts between adjacent units separated by ~20–40 kb. Source data
Extended Data Fig. 1
Extended Data Fig. 1. Transcription impact on WT bacterial chromosome folding.
a, Magnifications of regions I, II and IV. The names of the genes within the 10% most transcribed are indicated (blue and red correspond to forwards and reverse genes, respectively). Left panels: normalized contact map (bin: 0.5 kb) over the corresponding EPODs peaks and RNA-seq profile (in count per million or CPM), Hi-C coverage, GC content (%), in absence of rifampicin. Right panel: same region and analysis but in presence of rifampicin. b, Distributions of the bundle domains across the whole genome (x axis). Top: each strip represents a 500 bp bin called within a bundle domains (that is TID; Methods). Bottom: same data as above but binned into 50 kb bins. The positions of the macrodomains as defined in Lioy et al. are indicated by green dotted lines. Ori and ter are indicated by red and blue lines, respectively. c, Distributions of transcription (CPM, in log 10), coverage, GC content and numbers of restrictions sites in pairs of bins with either low (blue) and high (that is in TIDs; orange) contact frequency at short range (Methods). Boxplots represent the first quantile, the median and the third quantile and the bar is between the first and ninth decile. The p-values are from independent one-sided t-tests (Others DNA: n = 6772, TIDS: n = 2512). d, Magnification of the WT E. coli contact map binned at 1kb on the rDNA loci. rDNA positions are indicated with their names. As rDNA operons are repeated sequences, reads cannot be mapped unambiguously, resulting in no signal is these loci (white lines in the contact map).
Extended Data Fig. 2
Extended Data Fig. 2. Relationships between Transcription Induced Domains and CIDs.
a, E coli contact map binned at 5 kb at the top. Below the corresponding detected macrodomains and CIDs based on directional index method. Stars show the significant borders detected in both Lioy et al. data and the present one (black), only in Lioy et al. data (red) and only with our data (green). b, Domains detected based on DI analysis only at different resolutions; 1 kb (cyan), 2 kb (green) and 5 kb (blue). c, Bundle domains called using insulation score detection at 1 kb (cyan), or DI analysis on contact maps binned either 2 kb (green) and 5 kb (blue). Top, visualization of domains over the entire genome. Middle, magnification of a 500 kb region. Below, Corresponding RNA-seq track in CPM. d, Violin plot distributions of transcript levels for all genes in the genome (black), and for all genes in 10 kb windows centered on the domain boundaries called on the 5 kb (blue), 2 kb (green) and 1 kb (cyan) binned maps. The bars represent the first and ninth deciles, and the dots is the mean of each distribution. The p-values of non-parametric one-sided Mann-Withneyu test of whether the later distributions follow a genomewide distribution are indicated. e, Gene transcription in RPKM depending on the distance from the closest borders detected at different resolutions. The errors bars are defined as the 95% confidence interval of 1,000 bootstraps.
Extended Data Fig. 3
Extended Data Fig. 3. Activation of a single transcription unit within the E. coli chromosome.
a, Magnifications of the Hi-C contact maps (bin: 1kb) of E. coli chromosome carrying a single T7 promoter facing toward the ori, with below the corresponding RNAseq and the signal from ChIP of the T7 RNA polymerase. From left to right: the T7 promoter off, the T7 promoter on and the T7 promoter on with rifampicin. b, Correlation between the maps recovered from each of the two models and the experimental map, depending on the epsilon values (Methods). c, Best correlation map of Model I (right), aside the experimental map (left).
Extended Data Fig. 4
Extended Data Fig. 4. Topoisomerase impact on the transcription unit folding.
a, Hi-C contact map magnifications (bin: 500 bp) of an E. coli strain carrying endogenous promoters facing the origin of replication. From top to bottom: without any additional promoter; with two pompA promoters; with two prpsM promoters. b, Analysis of TopA overexpression. Left panel, measurement of TopA amount by western blot in RSGB834 pBAD24 and RSGB834 pBAD24-TopA with an anti TopA antibody (gift from Dr. Yuk-Ching Tse-Dinh). Quantification of the western-blot showed a 38 fold overexpression of TopA after 2h of arabinose induction. This experiment was representative of 3 replicates. Right panel, microscopy imaging of the arabinose treated cell. The cells were fixed 2h after arabinose induction and stained with DAPI. Bacteria length and DAPI amount per cell surface was measured with a custom macro of the Omnipose software. The significance of the two-tailed Mann-Whithney test between average of both conditions is indicated by ns (not significant) or stars (*: <0.032; **: <0.0021; ***: <0.0002; ****: <0.0001). c, Hi-C contact map magnifications of the T7 system while interfering with the topoisomerases activity; contact map binned at 1kb. top; wt system with 2h arabinose treatment. Middle left; overexpression of the topA, right; gyrase inhibition using a 10 min novobiocin treatment. Bottom; log2 ratio of the interfered over the wild type; 2 kb binned. On the left same with 10 min rifampicin treatment. Source data
Extended Data Fig. 5
Extended Data Fig. 5. Translation impact on bacterial chromosome folding.
a, Schematic view of the polysome extraction experiment. b, c, Gel migration of the different fractions for polysome extraction without EDTA (b), and with EDTA (c) (ladder: GeneRuler 1 kb Plus DNA Ladder). d, Relative enrichment along the chromosome as a function of polysome extraction fraction number. e, Magnification of the Hi-C contact map of the E. coli carrying T7 promoter facing the origin (oriented from left to right). f, Corresponding z-transformed signals of the short range Hi-C signal, T7 RNA polymerase ChIP-seq, transcription and translation. g, h, Gene expression upstream (yaiS) and downstream (codB) of the T7 promoter lacZ system with or without STOP codons based on GFP fluorescence (g) and growth of the corresponding strains (h). i, Bacterial colony dilution with pT7lacZ repressed on the left and expressed on the right. j, Contact map of the bacteria carrying a T7 promoter lacZ system with two stop codons into the lacZ gene. k, Log2 ratio between the contact map with the lacZ2xSTOP system over the contact map with the WT lacZ. l, Contact map of the bacteria carrying a T7 promoter lacZ system treated with chloramphenicol. m, Log2 ratio between the contact map treated over the untreated.
Extended Data Fig. 6
Extended Data Fig. 6. Dynamic influence of the T7 transcription unit.
a, RNAseq signal over the whole genome. Values are the normalized number of reads at a given position. b, Magnification of the RNAseq signal over the parSP1 locus. c, Magnification of the RNAseq signal over the parSpMT1 locus. d-f, The dotted lines on the plot indicate the median of the loci positions, and the significance of the one-sided t-test between average position of both conditions is indicated by ns (not significant) or stars (*: <5.10−2; **: <1.10−3; ***: <1.10−4; ****: <1.10−5). The errors bars are defined as the 95% confidence interval of 1,000 bootstraps. The gray area highlights the shift of distributions across conditions. d, Longitudinal position of the tags with one focus (t-test p-value: 0.12). e, Longitudinal position of the parSpMT1 locus with one focus with or without rifampicin treatment (t-test p-value: 9.8 × 10⁻⁵). f, Longitudinal position of the parSpMT1 locus with one focus with rifampicin treatment is rescued upon T7 activation (t-test p-value: 1.4 × 10⁻³). g, Positions of the three lacO arrays inserted in the vicinity of the T7 promoter. LacI-YFP foci dynamics was analyzed for 100 time intervals of 1 sec, for each replicate (N = 3-6) the median MSDα measurement for ~1,000 trajectories of the fluorescently labeled loci was computed. Experiment were performed in the presence of rifampicin upon induction of the T7 TU. Statistical differences are measured by an Anova Kruskal-Wallis test with Bonferroni correction, * <0.033, ** < 0.0021, **** <0.0002, ****<0.0001.

References

    1. Kleckner N. The bacterial nucleoid: nature, dynamics and sister segregation. Curr. Opin. Microbiol. 2014;22:127–137. doi: 10.1016/j.mib.2014.10.001. - DOI - PMC - PubMed
    1. Lioy VS, Junier I, Boccard F. Multiscale dynamic structuring of bacterial chromosomes. Annu. Rev. Microbiol. 2021;75:541–561. doi: 10.1146/annurev-micro-033021-113232. - DOI - PubMed
    1. Dame RT, Rashid F-ZM, Grainger DC. Chromosome organization in bacteria: mechanistic insights into genome structure and function. Nat. Rev. Genet. 2020;21:227–242. doi: 10.1038/s41576-019-0185-4. - DOI - PubMed
    1. Liu LF, Wang JC. Supercoiling of the DNA template during transcription. Proc. Natl Acad. Sci. USA. 1987;84:7024–7027. doi: 10.1073/pnas.84.20.7024. - DOI - PMC - PubMed
    1. Visser BJ, et al. Psoralen mapping reveals a bacterial genome supercoiling landscape dominated by transcription. Nucleic Acids Res. 2022;50:4436–4449. doi: 10.1093/nar/gkac244. - DOI - PMC - PubMed

LinkOut - more resources