. 2024 Jan;25(1):198-227.
doi: 10.1038/s44319-023-00005-5. Epub 2023 Dec 19.

TTLL12 is required for primary ciliary axoneme formation in polarized epithelial cells

Affiliations

TTLL12 is required for primary ciliary axoneme formation in polarized epithelial cells

Julia Ceglowski et al. EMBO Rep. 2024 Jan.

Abstract

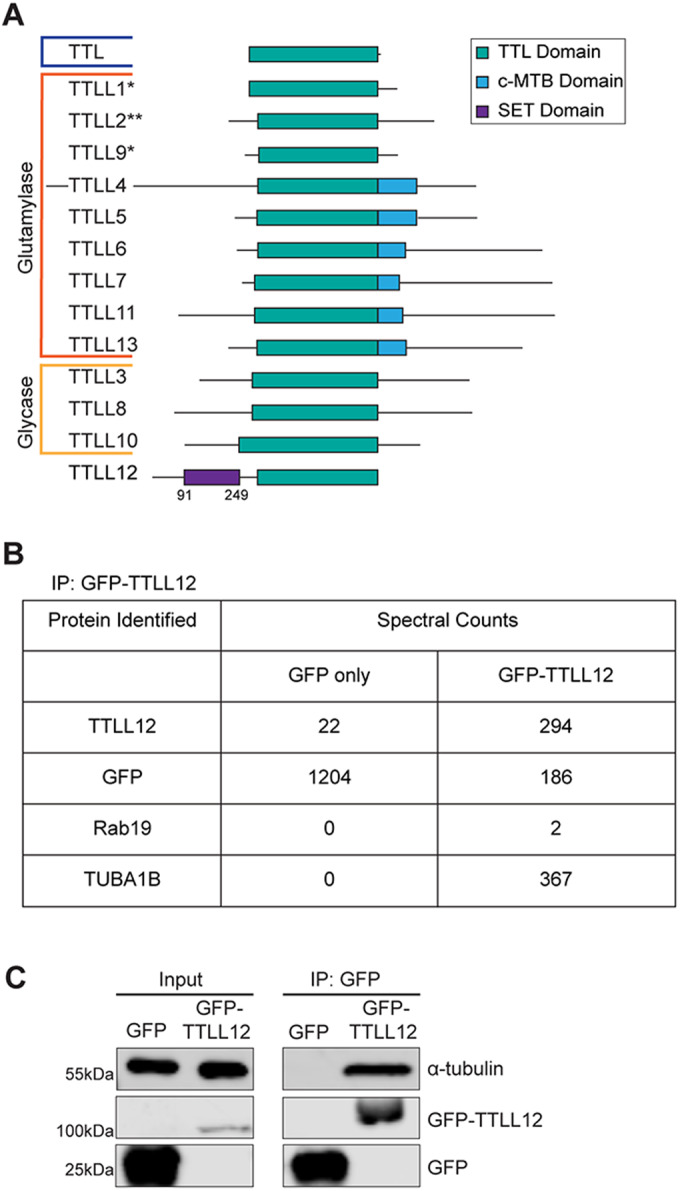
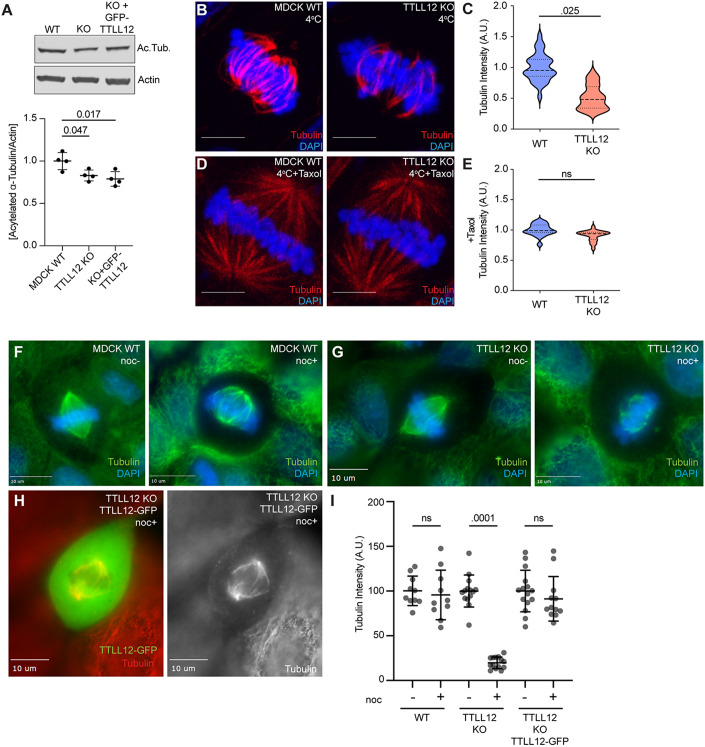
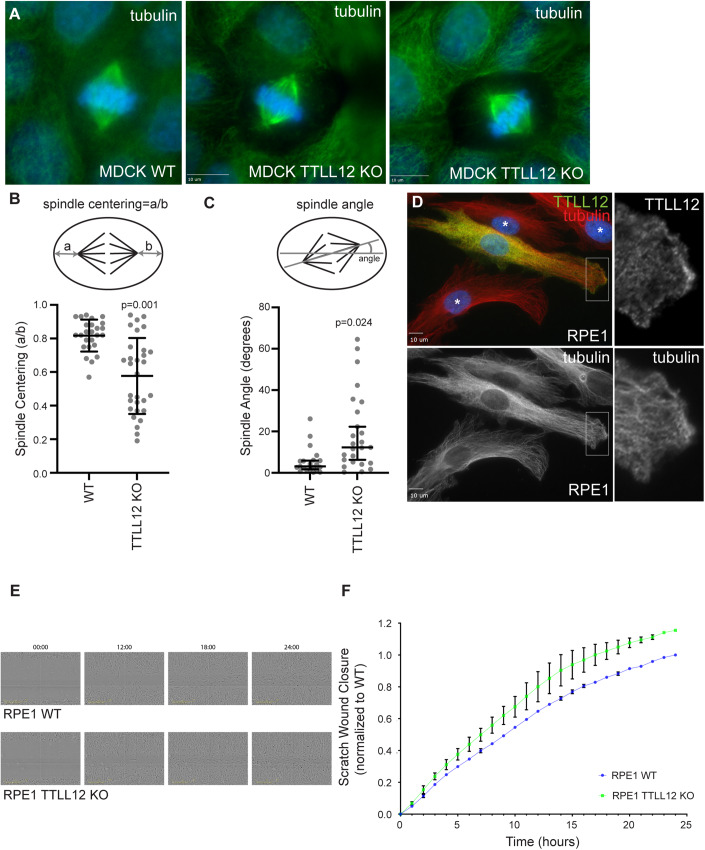
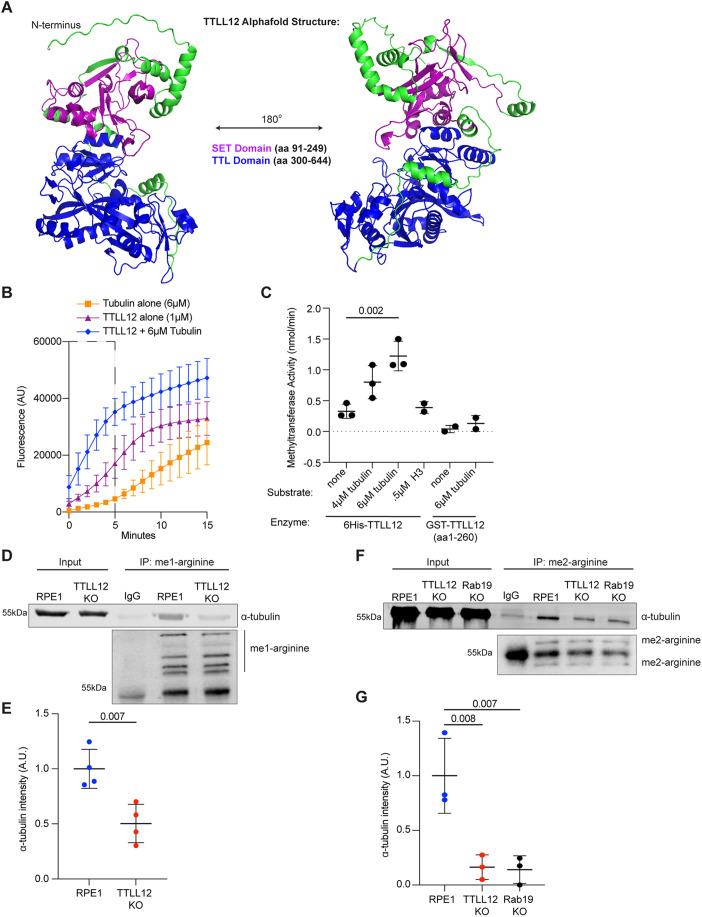
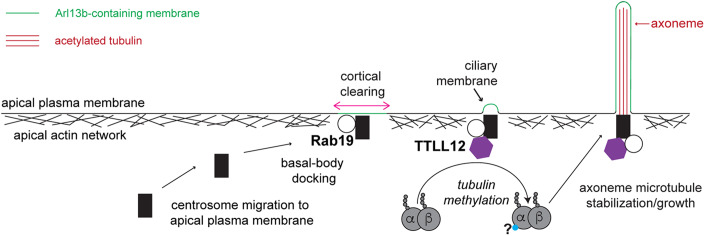
The primary cilium is a critical sensory organelle that is built of axonemal microtubules ensheathed by a ciliary membrane. In polarized epithelial cells, primary cilia reside on the apical surface and must extend these microtubules directly into the extracellular space and remain a stable structure. However, the factors regulating cross-talk between ciliation and cell polarization, as well as axonemal microtubule growth and stabilization in polarized epithelia, are not fully understood. In this study, we find TTLL12, a previously uncharacterized member of the Tubulin Tyrosine Ligase-Like (TTLL) family, localizes to the base of primary cilia and is required for cilia formation in polarized renal epithelial cells. We also show that TTLL12 directly binds to the α/β-tubulin heterodimer in vitro and regulates microtubule dynamics, stability, and post-translational modifications (PTMs). While all other TTLLs catalyze the addition of glutamate or glycine to microtubule C-terminal tails, TTLL12 uniquely affects tubulin PTMs by promoting both microtubule lysine acetylation and arginine methylation. Together, this work identifies a novel microtubule regulator and provides insight into the requirements for apical extracellular axoneme formation.

Keywords: Cilia; Epithelial Cells; Methylation; TTLL12; Tubulin.


Conflict of interest statement

The authors declare no competing interests.

Figures

Figure 1
Figure 1. Identification of TTLL12 as a Rab19-binding partner.
(A) Schematic of the TTLL family. Blue indicates TTL is a tyrosinase. *Indicates a glutamylase that functions in a complex. **Indicates a glutamylase that is classified only by sequence similarity. (B) Identification of TTLL12 binding partners. Spectral counts of candidate proteins identified through co-immunoprecipitation/mass spectrometry on GFP-TTLL12. The full list of proteins identified is in Dataset EV1. (C) TTLL12 binding to tubulin. Immunoprecipitation of GFP-TTLL12 followed by western blot for α-tubulin. Left column shows lysates (input) probed for GFP and α-tubulin. Right column shows immunoprecipitates probed for GFP and α-tubulin. Source data are available online for this figure.
Figure 2
Figure 2. TTLL12 directly binds to the α/β-tubulin heterodimer.
(A) Microtubule and TTLL12 co-sedimentation assay. Taxol-stabilized porcine brain microtubules were mixed with recombinant 6His-TTLL12 and pelleted by centrifugation. The supernatant and pellet were separated and run on an SDS/PAGE gel followed by Coomassie blue staining. (B) Quantification of TTLL12 in the pellet with or without microtubules from (A). Graph shows individual values calculated from three independent experiments. Student’s t test (two-tailed) was used for statistical analysis. (C) TTLL12 binding to the tubulin heterodimer. Binding assay with recombinant 6His-TTLL12 and porcine brain tubulin. TTLL12 and tubulin were mixed O/N at 4 °C to prevent microtubule polymerization, followed by the addition of nickel beads. Bead eluates were run on an SDS/PAGE gel followed by Coomassie blue staining. (D) Quantification of tubulin band intensity in (C). Graph shows mean ± SD derived from five independent experiments. Student’s t test (two-tailed) was used for statistical analysis. (E) TTLL12 N-terminus binding to tubulin. Binding assay with recombinant GST-TTLL12 (aa1–260) and porcine brain tubulin. TTLL12 and tubulin were mixed O/N at 4 °C followed by the addition of glutathione beads and western blot probing for GST and α-tubulin. (F) Quantification of α-tubulin band intensity in (E). Graph shows mean ± SD derived from three independent experiments. Student’s t test (two-tailed) was used for statistical analysis. (G) Competitive binding experiment between recombinant 6His-TTLL12, GST-Rab19, and untagged porcine brain tubulin. Increasing concentrations of GST-Rab19 were added to 6His-TTLL12 and tubulin followed by the addition of nickel beads. The presence of TTLL12 and Rab19 was confirmed by Coomassie and western blot was used to probe for α-tubulin. (H) Quantification of α-tubulin band intensity in (G). Graph shows mean ± SD derived from three independent experiments. Student’s t test (two-tailed) was used for statistical analysis. Source data are available online for this figure.
Figure 3
Figure 3. TTLL12 regulates microtubule stability and dynamics.
(A) Representative western blot and quantification of acetylated α-tubulin in MDCK WT, TTLL12 KO, and TTLL12 KO + GFP-TTLL12 cells. N = 4. Graph shows mean ± SD. Student’s t test (two-tailed) was used for statistical analysis. (B) Microtubule cold-stability assay. Representative images of MDCK WT and TTLL12 KO cells placed at 4 °C for 30 min to depolymerize microtubules and stained for DNA and tubulin. Scale bar = 5 µm. (C) Quantification of tubulin intensity from (B). Data from three independent experiments (N = 3, n = 30 for WT, n = 30 for KO). Graph shows median and quartiles. Student’s t test (two-tailed) was used for statistical analysis. (D) Representative images of MDCK WT and TTLL12 KO cells treated with 1 µM Taxol before 4 °C for 30 min and stained for DNA and tubulin. Scale bar = 5 µm. (E) Quantification of tubulin intensity from Taxol-treated cells in (C). Data from three independent experiments (N = 3, n = 19 for WT, n = 20 for KO). Graph shows median and quartiles. Student’s t test (two-tailed) was used for statistical analysis. (F) Microtubule nocodazole sensitivity assay. Representative images of MDCK WT cells incubated in the presence or absence of 500 nM of nocodazole for 10 min and stained for DNA and tubulin. (G) Microtubule nocodazole sensitivity assay. Representative images of TTLL12 KO cells incubated in the presence or absence of 500 nM of nocodazole for 10 min and stained for DNA and tubulin. (H) Microtubule nocodazole sensitivity assay. Representative images of TTLL12 KO expressing TTLL12-GFP cells incubated in the presence of 500 nM of nocodazole for 10 min and stained for DNA and tubulin. (I) Quantification of tubulin intensity from (FH). Each dot represents a single cell analyzed. Graph shows mean and standard deviation derived from three independent experiments. Student’s t test (two-tailed) was used for statistical analysis. Source data are available online for this figure.
Figure 4
Figure 4. TTLL12 regulates ciliation timing and length in RPE1 cells.
(A) Representative images of RPE1 WT and TTLL12 KO cells grown on collagen-coated glass coverslips, serum-starved for 48 h, and stained for DNA, Arl13b, and acetylated tubulin (Ac. Tub). Scale bar = 5 µm. (B) Representative images of RPE1 WT and TTLL12 KO cells serum-starved for 8 or 48 h and stained for DNA, Arl13b, and GT335 (Glut. Tub.). Scale bar = 5 µm. Yellow arrowhead indicates a shorter than average cilium, and yellow arrow indicates a longer than average cilium. (C) Quantification of ciliation frequency through a serum starvation time course using Arl13b and GT335 as markers for cilia. The graph shows mean ± SD derived from three independent experiments. Student’s t test (two-tailed) was used for statistical analysis. (D) Quantification of the rate of ciliation from the time course in (C). The graph shows mean ± SD derived from three independent experiments. Student’s t test (two-tailed) was used for statistical analysis. (E) Quantification of primary cilium length after 48 h of serum starvation. The violin plot represents all primary cilia measured. Black circles represent average cilium length from three independent experiments, on which a t test was performed (N = 3, n = 1438 for WT, n = 1352 for KO). (F) Quantification of the length variance from three independent experiments. The graph shows mean ± SD derived from three independent experiments. Student’s t test (two-tailed) was used for statistical analysis. (G) Representative images of TTLL12 localization in ciliated RPE1 WT and TTLL12 KO cells. Scale bar = 5 µm. Scale bar = 1 µm in inset. (H) Quantification of TTLL12 at the base of the primary cilium from (G). N = 1 and 35 cells were measured in each condition. Graph shows mean ±  SD derived from three independent experiments. Student’s t test (two-tailed) was used for statistical analysis. Source data are available online for this figure.
Figure 5
Figure 5. TTLL12 is required for axoneme formation in polarized epithelial cells.
(A) Representative images of MDCK WT, TTLL12 KO, and TTLL12 KO cells stably expressing GFP-TTLL12 grown on transwell filters, polarized and stained for actin, gamma-tubulin, and acetylated tubulin (Ac. Tub). Scale bar = 5 µm. (B) Inset from A (white boxes). Scale bar = 5 µm. (C) Quantification of cells with a primary cilium marked by acetylated tubulin in (A). Graph shows mean ± SD from three independent experiments. Student’s t test (two-tailed) was used for statistical analysis. (D) Representative images of MDCK WT and TTLL12 KO cells stained for actin, Arl13b, and GT335. Scale bar = 5 µm. (E) Quantification of cells with a primary cilium marked by glutamylated tubulin (GT335). Graph shows mean ± SD from three independent experiments. Student’s t test (two-tailed) was used for statistical analysis. (F) Representative images of MDCK cells stained for actin, gamma-tubulin, and Arl13b. Scale bar = 5 µm. (G) Quantification of cells with Arl13b at the centrosome (marked by gamma tub.). Graph shows mean ± SD from three independent experiments. Student’s t test (two-tailed) was used for statistical analysis. (H) Quantification of Arl13b intensity at each gamma-tubulin puncta. Black circles represent average Arl13b intensity from three independent experiments (N = 3, n = 1658 for WT, n = 1616 for KO). Graph shows mean ± SD. Student’s t test (two-tailed) was used for statistical analysis. (I) SEM images of the apical surface of MDCK WT and TTLL12 KO polarized on transwell filters. Images are at ×4000 magnification with 5 µm scale bar. White arrows indicate primary cilia-like structures. Boxes mark the location of higher magnification insets. Source data are available online for this figure.
Figure 6
Figure 6. TTLL12 regulates cell migration and mitotic spindle positioning.
(A) Representative images of mitotic MDCK WT and TTLL12 KO cells grown on collagen-coated glass coverslips and stained for tubulin. Scale bar = 10 µm. (B) Quantification of mitotic spindle centering in MDCK WT and TTLL12 KO cells. Each circles represents measurement derived from single cell. The data shown are the means and standard deviations derived from three independent experiments. Student’s t test (two-tailed) was used for statistical analysis. (C) Quantification of mitotic spindle angle in MDCK WT and TTLL12 KO cells. Each circles represents measurement derived from single cell. The data shown are the means and standard deviations derived from three independent experiments. The data shown are the median and 95% confidence interval. Student’s t test (two-tailed) was used for statistical analysis. (D) Representative images of mixed culture of RPE1 WT and TTLL12 KO (marked with asterisk) cells grown on collagen-coated glass coverslips and stained for tubulin and TTLL12. Box marks the area enlarged in insets on the right. Scale bar = 10 µm. (E) Representative time-lapse still images of RPE1 WT and RPE1 TTLL12 KO migrating into scratch wound. (F) Quantification of scratch wound migration analysis of RPE1 WT and RPE1 TTLL12 KO performed using Incucyte. Cells were analyzed for 24 h with 1-h time-lapse. The relative wound density was calculated for each time point and normalized against last time point for RPE1 WT cells. The data shown is derived from one independent experiment. Error bars represent variability between three different technical repeats. Source data are available online for this figure.
Figure 7
Figure 7. TTLL12 regulates tubulin methylation.
(A) Alpha-fold structure of TTLL12. SET domain is purple. TTL domain is blue. Amino acids not in defined domains are green. (B) Fluorescence-based assay to measure methyltransferase activity. In total, 1 µM 6His-TTLL12 was incubated with methyl donor SAM and 6 µM porcine brain tubulin and fluorescence was measured over time. The data are the means and standard deviations derived from three different experiments. Mass spectrometry identifying methylation of tubulin alone and TTLL12 + tubulin is in Dataset EV2. (C) Methyltransferase activity was calculated using the slopes of the curves from C (inside the dotted box). The data shown are the means and standard deviations derived from three different experiments. (D) Immunoprecipitation of mono-methyl arginine from RPE1 cells followed by western blot for α-tubulin. Left columns show lysates (input) probed for Rme1 and α-tubulin. Right columns show immunoprecipitates probed for Rme1 and α-tubulin. (E) Quantification of α-tubulin band from (D). IgG control was subtracted as background. Graph shows mean ± SD from four independent experiments. Student’s t test (two-tailed) was used for statistical analysis. (F) Immunoprecipitation of di-methyl arginine from RPE1 cells followed by western blot for α-tubulin. Left column shows lysates (input) probed for Rme2 and α-tubulin. Right columns show immunoprecipitates probed for Rme2 and α-tubulin. (G) Quantification of α-tubulin band from (F). IgG control was subtracted as background. Graph shows mean ± SD from three independent experiments. Student’s t test (two-tailed) was used for statistical analysis. Source data are available online for this figure.
Figure 8
Figure 8. Model figure.
In polarized epithelial cells, the centrosome migrates to the apical surface, and Rab19 is required for apical actin clearing and initial ciliary membrane recruitment. TTLL12 also resides at the centrosome and interacts with the α/β-tubulin heterodimer to promote tubulin arginine methylation and lysine acetylation, which is required for axoneme growth and stability.
Figure EV1
Figure EV1
(A) Spectral counts of microtubule-related candidate proteins identified through co-immunoprecipitation/mass spectrometry on FLAG-Rab19 from Jewett et al (2021). (B) Coomassie blue-stained gel with recombinant purified 6His-TTLL12, GST, and GST-Rab19. (C) Binding assay with recombinant GST-Rab19, locked with either GDP or GMP-PNP (GTP), and recombinant 6His-TTLL12 followed by Coomassie blue staining. (D) Quantification of TTLL12 band intensity in (B). Graph shows mean ± SD derived from three independent experiments. Student’s t test (two-tailed) was used for statistical analysis. (E) Western blot of MDCK WT, TTLL12 KO, and TTLL12 KO cells stably expressing GFP-TTLL12 for TTLL12 (green band). (F) Immunoprecipitation of GPF-TTLL12 followed by western blot for α- and β-tubulin. (G) Microtubule co-precipitation assay. Taxol-stabilized yeast microtubules were mixed with recombinant 6His-TTLL12 and pelleted by centrifugation. The supernatant and pellet were separated and run on a gel followed by Coomassie blue staining. (H) Quantification of TTLL12 in the pellet with or without microtubules from (G). Graph shows mean ± SD from three independent experiments. Student’s t test (two-tailed) was used for statistical analysis. (I) Immunoprecipitation of GPF-Rab19 or GFP-only from MDCK cells followed by western blot for TTLL12.
Figure EV2
Figure EV2
(A) Representative western blot and quantification of tyrosinated α-tubulin in MDCK WT, TTLL12 KO, and TTLL12 KO + GFP-TTLL12 cells. Graph shows mean ± SD derived from four independent experiments. Student’s t test (two-tailed) was used for statistical analysis. (B) Representative western blot and quantification of polyglutamylated tubulin in MDCK WT, TTLL12 KO, and TTLL12 KO + GFP-TTLL12 cells. Graph shows mean ± SD derived from four independent experiments. Student’s t test (two-tailed) was used for statistical analysis. (C) Western blot of RPE1 WT, TTLL12 KO, and TTLL12 KO 2 cells for TTLL12 (green band). (D) Representative western blot and quantification of tyrosinated α-tubulin in RPE1 WT, TTLL12 KO, and TTLL12 KO 2 cells. Graph shows mean ± SD derived from three independent experiments. Student’s t test (two-tailed) was used for statistical analysis. (E) Representative western blot and quantification of polyglutamylated tubulin in RPE1 WT, TTLL12 KO, and TTLL12 KO 2 cells. Graph shows mean ± SD derived from three independent experiments. Student’s t test (two-tailed) was used for statistical analysis. (F) Western blot of TTLL12 precipitate from wild-type or TTLL12 KO RPE1 cells. (G) Proliferation analysis of MDCK WT and MDCK TTLL12 KO cells. One-way ANOVA was used for statistical analysis. The data shown are the means and standard deviations derived from three independent experiments.
Figure EV3
Figure EV3
(A) MDCK cells stably expressing TTLL12-GFP were stained with anti-α-tubulin antibodies. Arrows point to the mitotic spindle. (B) WT or TTLL12 KO RPE cells were stained with anti-TTLL12 (green) and anti-α-tubulin (red) antibodies. Arrow points to the mitotic spindle. (C) Representative western blot and quantification of acetylated α-tubulin in RPE1 WT, TTLL12 KO, and TTLL12 KO 2 cells. Graph shows mean ± SD derived from three independent experiments. Student’s t test (two-tailed) was used for statistical analysis. (D) Example image of WT RPE1 cell expressing GFP-MACF18 used for live imaging of microtubule polymerization. Scale bar = 5 µm. (E) Quantification of the number of microtubule polymerization events that occur in each cell over the course of 4 min. Images were obtained from three independent experiments. n = 13 cells for both WT and TTLL12 KO. Graph shows mean ± SD derived from three independent experiments. Student’s t test (two-tailed) was used for statistical analysis. (F) Quantification of microtubule polymerization rates measured from GFP-MACF18 comets. Violin plot represents all microtubules measured (n = 20,427 for WT, n = 19,525 for KO). Black circles represent the average polymerization rate from each independent experiment. Graph shows mean ± SD derived from three independent experiments. Student’s t test (two-tailed) was used for statistical analysis. (G) Quantification of MACF18 comet lifetime. Plot represents all microtubules measured (n = 20,427 for WT, n = 19,525 for KO). Black circles represent the average polymerization rate from each independent experiment (N = 3). T test was performed on the means from the experiment. Student’s t test (two-tailed) was used for statistical analysis.
Figure EV4
Figure EV4
(A) Representative images of RPE1 WT and TTLL12 KO cells with or without Taxol treatment stained for acetylated tubulin and DNA (N = 1). (B) Representative images of RPE1 WT and TTLL12 KO cells with or without 1 μm of the pharmacological HDAC6 inhibitor, tubastatin A, and stained for acetylated tubulin, glutamylated tubulin, and DNA (N = 1). (C) Western blot of αTAT1 in RPE1 WT and TTLL12 KO cells. (D) Representative images of transition zone proteins NPHP4, RPGRIP1L, and TMEM67 localized to the basal body (gamma tub.) in TTLL12 KO cells. Scale bars: 5 μm. (E) Quantification of RPE1 WT and TTLL12 KO cilia with the respective transition zone proteins from (G). Graph shows mean ± SD derived from three independent experiments. (F) Quantification of primary cilium length after 8 h of serum starvation. Violin plot represents all primary cilia measured. Black circles represent average cilium length (n = 538 for WT, n = 250 for KO). Shown are the means and standard deviations derived from three independent experiments. Student’s t test (two-tailed) was used for statistical analysis. (G) Representative images of TTLL12 localization in ciliated RPE1 WT and Rab19 KO cells. Scale bar = 5 µm. (H) Quantification of TTLL12 at the base of the primary cilium from G. N = 2 and 35 cells were measured in each condition per experiment. Graph shows mean ± SD. Student’s t test (two-tailed) was used for statistical analysis.
Figure EV5
Figure EV5
(A) Fluorescence-based assay to measure methyltransferase activity. 1 µM 6His-TTLL12 was incubated with methyl donor SAM and 4 µM porcine brain tubulin and fluorescence was measured over time. Graph shows mean ± SD derived from three independent experiments. (B) 1 µM 6His-TTLL12 was incubated with methyl donor SAM and 0.5 µM histone H3 and fluorescence was measured over time. Graph shows mean and variability derived from two independent experiments. (C) 1 µM GST-TTLL12 aa1-260 was incubated with methyl donor SAM and 6 µM porcine brain tubulin and fluorescence was measured over time. Graph shows mean and variability derived from two independent experiments. (D) Immunoprecipitation of mono-methyl lysine from RPE1 cells followed by western blot for α-tubulin. Left column shows lysates (input) probed for α-tubulin. Right columns show immunoprecipitates probed for α-tubulin. (E) Immunoprecipitation of tri-methyl lysine from RPE1 cells followed by western blot for α-tubulin. Left column shows lysates (input) probed for α-tubulin. Right columns show immune-precipitates probed for α-tubulin. (F) Representative image of MDCK cells incubated in the presence or absence of high calcium deciliation buffer (images on the left). Arrows point to individual cilia. Blots on right are the purified cilia preparations immunoblotted with anti-α-tubulin, anti-me1K, anti-me3K, anti-me1R, and anti-me2R antibodies.

Update of

References

    1. Akella JS, Wloga D, Kim J, Starostina NG, Lyons-Abbott S, Morrissette NS, Dougan ST, Kipreos ET, Gaertig J. MEC-17 is an alpha-tubulin acetyltransferase. Nature. 2010;467:218–222. doi: 10.1038/nature09324. - DOI - PMC - PubMed
    1. Anvarian Z, Mykytyn K, Mukhopadhyay S, Pedersen LB, Christensen ST. Cellular signalling by primary cilia in development, organ function and disease. Nat Rev Nephrol. 2019;15:199–219. doi: 10.1038/s41581-019-0116-9. - DOI - PMC - PubMed
    1. Brants J, Semenchenko K, Wasylyk C, Robert A, Carles A, Zambrano A, Pradeau-Aubreton K, Birck C, Schalken JA, Poch O, et al. Tubulin tyrosine ligase like 12, a TTLL family member with SET- and TTL-like domains and roles in histone and tubulin modifications and mitosis. PLoS ONE. 2012;7:e51258. doi: 10.1371/journal.pone.0051258. - DOI - PMC - PubMed
    1. Bre MH, Kreis TE, Karsenti E. Control of microtubule nucleation and stability in Madin-Darby canine kidney cells: the occurrence of noncentrosomal, stable detyrosinated microtubules. J Cell Biol. 1987;105:1283–1296. doi: 10.1083/jcb.105.3.1283. - DOI - PMC - PubMed
    1. Chin HG, Esteve PO, Ruse C, Lee J, Schaus SE, Pradhan S, Hansen U. The microtubule-associated histone methyltransferase SET8, facilitated by transcription factor LSF, methylates alpha-tubulin. J Biol Chem. 2020;295:4748–4759. doi: 10.1074/jbc.RA119.010951. - DOI - PMC - PubMed