. 2024 Feb;25(2):672-703.
doi: 10.1038/s44319-023-00027-z. Epub 2024 Jan 2.

UBXN1 maintains ER proteostasis and represses UPR activation by modulating translation

Affiliations

UBXN1 maintains ER proteostasis and represses UPR activation by modulating translation

Brittany A Ahlstedt et al. EMBO Rep. 2024 Feb.

Abstract

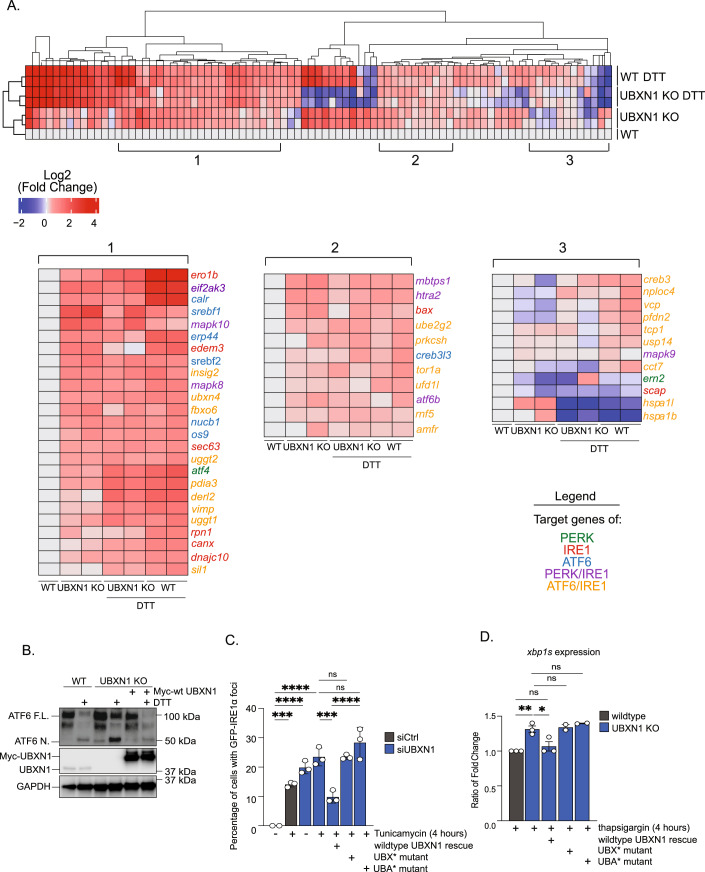
ER protein homeostasis (proteostasis) is essential for proper folding and maturation of proteins in the secretory pathway. Loss of ER proteostasis can lead to the accumulation of misfolded or aberrant proteins in the ER and triggers the unfolded protein response (UPR). In this study, we find that the p97 adaptor UBXN1 is an important negative regulator of the UPR. Loss of UBXN1 sensitizes cells to ER stress and activates the UPR. This leads to widespread upregulation of the ER stress transcriptional program. Using comparative, quantitative proteomics we show that deletion of UBXN1 results in a significant enrichment of proteins involved in ER-quality control processes including those involved in protein folding and import. Notably, we find that loss of UBXN1 does not perturb p97-dependent ER-associated degradation (ERAD). Our studies indicate that loss of UBXN1 increases translation in both resting and ER-stressed cells. Surprisingly, this process is independent of p97 function. Taken together, our studies have identified a new role for UBXN1 in repressing translation and maintaining ER proteostasis in a p97 independent manner.

Keywords: ER Stress; Translation; Ubiquitin; Unfolded Protein Response; p97.


Conflict of interest statement

The authors declare no competing interests.

Figures

Figure 1
Figure 1. UBXN1 depletion induces activation of the unfolded protein response.
(A) Immunoblot of HFT wild-type and UBXN1 KO cells treated with 1.5 mM dithiothreitol (DTT) for the indicated timepoints (0–8 h). (B) Ratio (UBXN1 KO/wildtype) of the band intensity quantifications of BiP, ATF4, and peIF2α at the 8-h timepoint corresponding to A. (n = three biologically independent samples). We only provide the 8-h quantification as the signal is not always present in wild-type cells in earlier timepoints for accurate quantification. (C) Immunoblot of HFT wild-type and UBXN1 KO cells co-treated with 1.5 mM DTT and 1 µM Bortezomib (BTZ). (D) ATF6 activation was measured by band intensity quantification and calculation of the percentage of cleaved ATF6 to total ATF6. The ratio of the percentage of ATF6 activation in UBXN1 KO cells to wildtype is reported. (n = four biologically independent samples). (E) Representative immunofluorescent image of IRE1α clustering in a stable HFT cell line expressing GFP-tagged IRE1α. UBXN1 was depleted by siRNA transfection and cells were treated with 2.5 µM tunicamycin (Tu) for 4 h to induce IRE1α clustering (Scale bar: 10 µm). (F) Quantification corresponding to E reporting the percent of cells with GFP-IRE1α foci as well as the number of GFP-IRE1α foci per cell (n = three biologically independent samples). (G) Transcript levels of xbp1s and total xbp1 in HFT wild-type and UBXN1 KO cells quantified by quantitative real-time PCR. Cells were treated with 10 nM thapsigargin (Tg) for 4 h as indicated. (n = three biologically independent samples). H Transcript levels of xbp1s, bloc1s1, and cd59 were quantified by quantitative real-time PCR. Cells were treated with 2 mM DTT for 4 h where indicated. (n = three biologically independent samples). Data information: Data are means ± SEM (*, **, ***, **** where P < 0.05, 0.01, 0.001, and 0.0001, respectively.) Unpaired two-tailed t test (B, D) or one-way ANOVA with Tukey’s multiple comparisons test (FH). Source data are available online for this figure.
Figure 2
Figure 2. Loss of UBXN1 activates an ER stress transcriptional program.
(A) Heat map displays the hierarchical clustering of the log2 fold change of 84 UPR target genes determined by the Human Unfolded Protein Response real-time PCR profiler array. The range is from a log2 fold change of -2 (blue) to a log2 fold change of 4 (red). The untreated wild-type column is displayed as an average of biological duplicates with the log2 fold change set to zero for this column. Additional columns represent biological duplicates of untreated UBXN1 KO cells, biological duplicates of UBXN1 KO cells treated with 1.5 mM DTT, and biological duplicates of HFT wild-type cells treated with 1.5 mM DTT for 4 hours respectively. Section 1 and 2 represent UPR target genes that experience increased expression in the untreated UBXN1 KO cells as well as UBXN1 KO and wild-type cells treated with DTT. Section 3 represents a set of UPR target genes that experience decreased expression in all samples compared to untreated wild-type samples. Genes are color coded by the upstream UPR stress sensor that induces their expression: PERK (green); IRE1 (red); ATF6 (blue); PERK and IRE1 (purple); ATF6 and IRE1 (orange). (n =  two biologically independent samples). (B) Rescue of ATF6 processing (ATF6-N) in UBXN1 KO cells by re-expression of Myc-tagged wild-type UBXN1 (n = three biologically independent samples). (C) Quantification of the percent of cells with GFP-IRE1α foci in control cells and cells depleted of UBXN1 with siRNA. Myc-tagged wildtype, UBX point mutant, and UBA point mutant were expressed into UBXN1-depleted cells before treatment with 2.5 µM tunicamycin (Tu) for 4 h to induce IRE1α clustering. (n = three biologically independent samples). (D) Ratio of the relative expression of xbp1s in wild-type and UBXN1 KO cells treated with 10 nM thapsigargin for 4 hours. Myc-tagged wildtype, UBX point mutant, and UBA point mutant were expressed into UBXN1-depleted cells for 48 h before thapsigargin treatment. (n ≥ two biologically independent samples). Data information: Data are means ± SEM (*, **, ***, **** where P < 0.05, 0.01, 0.001, and 0.0001, respectively.) One-way ANOVA with Šídák’s multiple comparisons test (C) and Tukey’s multiple comparisons test (D). Source data are available online for this figure.
Figure 3
Figure 3. UBXN1 deletion sensitizes cells to ER stress with consequent reduction in cellular viability.
(A) Recovery from ER stress was determined by crystal violet staining. Wild-type or UBXN1 KO cells were treated with 200 nM thapsigargin (Tg) for the indicated timepoints and released into drug free media. Colonies were allowed to grow out for three days and live cells were stained with crystal violet. (B) Percent recovery calculated from the remining cells in A. (n = four biologically independent samples). (C) Fold change of the fluorescence identified by fluorescence-based cytotoxity assay. Wild-type and UBXN1 KO cells were treated with either 500 or 250 nM thapsigargin for 24-, 48-, or 72-h with fluorescent readings taken every 24-h. Values were normalized to untreated for each genotype. Note we observe no differences in viability between wild-type and UBXN1 KO cells in untreated conditions allowing for this normalization (n =  three biologically independent samples). (D) Immunoblot of HFT wild-type and UBXN1 KO cells treated with 1.5 mM dithiothreitol (DTT) for the indicated timepoints (0–8 h). (E) Band intensity quantifications of CHOP expression at the 8-h timepoint corresponding to C. (n = three biologically independent samples). We only provide the 8-h quantification as the signal is not present in wild-type cells in earlier timepoints for accurate quantification. Data information: Data are means ± SEM (*, **, ***, **** where P < 0.05, 0.01, 0.001, and 0.0001, respectively.) Unpaired two-tailed t test (B, E) or one-way ANOVA with Tukey’s multiple comparisons test (C). Source data are available online for this figure.
Figure 4
Figure 4. Loss of UBXN1 leads to a perturbed ER proteome.
(A) Schematic workflow of quantitative tandem mass tag (TMT) proteomics in HFT wild-type and CRISPR-Cas9 UBXN1 knock-out (KO) cells. (B) Volcano plot of the (−log10-transformed P value versus the log2-transformed ratio of wildtype/UBXN1 KO) proteins identified by TMT proteomics in wild-type and UBXN1 KO cells. A negative log2 fold change indicates proteins with increased abundance in UBXN1 KO cells. Proteins with a log2 fold change ≥ |1| are considered significant. ER membrane and luminal proteins are outlined by a red and blue circle respectively. Proteins involved in translocation into the ER and glycosylation are colored in green and blue respectively (n = 2 biologically independent samples for each genotype). (C) Clients in the secretory pathway and mitochondrial proteins identified by proteomics. Proteins were characterized by ER-targeting signal (transmembrane domain or signal sequence) and then further characterized into single-pass Type 1 (red outline) or Type 2 (blue outline) and multi-pass membrane protein. Mitochondrial proteins were further characterized into outer- and inner- mitochondrial membrane and matrix proteins. Proteins enriched in UBXN1 KO cells are in gray and those depleted in UBXN1 KO cells are in green.
Figure 5
Figure 5. Depletion of UBXN1 increases the expression of clients in the secretory pathway.
(A, B) Representative immunoblots of proteins identified to be enriched in the proteomics study. Protein levels of the ER (TRAPα) and secretory (ALPP2) proteins were measured in control cells or cells depleted of UBXN1 with siRNA. Cells were treated with 10 mM DTT for 4 h where indicated. (C) Immunoblot of a stable HFT cell line expressing doxycycline inducible FLAG-tagged α-galactosidase (AGAL). UBXN1 was depleted with siRNA before AGAL induction. Cells were treated with 10 mM DTT for 4 hours where indicated. (DF) Representative immunoblots of cytosolic (G3BP1 and HSP90) and nuclear (MCM3) proteins measured in control or UBXN1-depleted cells. Cells were treated with 10 mM DTT for 4 hours where indicated. (G) Band intensity quantifications of protein expression corresponding to AF. (n = three biologically independent samples). (H) Immunoblots demonstrating protein turnover of the proteomics hits (SQLE and SCD1) measured by cycloheximide chase time course in siRNA UBXN1-depleted cells. (I) Quantifications of SQLE and SCD1 turnover from H. (n = three biologically independent samples). (J) Immunoblot of soluble and insoluble fractions of FLAG-tagged AGAL in control cells or cells depleted of UBXN1 with siRNA. Cells were treated with 10 mM DTT for 4 hours where indicated. (In this experiment only, we quantified and ran 2.5x less siUBXN1 protein so we could accurately visualize and compare siControl to siUBXN1. The AGAL expression in siUBXN1 cells is much stronger than what can be observed with siControl.). Data information: Data are means ± SEM (*, **, ***, **** where P < 0.05, 0.01, 0.001, and 0.0001, respectively.) One-way ANOVA with Tukey’s multiple comparisons test (G) or Unpaired two-tailed t test (I). Source data are available online for this figure.
Figure 6
Figure 6. UBXN1 depletion impacts mitochondrial proteins and alters morphology.
AD Representative immunoblots of mitochondrial proteins (TOMM20, CYC1, TOMM70, TIMM23, and TIMM17A) in siRNA UBXN1 depleted cells. Cells were treated with 10 mM DTT (4 h) where indicated. (E) Band intensity quantifications of protein expression corresponding to AD (n = three biologically independent samples). (F) Representative immunofluorescent image of wild-type and UBXN1 KO cells stained with TOMM20 to image mitochondria. Cells were treated with 1.5 μM thapsigargin for 6 h or antimycin A with oligomycin A (AO) for 2 h where indicated. (Scale bar: 10 µm) (G) Quantification of the mitochondrial branch mean length (μm) of wild-type and UBXN1 KO cells from F. (n = 38–61 cells per condition as indicated in the bar graph, from a total of three biologically independent samples). Data information: Data are means ± SEM (*, **, ***, **** where P < 0.05, 0.01, 0.001, and 0.0001, respectively.) One-way ANOVA with Tukey’s multiple comparisons test (E, G). Source data are available online for this figure.
Figure 7
Figure 7. UBXN1 represses protein translation.
(A) Immunoblot of puromycin incorporation into HFT wild-type and UBXN1 KO cells. Cells were pulsed with 1 µM puromycin or 1 µM puromycin in combination with 10 µg/mL cycloheximide (CHX) for 30 min. When applicable, cells were pretreated with 1.5 mM DTT for 1 h before 1 µM puromycin pulse for 30 min. The level of puromycin incorporation reflects the rate of protein synthesis. (B) Puromycin, DTT, and CHX plots correspond to the intensity of each lane in the immunoblot in A. The intensity of the traces for each wild-type and UBXN1 KO sample was determined by the plot profile feature in Fiji. The x-axis represents the distance along the lane. (C) Myc-tagged GFP, wildtype, UBX domain mutant, or UBA domain mutant UBXN1 was expressed in cells for 48 hours before 1 µM puromycin pulse for 30 minutes. (D) Quantification of each lane intensity from C. (n = three biologically independent samples). (E) Polysome profile traces of HEK-293T wild-type and UBXN1 KO cells. Cells were treated with 2 mM DTT for 60 minutes where indicated. The 40S, 60S, and 80S ribosomal subunits are labeled as well as actively translating polysomes. Traces to the right correspond to the polysomes seen in the main trace. (F) Polysome profile traces of HEK-293T cells depleted of p97 with siRNA. Cells were treated with 2 mM DTT for 60 min where indicated. The 40S, 60S, and 80S ribosomal subunits are labeled as well as actively translating polysomes. Traces to the right correspond to the polysomes seen in the main trace. Data information: Data are means ± SEM (** where P < 0.01) One-way ANOVA with Tukey’s multiple comparisons test (D). Source data are available online for this figure.
Figure 8
Figure 8. Inhibiting translation rescues the UPR and cell death phenotypes in UBXN1 KO cells.
(A) Relative xbp1s expression quantified by quantitative real-time PCR. Cells were treated with 10 nM thapsigargin in combination with 10 μg/ml cycloheximide where indicated. (n = three biologically independent samples. (B) Fold change of the fluorescence measured by fluorescence-based cytotoxicity assay. Cells were treated with 1.5 μM thapsigargin in combination with 10 μg/ml cycloheximide where indicated. Values were normalized to untreated for each genotype. Note we observe no differences in viability between wild-type and UBXN1 KO cells in untreated conditions allowing for this normalization (n = three biologically independent samples. (C) Model Figure. UBXN1 plays an important role in ER-quality control as a repressor of translation and the UPR. Loss of UBXN1 increases protein synthesis. Increased abundance of ER proteins leads to protein misfolding and activation of the UPR which reduces cell viability. Some p97 ERAD clients may require UBXN1 for degradation. Data information: Data are means ± SEM (*, **, ***, **** where P < 0.05, 0.01, 0.001, and 0.0001, respectively.) One-way ANOVA with Tukey’s multiple comparisons test (A, B). Source data are available online for this figure.
Figure EV1
Figure EV1. Acute BAG6 and UBXN1 depletion and pharmacological inhibition of p97 induces activation of the unfolded protein response.
(A) Immunoblot of BiP and ATF4 expression levels in HFT wildtype cells treated with 1 µM thapsigargin (Tg), 5 µM of the ATP-competitive p97 inhibitor CB-5083, or both for the indicated timepoints (0–6 hours). (B,C) Band intensity quantifications of BiP (B) and ATF4 (C) corresponding to Figure EV1A reporting the fold change compared to the untreated condition (n = three biologically independent samples). (D) Immunoblot of HFT wildtype cells depleted of BAG6 with siRNA for 48 hours before treatment with 1.5 mM DTT for the indicated timepoints (0–8 hours). (E) Band intensity quantifications of BiP and ATF4 corresponding to Figure EV1D at the 8-hour timepoint. (n = four biologically independent experiments). (F) Transcript levels of xbp1s and total xbp1 in HEK-293T wildtype and UBXN1 KO cells quantified by quantitative real-time PCR. Cells were treated with 10 nM thapsigargin (Tg) for 4 hours as indicated. (n = three biologically independent samples). (G) Immunoblot of BiP and ATF4 expression in cells depleted of UBXN1 with siRNA. Cells were treated with 1.5 mM DTT for the indicated time points. (H) Band intensity quantifications of BiP and ATF4 from Figure EV1G at the 8-hour time point. (n = four biologically independent experiments). (I) Immunoblot of ATF6 activation in cells depleted of UBXN1 with siRNA. Cells were treated with 1.5 mM DTT and 1 µM Bortezomib (BTZ). (J) ATF6 activation was measured by band intensity quantification and calculation of the percentage of cleaved ATF6 to total ATF6. The ratio of the percentage of ATF6 activation in UBXN1 KO cells to wildtype is reported. (n = three biologically independent samples). Data information: Data are means ± SEM (*, **, ***, **** where P < 0.05, 0.01, 0.001, and 0.0001, respectively.) One-way ANOVA with Dunnetts multiple comparisons test (B,C). Unpaired two-tailed t test (E,H,J). One-way ANOVA with Tukey’s multiple comparisons test (F).
Figure EV2
Figure EV2. UBXN1 localizes to ER-microsomes.
(A) Immunofluorescent staining of ubiquitin (FK2) and nuclei (Hoechst dye) in HFT wildtype and UBXN1 KO cells. Cells were treated with 1 µM of the proteasome inhibitor bortezomib (BTZ), Tunicamycin (Tu), or Thapsigargin (Tg) for 8 hours or 1 µM BTZ, 500 nM Tu, or 500 nM Tg for 18 hours. (Scale bar: 10 µm) (B) Immunoblot assessing total ubiquitin levels corresponding to Figure EV2A. (C) Subcellular fractions enriched in ER-derived microsomes were isolated from HEK-293T cells by biochemical fractionation. Protease protection assay was used to localize UBXN1 to the ER periphery by immunoblot. Calnexin and Sec61β are ER specific markers, β-actin is a cytosolic marker, and TOMM20 is a mitochondrial marker. (PNS: post-nuclear supernatant sample, cyto: cytosolic sample). (D) Immunoblot for the immunoprecipitation of endogenous UBXN1 from HEK-293T lysates. 10 and 20 µg of whole cell lysate was used for the input. Sec61β was used as a marker for the Sec61 translocon. (E) UBXN1 and Sec61β were separately immunoprecipitated from ER-microsomes isolated from HEK-293T cells. 10 and 20 µg of whole cell lysate was used for the input.
Figure EV3
Figure EV3. Loss of UBXN1 leads to a perturbed ER proteome.
(A) Interaction network of the gene ontology clusters from the wildtype/UBXN1 KO quantitative proteomics study with a significant increase in abundance in UBXN1 KO cells. Proteins found in each node are labeled and the color of each circle corresponds to the −log10-transformed P value. (B) Bubble plot corresponding to significantly enriched gene ontology groups in the wildtype (navy) and UBXN1 KO (teal). The size of the circle corresponds to the number of genes identified in each term. (C) Proteins identified by proteomics categorized by organellar compartment. Proteins associated with the ER experience a significant increase in abundance in UBXN1 KO cells where mitochondrial proteins are significantly decreased n = two biological replicates. Box plots show median -log fold change (wildtype: knockout), upper quartile represents the 75th percentile and lower quartile represents 25th percentile. The whiskers represent minimum and maximum -log fold change (wildtype: knockout) for each category.
Figure EV4
Figure EV4. Depletion of UBXN1 increases the expression of ER-destined proteins.
(A) Immunoblot of HFT wildtype cells expressing HA-tagged prion protein (PrP). PrP was expressed in HeLa cells for before siRNA mediated depletion of UBXN1. Cells were treated with 500 nM thapsigargin, 1 µM bortezomib (BTZ), or both for 16 hours. The percent mislocalization was calculated from the ratio of the mislocalized (cytosolic) form to all forms of PrP for that sample. (B) Total PrP protein expression was calculated by the sum of all forms of PrP for that sample. The untreated condition was quantified (lanes 1 and 5) (n = three biologically independent experiments). (C) Transcript levels of several ER-destined proteins from cells depleted of UBXN1 by siRNA quantified by real-time PCR. Control is cDNA generated from cells not expressing HA-PrP. (n = three biologically independent experiments). (D) Immunoblot examining the turnover of HA-PrP in siRNA control and UBXN1 depleted cells. Cells were treated with 10 µg/mL cycloheximide (CHX) for the indicated timepoints (0–8 hours). (E) Quantification of PrP turnover from Figure EV4D. (F) Immunoblot of a stable HFT cell line expressing doxycycline inducible FLAG-tagged AGAL. Glycans were digested with EndoH for 4 hours to generate the non-glycosylated form. (G) Turnover of FLAG-AGAL in HEK293T cells depleted of UBXN1 and treated with cycloheximide to monitor half life. (H) Quantification of EV4G. For turnover studies, the zero-hour time point was set to 100% for each siRNA and the % of PrP or AGAL remaining for each time point was quantified as a ratio from the zero-hour timepoint. (n = three biologically independent experiments). Data information: Data are means ± SEM (*, **, and *** where P < 0.05, 0.01, and 0.001 respectively.) Unpaired two-tailed t test (B, C, E, H).
Figure EV5
Figure EV5. UBXN1 suppresses protein synthesis.
(A) Densitometry quantifications of the entire lanes corresponding to Fig. 7A (n ≥ three biologically independent experiments). (B) Immunoblot of HFT wildtype and UBXN1 KO cells pulsed with 1 µM puromycin for 30 min after pre-treatment with 1.5 μM thapsigargin for 30 minutes where indicated. (C) Immunoblot of 1 µM puromycin incorporation into control cells, or cells depleted of p97 or UBXN1 with siRNA for 48 hours. Cells were pre-treated with 1 µM thapsigargin for 30 minutes where indicated. (D) Quantification of the whole lane corresponding to each lane in the immunoblot in Figure EV5C (n = four biologically independent samples). (E) Immunoblot validating the siRNA knockdown corresponding to Fig. 7F. (F) Immunoblot of ribosome and polysome fractions collected with corresponding UV traces showing 40S, 60S, 80S and polysome fractions. RPL4 is a marker for the 60S subunit and RPS3 is a marker for the 40S subunit. Whole cell lysates (WCL) are shown for input. (G) UBXN1 KO cells have similar viability to wildtype cells under resting conditions. Data shown in Main Fig. 8B is shown here without normalization to untreated in each genotype. We observe no differences in viability between wildtype and UBXN1 KO cells in untreated conditions allowing for this normalization. Fold change of the fluorescence measured by fluorescence-based cytotoxicity assay. Cells were treated with 1.5 μM thapsigargin in combination with 10 μg/ml cycloheximide where indicated. Values were normalized to wildtype untreated. (n = three biologically independent samples). Data information: Data are means ± SEM (*, **, *** and **** where P < 0.05, 0.01, 0.001 and 0.0001, respectively.) Unpaired two-tailed t test (A). One-way ANOVA with Tukey’s multiple comparisons test (D, G).

References

    1. Adachi Y, Itoh K, Yamada T, Cerveny KL, Suzuki TL, Macdonald P, Frohman MA, Ramachandran R, Iijima M, Sesaki H. Coincident phosphatidic acid interaction restrains Drp1 in mitochondrial division. Mol Cell. 2016;63:1034–1043. - PMC - PubMed
    1. An H, Harper JW. Ribosome abundance control via the ubiquitin-proteasome system and autophagy. J Mol Biol. 2020;432:170–184. - PMC - PubMed
    1. Atkin JD, Farg MA, Walker AK, Mclean C, Tomas D, Horne MK. Endoplasmic reticulum stress and induction of the unfolded protein response in human sporadic amyotrophic lateral sclerosis. Neurobiol Dis. 2008;30:400–407. - PubMed
    1. Beausoleil SA, Villen J, Gerber SA, Rush J, Gygi SP. A probability-based approach for high-throughput protein phosphorylation analysis and site localization. Nat Biotechnol. 2006;24:1285–1292. - PubMed
    1. Bellucci A, Navarria L, Zaltieri M, Falarti E, Bodei S, Sigala S, Battistin L, Spillantini M, Missale C, Spano P. Induction of the unfolded protein response by alpha-synuclein in experimental models of Parkinson’s disease. J Neurochem. 2011;116:588–605. - PubMed