

Spatial distribution and temporal trends of tuberculosis case notifications, Uganda: a ten-year retrospective analysis (2013-2022)
- PMID: 38177991
- PMCID: PMC10765632
- DOI: 10.1186/s12879-023-08951-0
Spatial distribution and temporal trends of tuberculosis case notifications, Uganda: a ten-year retrospective analysis (2013-2022)
Abstract
Background: Uganda has a high incidence and prevalence of tuberculosis (TB). Analysis of spatial and temporal distribution of TB is an important tool for supporting spatial decision-making, planning, and policy formulations; however, this information is not readily available in Uganda. We determined the spatial distribution and temporal trends of tuberculosis notifications in Uganda, 2013-2022.
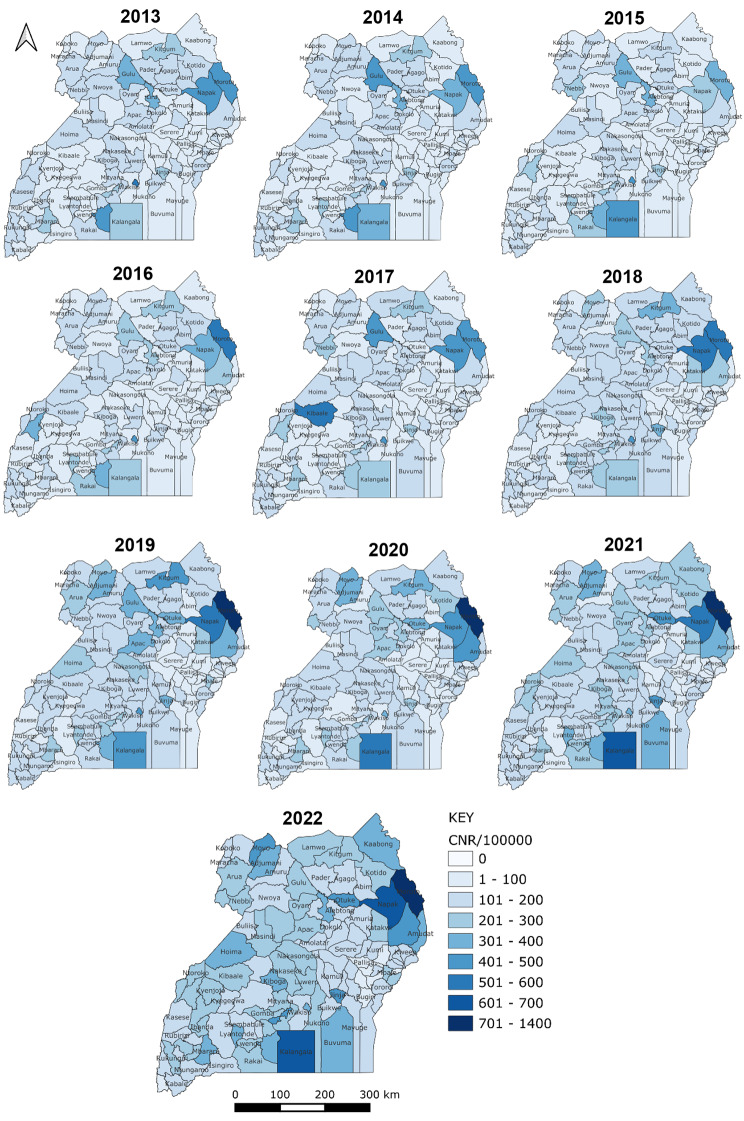
Methods: We conducted a retrospective analysis of routinely-generated program data reported through the National TB and Leprosy Programme (NTLP) surveillance system. We abstracted data on all TB cases diagnosed from 2013 to 2022 by district and region. We drew choropleth maps for Uganda showing the TB case notification rates (CNR) per 100,000 and calculated the CNR using the cases per district as the numerator and individual district populations as the denominators. Population estimates were obtained from the 2014 National Population and Housing Census, and a national growth rate of 3% was used to estimate the annual population increase.
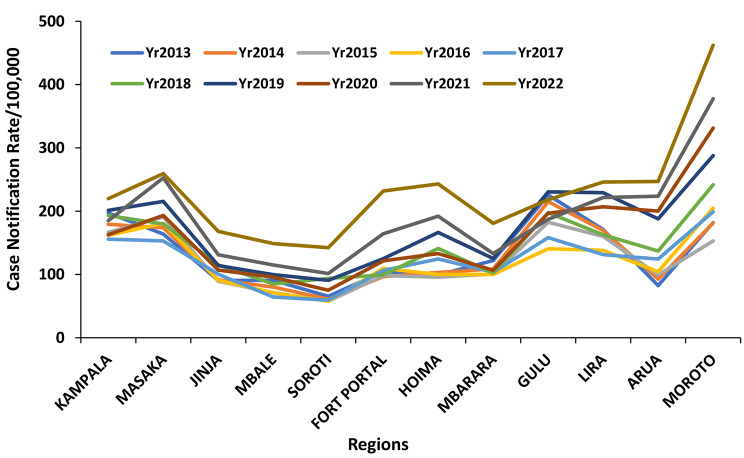
Results: Over the entire study period, 568,957 cases of TB were reported in Uganda. There was a 6% annual increase in TB CNR reported from 2013 (134/100,000) to 2022 (213/100,000) (p-value for trend p < 0.00001). Cases were reported from all 12 Ministry of Health regions during the entire period. The distribution of CNR was heterogeneous throughout the country and over time. Moroto, Napak and Kampala districts had consistently high CNR throughout the ten years. Kalangala district had lower CNR from 2013 to 2018 but high CNR from 2019 to 2022. Moroto region, in the northeast, had consistently high CNR while Mbale and Soroti regions in Eastern Uganda had the lowest CNR throughout the ten years.
Conclusion: There was an overall increasing trend in TB CNR from 2013 to 2022. We recommend that the National TB program institutes intensified measures aided by more funding to mitigate and reverse the negative impacts of the COVID-19 pandemic on TB.
Keywords: Case Notification Rate; Spatial distribution; Temporal trends; Tuberculosis; Uganda.
© 2024. The Author(s).
Conflict of interest statement
The authors declare that they have no competing interests.
Figures

References
-
- World Health Organisation. Tuberculosis (TB) [Internet]. [cited 2023 Aug 14]. Available from: https://www.who.int/news-room/fact-sheets/detail/tuberculosis.
-
- World Health Organisation. Global Tuberculosis Report 2022 [Internet]. [cited 2023 Aug 14]. Available from: https://www.who.int/teams/global-tuberculosis-programme/tb-reports/globa....
-
- Quality of Tuberculosis Services Assessment in Uganda: Report — MEASURE Evaluation [Internet]. [cited 2021 Nov 2]. Available from: https://www.measureevaluation.org/resources/publications/tr-20-398.html.
-
- Munch Z, Van Lill SWP, Booysen CN, Zietsman HL, Enarson DA, Beyers N. Tuberculosis transmission patterns in a high-incidence area: a spatial analysis. Int J Tuberc Lung Dis. 2003;7(3):271–7. - PubMed
MeSH terms
LinkOut - more resources
Full Text Sources
Medical
