. 2024 Jan 4;21(1):11.
doi: 10.1186/s12974-023-03004-4.

Doxycycline for transgene control disrupts gut microbiome diversity without compromising acute neuroinflammatory response

Affiliations

Doxycycline for transgene control disrupts gut microbiome diversity without compromising acute neuroinflammatory response

Emily J Koller et al. J Neuroinflammation. .

Abstract

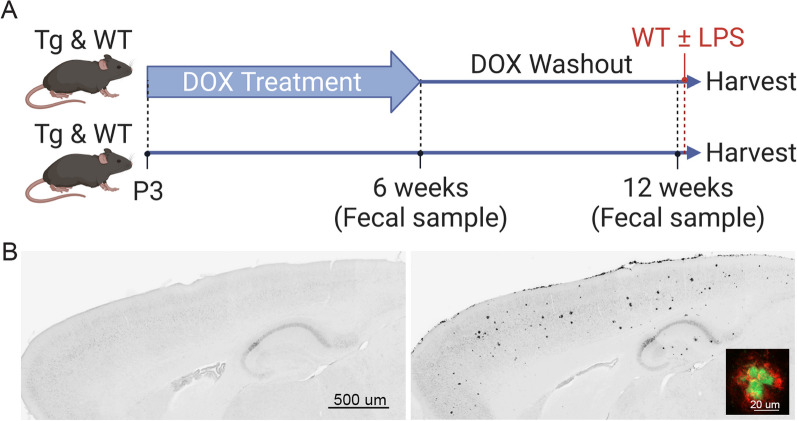
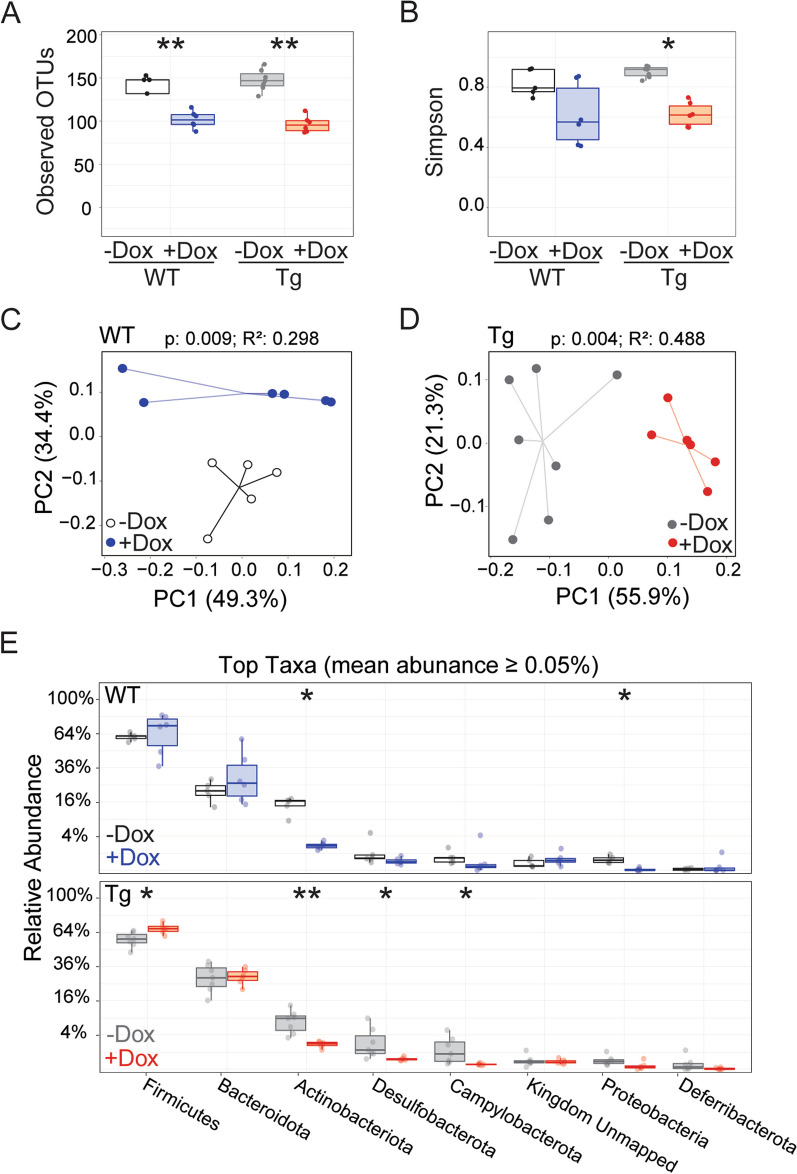
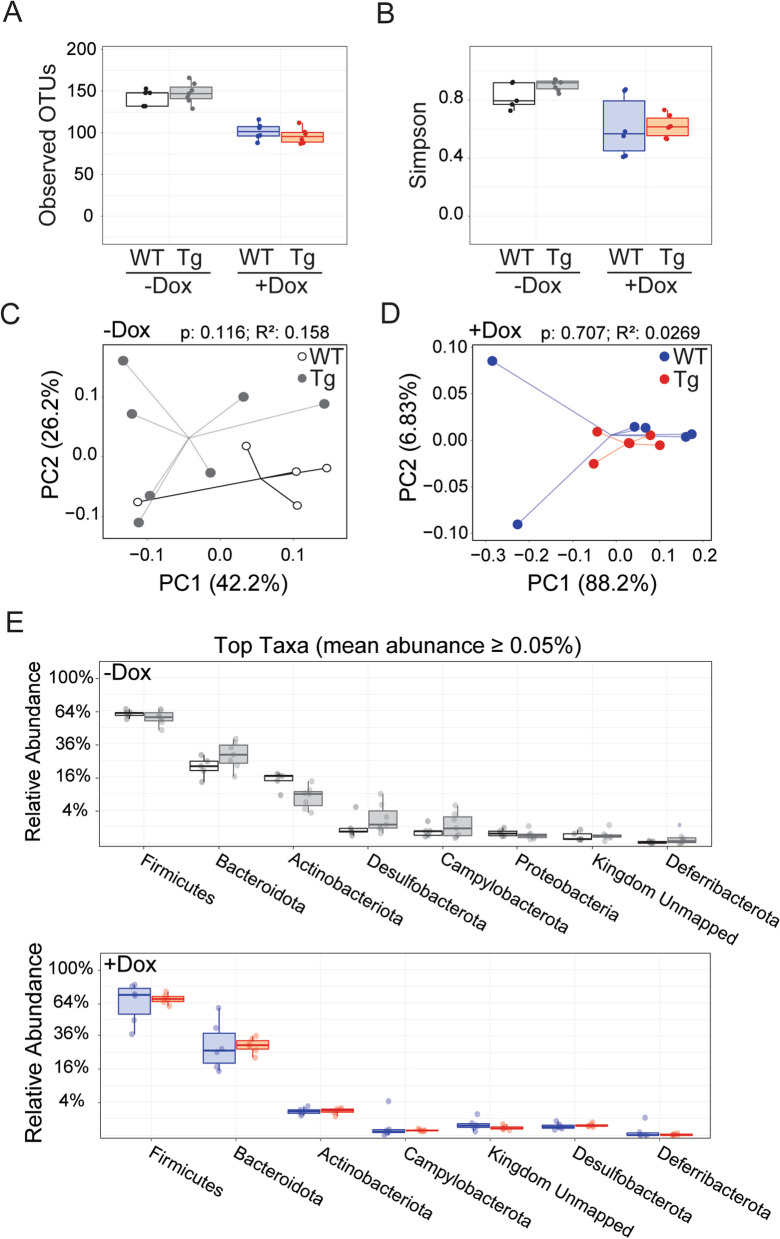
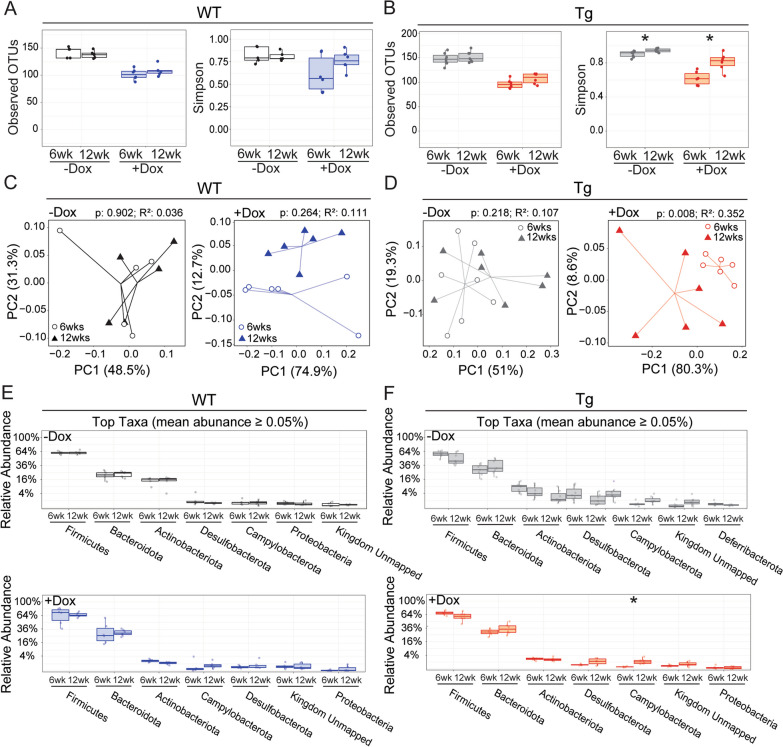
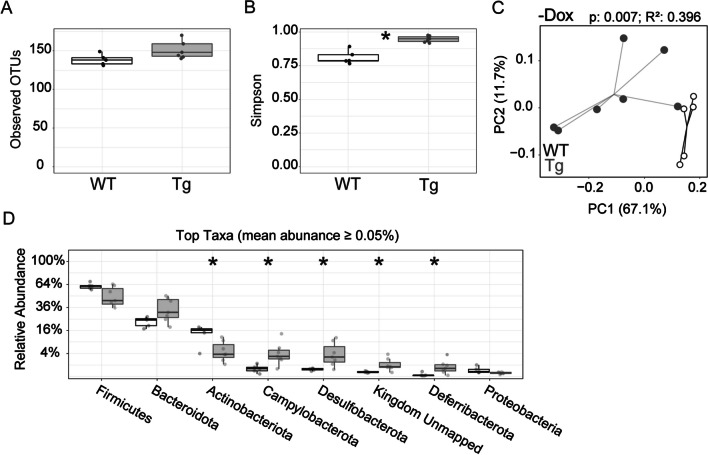
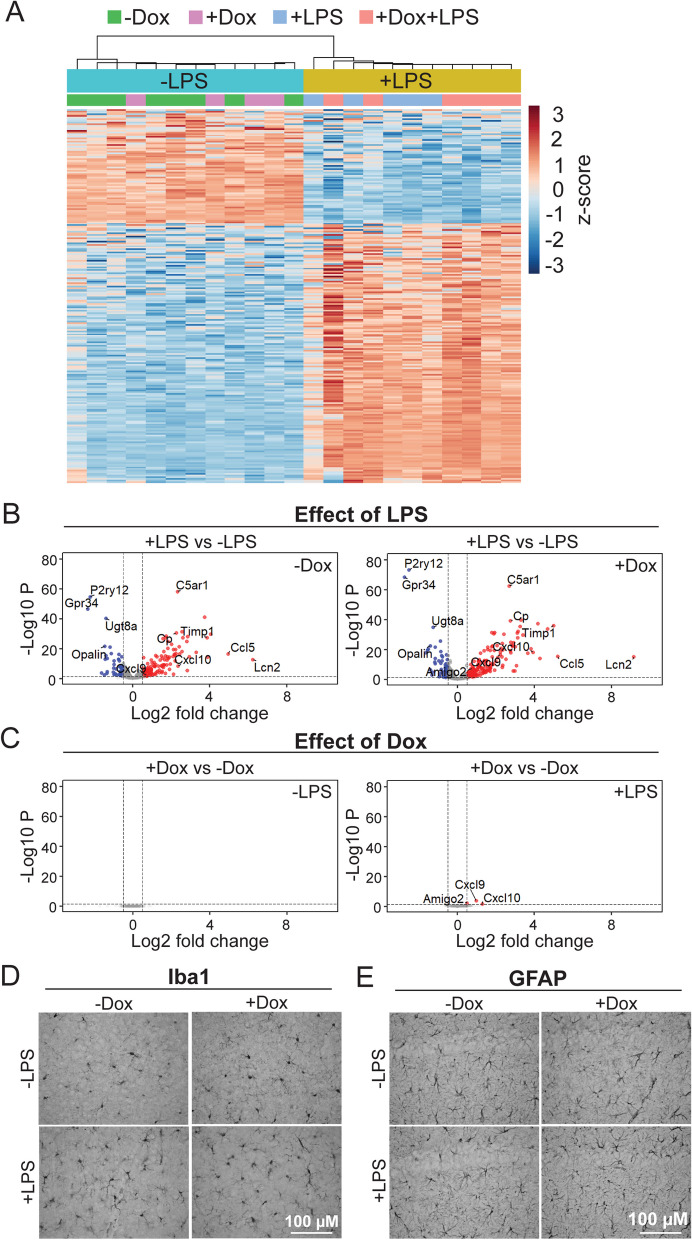
The tetracycline transactivator (tTA) system provides controllable transgene expression through oral administration of the broad-spectrum antibiotic doxycycline. Antibiotic treatment for transgene control in mouse models of disease might have undesirable systemic effects resulting from changes in the gut microbiome. Here we assessed the impact of doxycycline on gut microbiome diversity in a tTA-controlled model of Alzheimer's disease and then examined neuroimmune effects of these microbiome alterations following acute LPS challenge. We show that doxycycline decreased microbiome diversity in both transgenic and wild-type mice and that these changes persisted long after drug withdrawal. Despite the change in microbiome composition, doxycycline treatment had minimal effect on basal transcriptional signatures of inflammation the brain or on the neuroimmune response to LPS challenge. Our findings suggest that central neuroimmune responses may be less affected by doxycycline at doses needed for transgene control than by antibiotic cocktails at doses used for experimental microbiome disruption.

Keywords: APP transgenic mouse; Amyloid; Antibiotic; Doxycycline; Gut microbiome; LPS; Lipopolysaccharide; Microglia; Neuroinflammation; Tetracycline transactivator; Transcriptome.


Conflict of interest statement

The authors declare that they have no competing interests.

Figures

Fig. 1
Fig. 1
Schematic of experimental design. A Transgenic APP/TTA (Tg) and wild-type (WT) mice were split into two groups: one group received dox chow from P3 until P42, the other group received standard chow. At 6 wk, a fecal sample was collected from all mice and dox chow was removed. At 12 wk, another fecal sample was collected from all mice. Following fecal sampling at 12 wk, WT mice were used for LPS injection. Additional WT mice were injected with saline at 12 wk as controls for LPS without prior microbiome sampling. All mice, Tg and WT, were harvested 18 h after injection of the WT mice. B Aβ immunostaining of Tg mice harvested at 12 wk. Mice treated with dox for 6 wk followed by 6 wk of transgene expression showed no evidence of amyloid pathology (left). Amyloid pathology was observed across the cortex and hippocampus in untreated mice that expressed transgenic APP from birth (right). Most plaques were fibrillar deposits and co-labeled for Aβ (red, inset) and thioflavin-S (green). Created with BioRender
Fig. 2
Fig. 2
Dox treatment disrupts the gut microbiome in both Tg and WT mice. Analysis of gut microbiome from stool samples collected at 6 wk of age while half of each genotype was still receiving dox chow, focusing on the effect of dox exposure. A, B Observed OTUs (A) and Simpson index (B) reveal that dox treatment reduced α-diversity in both Tg and WT mice. C, D Principal coordinate analysis (PCoA) of weighted UniFrac distances indicate that dox altered β-diversity in both WT (C) and Tg mice (D). E The relative abundance of bacterial taxa was shifted by dox treatment in both genotypes. Statistical testing: Kruskal–Wallis (A, B), PERMANOVA (C, D), and Mann–Whitney U, reporting FDR-adjusted p-value (E). n = 5–7 mice/group. *p > 0.05, **p > 0.01. Red and blue = dox-treated Tg and WT, respectively; grey and white = untreated Tg and WT, respectively
Fig. 3
Fig. 3
APP overexpression does not affect gut microbiome diversity prior to amyloid onset. Analysis of gut microbiome from stool samples collected at 6 wk of age while half of each genotype was still receiving dox chow, focusing on the effect of genotype. A, B Graphs of observed OTUs (A) and Simpson index (B) reveal that genotype had no effect on α-diversity at this age. Both measures were similar across genotypes whether APP overexpression was active (in untreated Tg mice) or not (with dox suppression). C, D PCoA plots of weighted UniFrac distances indicate that genotype did not affect β-diversity in untreated (C) or dox-treated mice (D). E The relative abundance of bacterial taxa is similar between genotypes at 6 wk of age for both treatment conditions. Statistical testing: Kruskal–Wallis (A, B), PERMANOVA (C, D), and Mann–Whitney U (E). n = 5–7 mice/group. Red and blue = dox-treated Tg and WT, respectively; grey and white = untreated Tg and WT, respectively
Fig. 4
Fig. 4
Changes to the gut microbiome largely persist following dox washout. Analysis of gut microbiome from stool samples collected at 6 and 12 wk of age, assessing the effect of time in untreated mice and of drug washout in dox-treated mice. A, B Observed OTUs (left) and Simpson index (right) as a function of age in untreated mice and of drug washout in dox-treated mice. Observed OTUs are unaffected by time and washout, while Simpson is increased in Tg mice both with age and drug removal. (A, WT; B, Tg). C, D PCoA plots of weighted UniFrac distances show that the overlap in species (β-diversity) was changed by drug washout for Tg mice but not WT, while neither genotype is altered by age alone (C, WT; D, Tg). E, F Relative abundance of bacterial taxa was unchanged by age alone (limited to taxa with average abundance ≥ 0.05% across all samples); only one phylum increased significantly upon drug washout in Tg mice (E, WT; F, Tg). Statistical testing: Kruskal–Wallis (A, B), PERMANOVA (C, D), and Mann–Whitney U, reporting FDR-adjusted p-value (E, F). n = 5–7 mice/group. *p < 0.05. Red and blue = dox-treated Tg and WT, respectively; grey and white = untreated Tg and WT, respectively
Fig. 5
Fig. 5
APP overexpression alters the gut microbiome at 12 wk of age with the onset of amyloid pathology. Analysis of gut microbiome from stool samples collected at 12 wk of age, assessing the effect of genotype in untreated mice. A, B Observed OTUs (A) and Simpson index (B) reveal that the onset of amyloid formation in untreated Tg mice significantly increased bacterial evenness (α-diversity) at this age. C PCoA plots of weighted UniFrac distances indicate that genotype significantly altered β-diversity. D The relative abundance for 5 of the top 8 bacterial taxa was significantly altered in Tg mice with the onset of amyloid deposits. Statistical testing: Mann–Whitney (A, B), PERMANOVA (C, D), and Mann–Whitney U (E). n = 5–7 mice/group. *p < 0.05. Grey and white = untreated Tg and WT, respectively
Fig. 6
Fig. 6
Transcriptional response to LPS challenge is unaffected by prior dox treatment. A Transcriptomic analysis of neuroinflammatory genes in cortical tissue of 12-wk-old WT mice challenged with systemic LPS or saline 18 h prior to harvest. Heatmap shows log-transformed counts of differentially expressed genes for each sample, colors represent row-normalized z score. Unbiased hierarchical clustering separated animals by LPS treatment, but not dox condition. B Volcano plots show that the same genes are up- or down-regulated by LPS challenge in both dox-treated and untreated mice. Genes with an adjusted p-value < 0.05 and an absolute value of logFC > 0.5 were considered statistically significant and are indicated with red (upregulated) and blue (downregulated) dots. C Volcano plots show that few genes differ significantly as a function of dox treatment within LPS-challenged or saline-injected animals. D, E Representative 40 × images of Iba1 immunostaining in the cortex (D) and GFAP immunostaining in the hippocampus (E) of WT mice show little difference in morphology or distribution of either cell type between conditions. n = 5–7 per group. Scale bar: 100 µm

Similar articles

Cited by

References

    1. Jankowsky JL, Zheng H. Practical considerations for choosing a mouse model of Alzheimer’s disease. Mol Neurodegener. 2017;12(1):89. doi: 10.1186/s13024-017-0231-7. - DOI - PMC - PubMed
    1. Lee S, Shang Y, Redmond SA, Urisman A, Tang AA, Li KH, et al. Activation of HIPK2 promotes ER stress-mediated neurodegeneration in amyotrophic lateral sclerosis. Neuron. 2016;91(1):41–55. doi: 10.1016/j.neuron.2016.05.021. - DOI - PMC - PubMed
    1. Wang L, Xie C, Greggio E, Parisiadou L, Shim H, Sun L, et al. The chaperone activity of heat shock protein 90 is critical for maintaining the stability of leucine-rich repeat kinase 2. J Neurosci. 2008;28(13):3384–3391. doi: 10.1523/JNEUROSCI.0185-08.2008. - DOI - PMC - PubMed
    1. Tremblay P, Meiner Z, Galou M, Heinrich C, Petromilli C, Lisse T, et al. Doxycycline control of prion protein transgene expression modulates prion disease in mice. Proc Natl Acad Sci U S A. 1998;95(21):12580–12585. doi: 10.1073/pnas.95.21.12580. - DOI - PMC - PubMed
    1. Gamache J, Benzow K, Forster C, Kemper L, Hlynialuk C, Furrow E, et al. Factors other than hTau overexpression that contribute to tauopathy-like phenotype in rTg4510 mice. Nat Commun. 2019;10(1):2479. doi: 10.1038/s41467-019-10428-1. - DOI - PMC - PubMed