

COUP-TFII regulates early bipotential gonad signaling and commitment to ovarian progenitors
- PMID: 38178246
- PMCID: PMC10768475
- DOI: 10.1186/s13578-023-01182-5
COUP-TFII regulates early bipotential gonad signaling and commitment to ovarian progenitors
Abstract
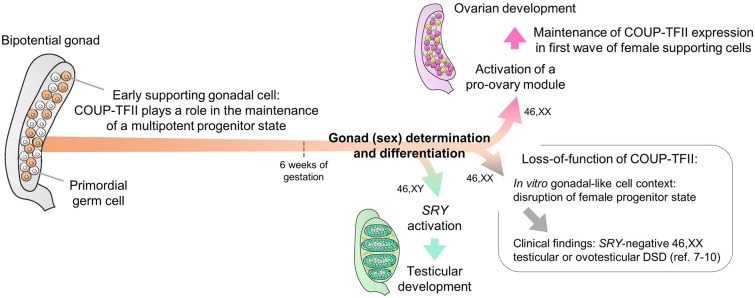
Background: The absence of expression of the Y-chromosome linked testis-determining gene SRY in early supporting gonadal cells (ESGC) leads bipotential gonads into ovarian development. However, genetic variants in NR2F2, encoding three isoforms of the transcription factor COUP-TFII, represent a novel cause of SRY-negative 46,XX testicular/ovotesticular differences of sex development (T/OT-DSD). Thus, we hypothesized that COUP-TFII is part of the ovarian developmental network. COUP-TFII is known to be expressed in interstitial/mesenchymal cells giving rise to steroidogenic cells in fetal gonads, however its expression and function in ESGCs have yet to be explored.
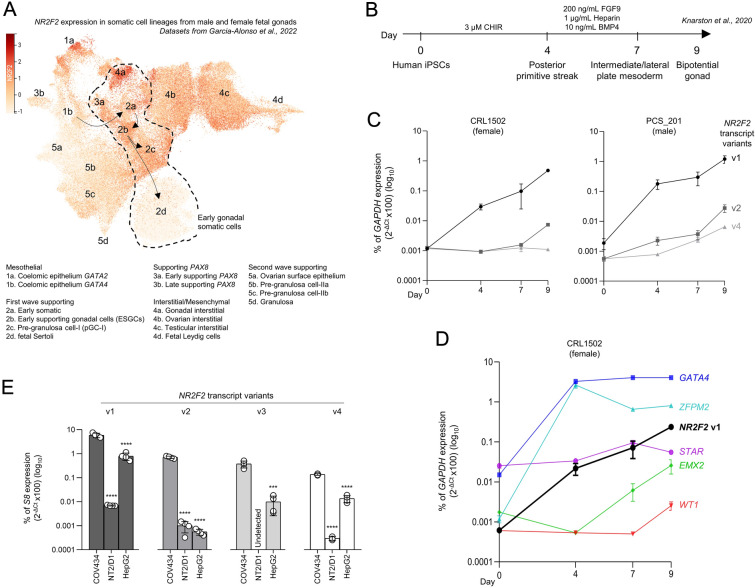
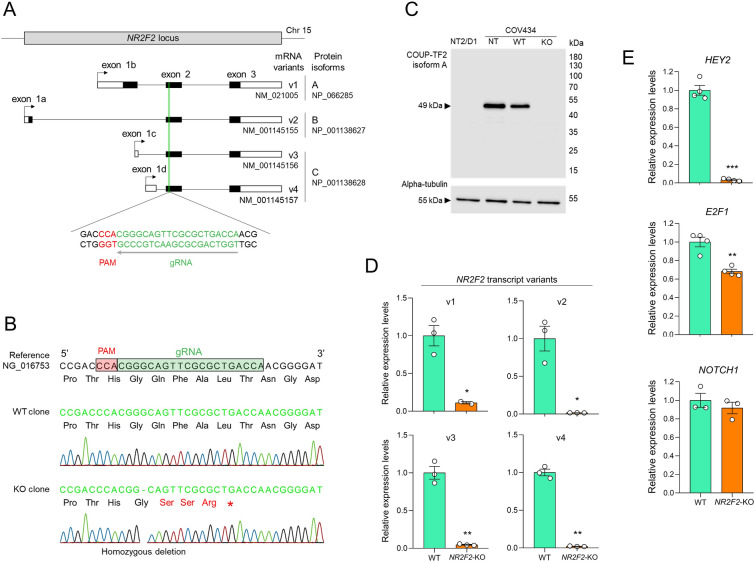
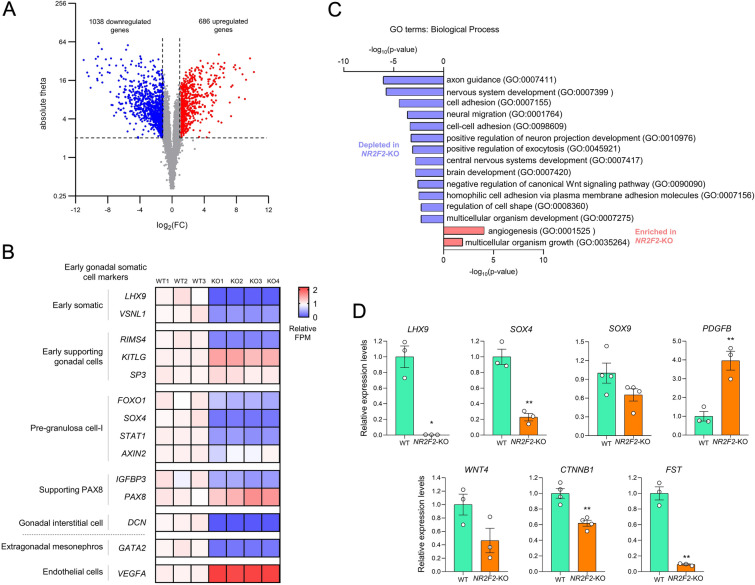
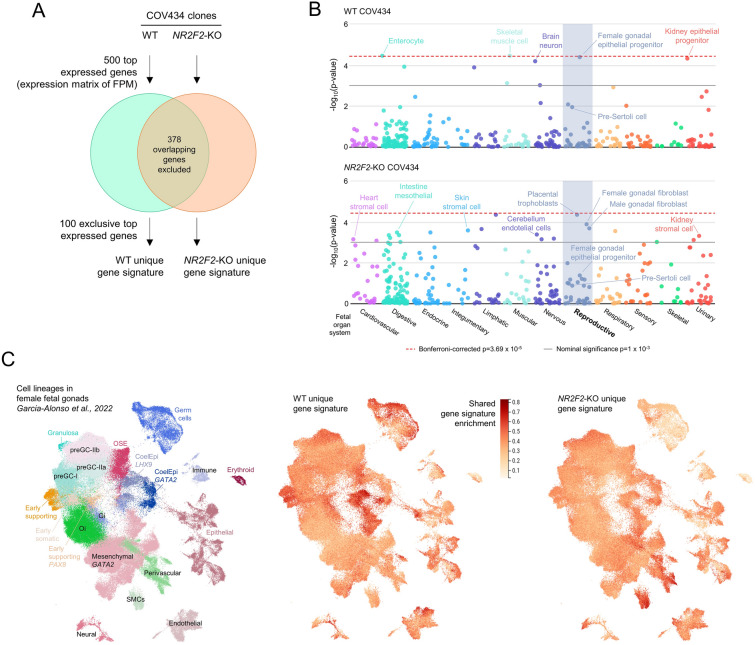
Results: By differentiating induced pluripotent stem cells into bipotential gonad-like cells in vitro and by analyzing single cell RNA-sequencing datasets of human fetal gonads, we identified that NR2F2 expression is highly upregulated during bipotential gonad development along with markers of bipotential state. NR2F2 expression was detected in early cell populations that precede the steroidogenic cell emergence and that retain a multipotent state in the undifferentiated gonad. The ESGCs differentiating into fetal Sertoli cells lost NR2F2 expression, whereas pre-granulosa cells remained NR2F2-positive. When examining the NR2F2 transcript variants individually, we demonstrated that the canonical isoform A, disrupted by frameshift variants previously reported in 46,XX T/OT-DSD patients, is nearly 1000-fold more highly expressed than other isoforms in bipotential gonad-like cells. To investigate the genetic network under COUP-TFII regulation in human gonadal cell context, we generated a NR2F2 knockout (KO) in the human granulosa-like cell line COV434 and studied NR2F2-KO COV434 cell transcriptome. NR2F2 ablation downregulated markers of ESGC and pre-granulosa cells. NR2F2-KO COV434 cells lost the enrichment for female-supporting gonadal progenitor and acquired gene signatures more similar to gonadal interstitial cells.
Conclusions: Our findings suggest that COUP-TFII has a role in maintaining a multipotent state necessary for commitment to the ovarian development. We propose that COUP-TFII regulates cell fate during gonad development and impairment of its function may disrupt the transcriptional plasticity of ESGCs. During early gonad development, disruption of ESGC plasticity may drive them into commitment to the testicular pathway, as observed in 46,XX OT-DSD patients with NR2F2 haploinsufficiency.
Keywords: 46,XX DSD; Bipotential gonad; COUP-TFII; Sex development; Supporting gonadal cells.
© 2023. The Author(s).
Conflict of interest statement
The authors declare that they have no competing interests.
Figures
Similar articles
-
Evidence for NR2F2/COUP-TFII involvement in human testis development.Sci Rep. 2024 Aug 1;14(1):17869. doi: 10.1038/s41598-024-68860-3. Sci Rep. 2024. PMID: 39090159 Free PMC article.
-
Loss of Function of the Nuclear Receptor NR2F2, Encoding COUP-TF2, Causes Testis Development and Cardiac Defects in 46,XX Children.Am J Hum Genet. 2018 Mar 1;102(3):487-493. doi: 10.1016/j.ajhg.2018.01.021. Epub 2018 Feb 22. Am J Hum Genet. 2018. PMID: 29478779 Free PMC article.
-
The Natural History of a Man With Ovotesticular 46,XX DSD Caused by a Novel 3-Mb 15q26.2 Deletion Containing NR2F2 Gene.J Endocr Soc. 2019 Aug 28;3(11):2107-2113. doi: 10.1210/js.2019-00241. eCollection 2019 Nov 1. J Endocr Soc. 2019. PMID: 31687637 Free PMC article.
-
Characterizing the bipotential mammalian gonad.Curr Top Dev Biol. 2019;134:167-194. doi: 10.1016/bs.ctdb.2019.01.002. Epub 2019 Jan 30. Curr Top Dev Biol. 2019. PMID: 30999975 Review.
-
The Chromatin State during Gonadal Sex Determination.Sex Dev. 2021;15(5-6):308-316. doi: 10.1159/000520007. Epub 2021 Nov 9. Sex Dev. 2021. PMID: 34753132 Free PMC article. Review.
Cited by
-
Repression of oxidative phosphorylation by NR2F2, MTERF3 and GDF15 in human skin under high-glucose stress.Redox Biol. 2025 May;82:103613. doi: 10.1016/j.redox.2025.103613. Epub 2025 Mar 27. Redox Biol. 2025. PMID: 40174478 Free PMC article.
-
Comparative Analysis of the Progesterone Receptor Interactome in the Human Ovarian Granulosa Cell Line KGN and Other Female Reproductive Cells.Proteomics. 2025 May 13;25(13):e202400374. doi: 10.1002/pmic.202400374. Online ahead of print. Proteomics. 2025. PMID: 40357704 Free PMC article.
-
Testicular differentiation in 46,XX DSD: an overview of genetic causes.Front Endocrinol (Lausanne). 2024 Apr 24;15:1385901. doi: 10.3389/fendo.2024.1385901. eCollection 2024. Front Endocrinol (Lausanne). 2024. PMID: 38721146 Free PMC article. Review.
References
Grants and funding
LinkOut - more resources
Full Text Sources
Research Materials
