. 2024 Jan 4;16(1):4.
doi: 10.1186/s13073-023-01276-2.

Using multi-scale genomics to associate poorly annotated genes with rare diseases

Affiliations

Using multi-scale genomics to associate poorly annotated genes with rare diseases

Christina Canavati et al. Genome Med. .

Abstract

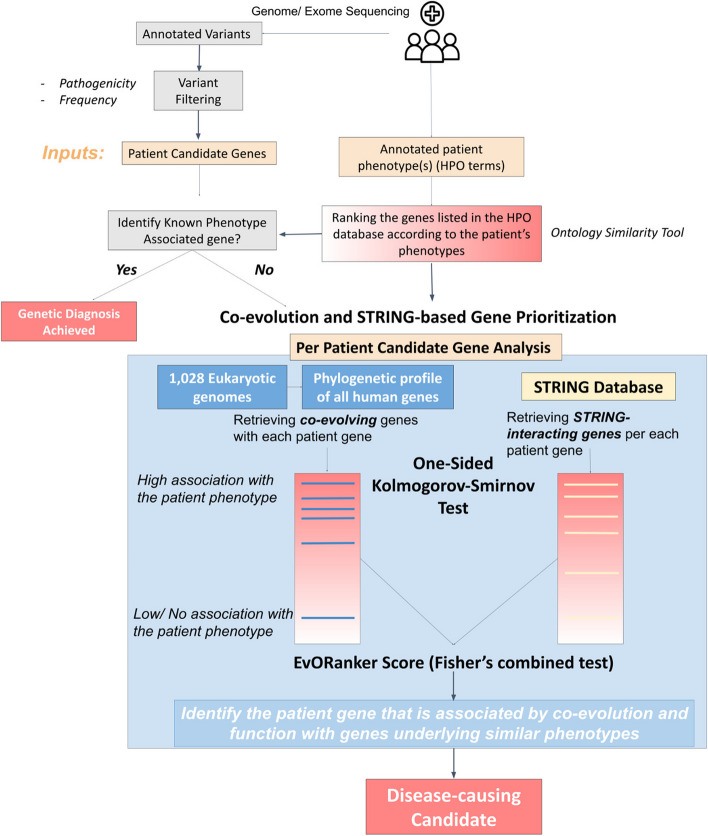
Background: Next-generation sequencing (NGS) has significantly transformed the landscape of identifying disease-causing genes associated with genetic disorders. However, a substantial portion of sequenced patients remains undiagnosed. This may be attributed not only to the challenges posed by harder-to-detect variants, such as non-coding and structural variations but also to the existence of variants in genes not previously associated with the patient's clinical phenotype. This study introduces EvORanker, an algorithm that integrates unbiased data from 1,028 eukaryotic genomes to link mutated genes to clinical phenotypes.

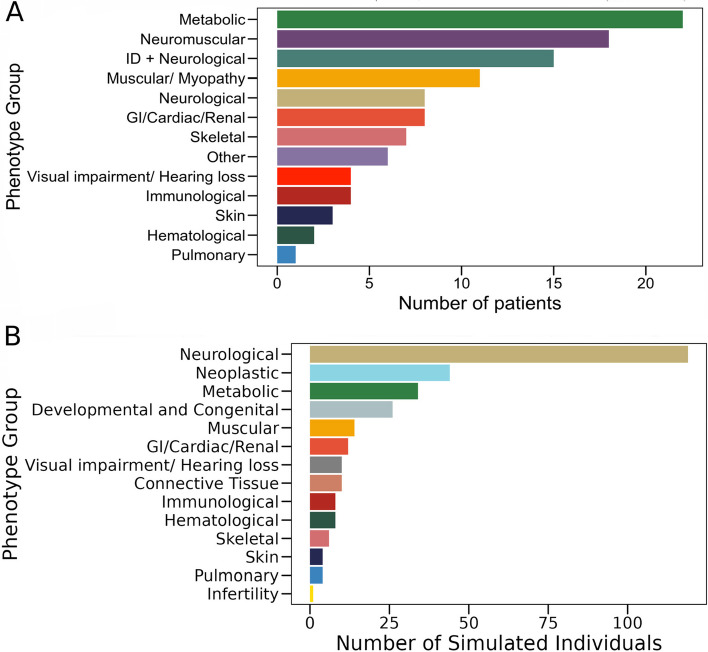
Methods: EvORanker utilizes clinical data, multi-scale phylogenetic profiling, and other omics data to prioritize disease-associated genes. It was evaluated on solved exomes and simulated genomes, compared with existing methods, and applied to 6260 knockout genes with mouse phenotypes lacking human associations. Additionally, EvORanker was made accessible as a user-friendly web tool.

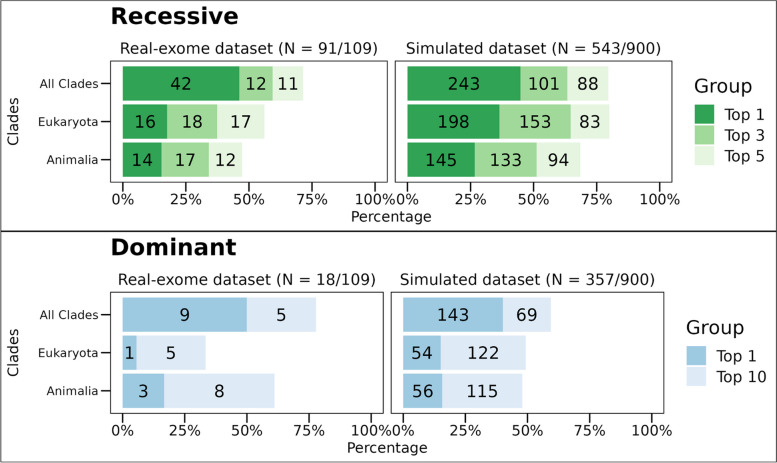
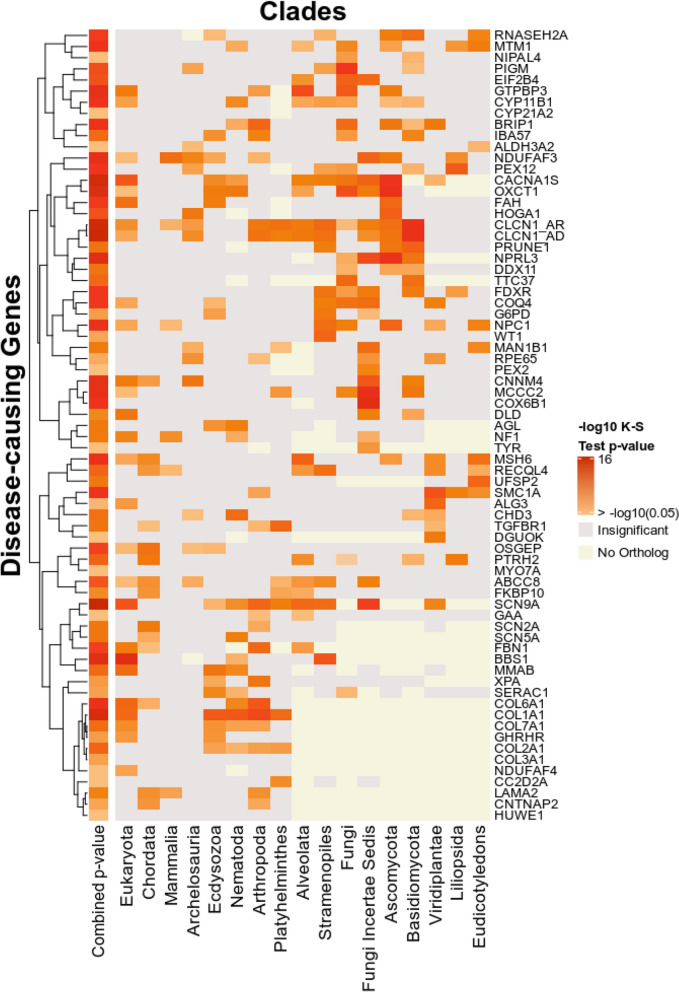
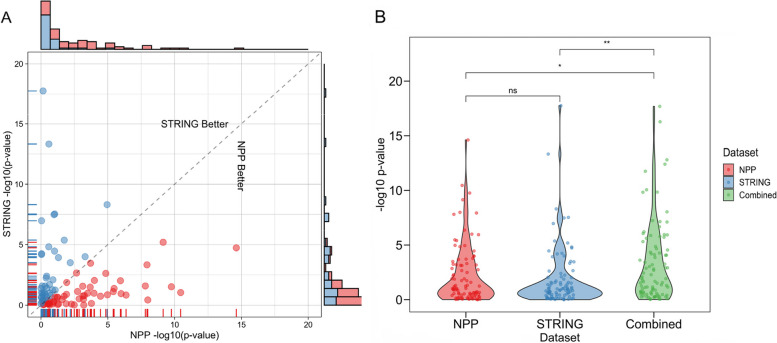
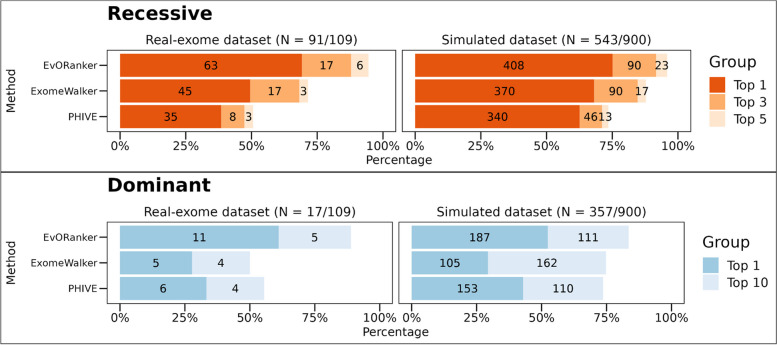
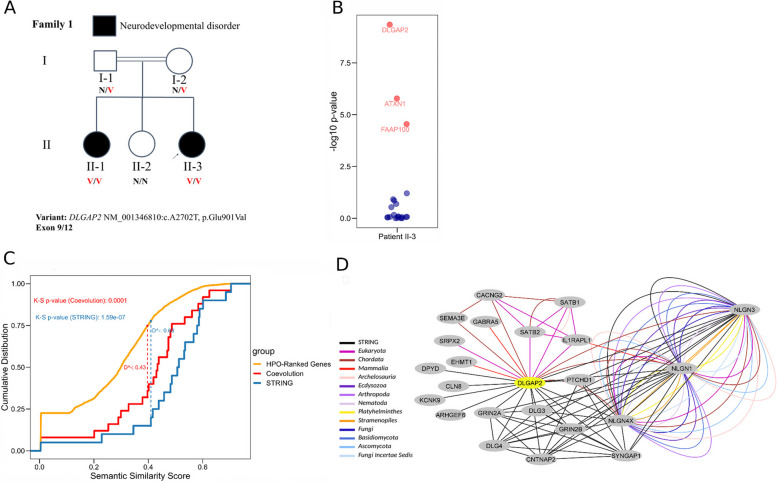
Results: In the analyzed exomic cohort, EvORanker accurately identified the "true" disease gene as the top candidate in 69% of cases and within the top 5 candidates in 95% of cases, consistent with results from the simulated dataset. Notably, EvORanker outperformed existing methods, particularly for poorly annotated genes. In the case of the 6260 knockout genes with mouse phenotypes, EvORanker linked 41% of these genes to observed human disease phenotypes. Furthermore, in two unsolved cases, EvORanker successfully identified DLGAP2 and LPCAT3 as disease candidates for previously uncharacterized genetic syndromes.

Conclusions: We highlight clade-based phylogenetic profiling as a powerful systematic approach for prioritizing potential disease genes. Our study showcases the efficacy of EvORanker in associating poorly annotated genes to disease phenotypes observed in patients. The EvORanker server is freely available at https://ccanavati.shinyapps.io/EvORanker/ .

Keywords: DLGAP2; EvORanker; Gene-based prioritization; LPCAT3.


Conflict of interest statement

The authors declare that they have no competing interests.

Figures

Fig. 1
Fig. 1
Graphical abstract of the EvORanker pipeline. Starting from a list of annotated variants obtained from a patient’s exome/genome sequencing data and following variant filtering, a list of predicted patient candidate genes harboring putatively pathogenic variants are input to EvORanker. The second input is the HPO terms corresponding to the patient’s phenotypes. The first step of the pipeline is to rank the genes listed in the HPO database according to the input HPO terms using the OntologySimilarity tool. If any of the patient candidate genes is a known disease-causing gene or ranked high using OntologySimilarity, then a genetic diagnosis is achieved. If not, then each patient candidate gene in addition to the ranked HPO gene list is input into a co-evolution and STRING-based algorithm. The algorithm analyzes two lists of genes, the co-evolving and STRING-interacting genes with each patient candidate gene. A one-sided Kolmogorov-Smirnov (K-S) test is then used to test if the co-evolving and interacting genes rank significantly high within the patient’s phenotype-related genes. The p-values obtained from running the K-S test using each dataset are combined using Fisher’s combined test. The output is a list of patient candidate genes ranked based on Fisher’s combined test p-values (from more significant to less significant). A disease-causing candidate is identified among the patient genes where a significant number of co-evolving and/or interacting genes are enriched towards the genes highly related to the patient’s input phenotypes relative to the genes that are unrelated
Fig. 2
Fig. 2
Phenotypic diversity in A a cohort of 109 patients from the exome database and B a simulated dataset of 300 individuals with 300 pathogenic variants from ClinVar inserted into their genomes. The patients exhibit a wide range of phenotypes. Notably, various shared phenotypes, especially related to metabolic and neurological diseases, are observed among the patients. Key: ID, intellectual disability; GI, gastrointestinal disorders
Fig. 3
Fig. 3
Using clades improves the performance of EvORanker phylogenetic profiling-based analysis. For each patient candidate gene list in the 109-patient exome and the 900-simulated genomes datasets (300 unique genetic disorders), we compared the accuracy of the phylogenetic profiling-based algorithm by retrieving the top 50 coevolved genes with each patient candidate gene across all Eukaryotes versus: (1) using all 16 clades where the query gene has an ortholog in addition to Eukaryotes. (2) Across only Animalia clades (Chordata, Mammalia, Archelosauria, Ecdysozoa, Nematoda, Arthropoda, and Platyhelminthes). Performance was measured by examining the ranking of the “true” disease-causing gene relative to the other patient candidate genes. The upper bar plot shows results for the autosomal and X-linked recessive cases for the real-exome dataset (left) and the simulated dataset (right). The simulated dataset contains 181 unique recessive cases and 119 unique dominant cases. The results present a compilation of three separate independent shuffles totaling 900 simulations. The lower bar plot shows results for the autosomal and X-linked dominant cases. The y-axis indicates the tested clades, and the x-axis indicates the percentage of cases where the “true” disease gene was ranked at the top or within the top 3 or top 5 genes relative to the other candidate genes in recessive cases. In dominant cases, the percentage is for the “true” gene being ranked at the top or within the top 10 genes. Overall, the best performance of ranking the “true” causative gene was achieved by merging together the co-evolving genes within all clades (the 16 clades in addition to all Eukaryota) in both datasets
Fig. 4
Fig. 4
Each of the 16 clades in addition to Eukaryota contributes to the correct identification of the disease-causing gene. Each column in the heatmap represents a clade while each row represents the “true” disease-causing gene in a patient exome from the 109-exome patient dataset. Only the genes that achieved an overall significant K-S test p-value (< 0.05) using the co-evolution analysis are displayed (71 cases). Each entry in the heatmap is colored by the -log 10 of the K-S test p-value that was run on each clade separately. The entries colored in red represent the significant p-values (> -log10(0.05)). Light grey entries indicate non-significant p-values. Entries, where the gene is not found to have an ortholog in a certain clade, are colored off-white. The rows are clustered according to the p-values. The column on the left indicates the combined -log10 of the p-value obtained by running the K-S test after merging together the coevolving genes across the clades. In four cases (HUWE1, COL3A1, MYO7A, and CYP21A2), a significant p-value was obtained by none of the clades, but a significant combined p-value was still achieved by merging the co-evolving genes from all the clades
Fig. 5
Fig. 5
Comparative performance of NPP, STRING, and EvORanker using the 109-patient exome and the simulated datasets. The performance of each dataset was measured by examining the ranking of the “true” disease-causing gene relative to the other genes in each exome/genome in both datasets. The upper bar plot shows results for the autosomal and X-linked recessive cases for the real-exome dataset (left) and the simulated dataset (right), The simulated dataset contains 181 unique recessive cases and 119 unique dominant cases. The results present a compilation of three separate independent shuffles totaling 900 simulations. The lower bar plot shows results for the autosomal and X-linked dominant cases. The y-axis indicates the tested datasets: NPP (using the top 50 coevolved genes), STRING versions 9.1, 11.5, and EvORanker (combining NPP and the newer version of STRING). The x-axis indicates the percentage of cases where the “true” disease gene was ranked at the top, or within the top 3 or top 5 genes relative to the other candidate genes in recessive cases. In dominant cases, the percentage is for the “true” gene being ranked at the top or within the top 10 genes. Overall, the best performance was achieved using the combined approach (EvORanker) in both datasets
Fig. 6
Fig. 6
The effect of years elapsed on the performance of NPP versus STRING, using the 109-patient exome dataset. The x-axis indicates the calendar years (divided into 5-year windows) in which a gene was described to be associated with a disease phenotype. The y-axis indicates the percentage of “true” disease genes that ranked at the top (top 1) relative to the other patient candidate using NPP (red bars) or STRING (blue bars)
Fig. 7
Fig. 7
Comparison of NPP versus STRING for genes with recent (2020–2022) annotation. A The x-axis indicates -log(10) p-values obtained from running the K-S test using NPP. The y-axis indicates -log(10) p-values obtained from running the K-S test using the STRING dataset. The red dots represent the genes where NPP performed better than STRING, while the blue dots indicate the opposite. The marginal histogram indicates the distribution of the -log(10) p-values of both datasets. The correlation score between the two datasets is 0.046, suggesting that the two datasets exhibit a complex relationship, where a subset of the data displays complementarity, while another subset shows correlation. B Density distribution of the -log(10) p-values obtained from the K-S test using the NPP, STRING, and both (combined). Significance was calculated using the Wilcoxon test (*p-value < 0.05, **p-value < 0.01; ns, nonsignificant). Combining NPP and STRING achieved significantly more significant results that either approach alone
Fig. 8
Fig. 8
EvORanker’s performance in identifying candidate disease genes using mouse knockout genes without corresponding human annotation. A The graph shows the percentage of genes with mouse knockout phenotypes that were tested for significant p-values using EvORanker. Out of 6260 genes, 41% showed significant p-values. B Comparison of EvORanker and Phenolyzer [49] in identifying true disease gene candidates. The graph shows the count of genes with mouse knockout phenotypes and their respective ranking, each in comparison to 100 randomly sampled genes by EvORanker and Phenolyzer. Among the tested genes, 16% were ranked in the top 10 by both tools
Fig. 9
Fig. 9
EvORanker outperforms two other algorithms (ExomeWalker and PHIVE). The performance of each algorithm in the 108-exome dataset and the simulated dataset (shuffled three times) was measured by examining the ranking of the “true” disease-causing gene relative to the other patient genes. The upper bar plot shows results for the autosomal and X-linked recessive cases for the real-exome dataset (left) and the simulated dataset (right). The simulated dataset contains 181 unique recessive cases and 119 unique dominant cases. The results present a compilation of three separate independent shuffles totaling 900 simulations. The lower bar plot shows results for the autosomal and X-linked dominant cases. The y-axis indicates the tested algorithms, and the x-axis indicates the percentage of cases where the “true” disease gene was ranked at the top or within the top 5 genes relative to the other candidate genes in recessive cases. In dominant cases, the percentage indicates whether the “true” gene was ranked at the top or within the top 10 genes. EvORanker outperformed ExomeWalker and PHIVE in both recessive and dominant diseases in both datasets
Fig. 10
Fig. 10
EvORanker identifies DLGAP2 as a novel gene underlying a neurodevelopmental phenotype. A Pedigree: In a consanguineous family affected children have psychomotor delay and dysphasia, hyperactivity, and poor attention span. Shown is the segregation of the DLGAP2 NM_001346810:c.A2702T, p.Glu901Val variant. N, normal allele; V, variant allele. B EvORanker results: DLGAP2 is ranked as the top candidate relative to the other patient candidates. The x-axis indicates the proband (patient II-3), and the y-axis indicates the EvORanker -log(10) p-value obtained from running the K-S test using the co-evolved and STRING-interacting genes with each patient gene. Red dots indicate significant p-values, and dark blue dots indicate non-significant p-values. DLGAP2 was the only gene that co-segregated with the phenotype in family 1. C One-sided, two-sample Kolmogorov–Smirnov model. The x-axis indicates the semantic similarity score obtained by the OntologySimilarity tool in relation to the patient’s (II-3, family 1) phenotypes (HP:0001263, HP:0002357, HP:0000752, HP:0000736). The y-axis indicates the cumulative distribution. The orange line corresponds to the empirical distribution of all genes listed in the HPO database, ranked according to semantic similarity. The red line represents the empirical distribution of the genes coevolved with DLGAP2, and the blue line represents the empirical distribution of the genes interacting with DLGAP2 based on STRING. The red dashed line indicates the D statistic representing the maximum vertical distance between the empirical cumulative distribution functions of the HPO-ranked genes and the genes coevolved with DLGAP2. The blue dashed line indicates the D statistic measured by the distance between the empirical cumulative distribution functions of the HPO-ranked genes and the genes interacting with DLGAP2 based on STRING. Both coevolution and STRING-based analysis yielded significant p-values corresponding to the D statistic. D Coevolution and STRING-based subnetwork showing the patient’s phenotype-related genes coevolving with the DLGAP2 gene. The dark grey node in the network indicates DLGAP2 and the light grey nodes represent the phenotype-related genes. The black edges represent STRING interactions, and the colored edges represent the clade where two genes co-evolve. The network exhibits a group of phenotype-related correlated genes that have not been identified by the STRING database (EHMT1, IL1RAPL1, SATB2, GABRA5, SRPX2, SEMA3E, CACNG2)
Fig. 11
Fig. 11
EvORanker identifies LPCAT3 as a novel gene underlying a multisystem disorder. A Pedigree of a consanguineous family. The affected son has failure to thrive, chronic diarrhea with recurrent abdominal pain, muscle atrophy, elevated liver enzymes, and high creatine kinase levels. Shown is the segregation of the LPCAT3 NM_005768:c.G939A, p.Trp313Ter variant. N, normal allele; V, variant allele. B EvORanker results: LPCAT3 is ranked as the top candidate relative to other candidate genes. The x-axis indicates the proband (patient II-4), and the y-axis indicates the combined -log10 p-value obtained from running the K-S test using the co-evolved and STRING-interacting genes with each patient gene. Red dots indicate significant p-values, and dark blue dots indicate non-significant p-values. LPCAT3 was the only gene that co-segregated with the phenotype in family 2. C One-sided, two-sample Kolmogorov–Smirnov model. The x-axis indicates the semantic similarity score obtained by the OntologySimilarity tool in relation to the patient’s (II-4, family 2) phenotypes (HP:0001508, HP:0002910, HP:0002574, HP:0002028, HP:0003236, HP:0003202). The y-axis indicates the cumulative distribution. The orange line corresponds to the empirical distribution of all genes listed in the HPO database, ranked according to semantic similarity. The red line indicates the empirical distribution of the genes coevolved with LPCAT3, and the blue line indicates the empirical distribution of the genes interacting with LPCAT3 based on STRING. The red dashed line indicates the D statistic representing the maximum vertical distance between the empirical cumulative distribution functions of the HPO-ranked genes and the genes coevolved with LPCAT3. The blue dashed line indicates the D statistic measured by the distance between the empirical cumulative distribution functions of the HPO-ranked genes and the genes interacting with LPCAT3 based on STRING. Only coevolution-based analysis yielded significant p-values corresponding to the D statistic. D Coevolution and STRING-based subnetwork showing the patient’s phenotype-related genes coevolving with the LPCAT3 gene. The yellow node in the network indicates LPCAT3 and the light grey nodes represent the phenotype-related genes. The black edges represent STRING interactions, and the colored edges represent the clade where two genes co-evolve. We demonstrate that our clade-wise NPP approach uncovered correlations between LPCAT3 and phenotype-related genes that were not captured by STRING

References

    1. Bamshad MJ, Nickerson DA, Chong JX. Mendelian gene discovery: fast and furious with no end in sight. Am J Hum Genet. 2019;105:448–455. doi: 10.1016/j.ajhg.2019.07.011. - DOI - PMC - PubMed
    1. Online Mendelian Inheritance in Man, OMIM®. McKusick-Nathans Institute of Genetic Medicine, Johns Hopkins University (Baltimore, MD). 2023. https://omim.org/. Accessed 18 Sept 2023.
    1. Robinson PN, Köhler S, Oellrich A, Project SMG. Wang K, Mungall CJ, et al. Improved exome prioritization of disease genes through cross-species phenotype comparison. Genome Res. 2014;24:340–8. doi: 10.1101/gr.160325.113. - DOI - PMC - PubMed
    1. Davydov EV, Goode DL, Sirota M, Cooper GM, Sidow A, Batzoglou S. Identifying a high fraction of the human genome to be under selective constraint using GERP++ PLoS Comput Biol. 2010;6:e1001025. doi: 10.1371/journal.pcbi.1001025. - DOI - PMC - PubMed
    1. Adzhubei I, Jordan DM, Sunyaev SR. Predicting functional effect of human missense mutations using PolyPhen-2. Curr Protoc Hum Genet. 2013;Chapter 7:Unit7.20. - PMC - PubMed

Publication types

Substances