. 2024 Mar;11(11):e2304263.
doi: 10.1002/advs.202304263. Epub 2024 Jan 4.

BRCC36 Deubiquitinates HMGCR to Regulate the Interplay Between Ferroptosis and Pyroptosis

Affiliations

BRCC36 Deubiquitinates HMGCR to Regulate the Interplay Between Ferroptosis and Pyroptosis

Haiyan Wang et al. Adv Sci (Weinh). 2024 Mar.

Abstract

Various forms of programmed cell death (PCD) exhibit distinct characteristics depending on their specific molecular mechanisms, and there are interactions among these different forms. Ferroptosis, which is related to autophagy and apoptosis, has an unknown potential interaction with pyroptosis. This study revealed a mutually antagonistic relationship between ferroptosis and pyroptosis, with 3-hydroxy-3-methylglutaryl-coenzyme A reductase (HMGCR) playing a key role in their interaction. It is found that HMGCR predominantly localized to mitochondria during ferroptosis but shifted to the endoplasmic reticulum following treatment with a pyroptosis inducer. Furthermore, this study demonstrated that BRCC36 (BRCA1/BRCA2-containing complex subunit 36) deubiquitinated HMGCR in a manner dependent on deubiquitinating enzyme (DUB) activity, and inhibited ferroptosis and promoted pyroptosis. Moreover, as an oncogene in hepatocellular carcinoma (HCC), BRCC36 promoted cancer cell proliferation, migration, invasion, and tumor growth. Thiolutin, an inhibitor of BRCC36, effectively suppressed the interaction between BRCC36 and HMGCR, leading to the inhibition of HCC growth. Therefore, targeting BRCC36 can offer a novel and promising therapeutic strategy for HCC treatment. In conclusion, these findings provide new theoretical evidence for further characterizing tumor heterogeneity and offer new molecular targets for the diagnosis and treatment of HCC.

Keywords: BRCC36; HMGCR; endoplasmic reticulum; ferroptosis; mitochondria; pyroptosis.


Conflict of interest statement

The authors declare no conflict of interest.

Figures
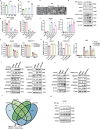
Figure 1
Figure 1
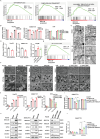
HMGCR is a key regulator of the correlation between ferroptosis and pyroptosis. The relative level of lipid ROS was measured by Flow cytometry A), and the release of LDH was measured by using LDH kits B), and the pyroptotic morphology was observed C) in L02 cells treated with the various concentrations of MPs. Black arrows represent pyroptotic cells. D) The expression levels of proteins associated with ferroptosis and pyroptosis in L‐02 cells treated with different concentrations of MPs. Analysis of cell viability E) and the LDH release F) in HepG2 and SMMC7721 cells treated with pyroptosis inducers, including LPS and Nig, CHX and TNFα, and ferrostatin‐1. Analysis of cell viability G) and relative lipid ROS levels H) in HepG2 and SMMC7721 cells with knockdown of GSDMD/GSDME and RSL3 treatment. I) The release of LDH was measured by using LDH kits in LM3 cells with GPX4 knockdown treated with pyroptosis inducers, including LPS and Nig, CHX and TNFα. J) The expression levels of proteins associated with ferroptosis and pyroptosis by using western blot assay in HepG2 and SMMC7721 cells treated with pyroptosis inducers LPS and Nig, CHX and TNFα. K) The expression levels of proteins associated with ferroptosis and pyroptosis in HepG2 and SMMC7721 cells treated with RSL3 and Fer‐1. L) Venn diagram showed the overlapping number of genes that are simultaneously correlated with both ferroptosis and pyroptosis scores, as determined by the ssGSEA algorithm, in the GSE98617, GSE62743, GSE57727, and GSE78737 datasets. M) The expression levels of proteins associated with ferroptosis and pyroptosis in HepG2 cells treated with the pyroptosis inducer LPS and Nig and ferroptosis inhibitor Fer‐1. Data are presented as mean ± S.D (n = 3), and the P value was calculated using two‐sided unpaired Student's t‐tests (A, B, E, to I). *P < 0.05, **P < 0.01, ***P < 0.001.
Figure 2
Figure 2
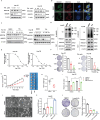
HMGCR promotes pyroptosis in the endoplasmic reticulum and inhibits ferroptosis in the mitochondria. The overexpression or knockdown of liver cancer cells was treated with pyroptosis inducers LPS and Nig, CHX and TNFα. The pyroptotic morphology was observed A). Black arrows represent pyroptotic cells. The release of LDH was measured by using LDH detection kits B). C,D) Western blot assay was performed to detect the expression levels of proteins associated with ferroptosis and pyroptosis in liver cancer cells with HMGCR overexpression or knockdown. E) Cell viability was measured by using the CCK8 reagent in liver cancer cells overexpressed or knockdown HMGCR treated with RSL3, Fer‐1, RSL3, and Fer‐1. F) IF assay was performed to detect the location of HMGCR in HepG2 cells treated with RSL3, LPS and Nig, CHX and TNFα. Scale bar: 10 µm. G) Western blot assay was used to detect the location of HMGCR in HepG2 cells treated with RSL3, LPS, and Nig. Data are presented as mean ± S.D (n = 3), and the P value was calculated using two‐sided unpaired Student's t‐tests (B, E). **P < 0.01.
Figure 3
Figure 3
BRCC36 interacts with HMGCR. A) The expression of HMGCR mRNA was detected by using the qPCR assay in HepG2 cells treated with pyroptosis inducers LPS and Nig, CHX and TNFα. Liver cancer cells were treated with MG132 B) or CHX C) for the indicated time, and a western blot assay was performed to detect the expression levels of BRCC36 and HMGCR. D) HepG2 cells were transfected with USP10, USP8, BRCC36, and JOSD1 plasmids, and the expression levels of Flag and HMGCR was detected by using western blot assay. E) HepG2 cells were transfected with the BRCC36 plasmid in a dose‐dependent manner, and the expression levels of Flag and HMGCR was detected by using western blot assay. F) Western blot assay was performed to detect the expression levels of BRCC36 and HMGCR in normal cells and cancer cells. G) The expression levels of BRCC36 and HMGCR in liver cancer cells with BRCC36 overexpressed or depleted by using western blot assay. H) 293T cells were transfected with the BRCC36 plasmid for 48 h, and co‐IP assays were performed to detect the interaction of BRCC36 and HMGCR. I) Co‐IP assays was performed to detect the interaction of BRCC36 and HMGCR in Hep3B cells. J) IF assay was performed to detect the location of BRCC36 and HMGCR in Hep3B cells. Scale bar: 20 µm. Data are presented as mean ± S.D (n = 3), and the P value was calculated using two‐sided unpaired Student's t‐tests (A). n.s., not significant.
Figure 4
Figure 4
BRCC36 stabilizes the HMGCR protein through deubiquitination. The overexpression or depletion of BRCC36 cells was treated with MG132 A) or CHX B). The expression levels of BRCC36 and HMGCR was detected by using western blot assay. C) Liver cancer cells overexpressing or depleting BRCC36 were treated with MG132 for 12 h, and the ubiquitinated HMGCR was detected by using co‐IP assay. 293T cells were transfected with plasmids containing various polyubiquitin chains D), and transfected with BRCC36 wildtype or mutant plasmids E) for 48 h, and the ubiquitinated HMGCR was detected using co‐IP assay.
Figure 5
Figure 5
BRCC36 inhibits ferroptosis and promotes pyroptosis. A) The relationship between BRCC36 and the ferroptosis pathway was predicted by using GSEA in HCC. B) The liver cancer cells with BRCC36 overexpression or depletion were treated with RSL3, Fer‐1, RSL3 for 48 h, and the cell viability was measured by CCK8 reagent. C) Electron microscopy images of mitochondria in HepG2 cells treated with DMSO or RSL3. Scale bars,1 µm or 500 nm. D) The liver cancer cells overexpressing or depleting BRCC36 were treated with RSL3 for 24 h, and flow cytometry was performed to measure the level of lipid ROS. E) The relationship between BRCC36 and the pyroptosis pathway was predicted by using GSEA in HCC. Liver cancer cells overexpressed or depleted BRCC36 were treated with pyroptosis inducers LPS and Nig, CHX and TNFα. The pyroptotic morphology was observed F), black arrows represent pyroptotic cells, and LDH release by using LDH kit G). H) Western blot assay was performed to detect the expression levels of proteins associated with ferroptosis and pyroptosis in liver cancer cells with BRCC36 overexpression or depletion. I) The BRCC36‐depleted SMMC7721 cells were transfected with the HMGCR plasmid and treated with RSL3 or Fer‐1 for 48 h, and the cell viability was detected by CCK8 assay. J) The BRCC36‐depleted SMMC7721 cells were transfected with the HMGCR plasmid and treated with LPS and Nig, and the LDH release was measured by using LDH kit. Data are presented as mean ± S.D (n = 3), and the P value was calculated using two‐sided unpaired Student's t‐tests (B, C, G, I, J). *P < 0.05, **P < 0.01, ***P < 0.001.
Figure 6
Figure 6
BRCC36 functions as an oncogene in hepatic carcinoma. A) The expression of BRCC36 in liver cancer tissues and paracancerous normal tissues by using IHC assay (magnification, ×100 scale bar = 200 µm; magnification, ×200 scale bar = 100 µm). B) The cell viability in HepG2, SMMC7721, and LM3 cells stably overexpressed or depleted of BRCC36. C) The colony formation ability in HepG2, SMMC7721, and LM3 cells stably overexpressed or depleted BRCC36. D) The cell migration ability in HepG2, SMMC7721 and LM3 cells overexpressed or depleted of BRCC36. E) The cell invasion ability in HepG2, SMMC7721 and LM3 cells with overexpressed or depleted of BRCC36. The xenograft model of tumor growth was established to evaluate the ability of SMMC7721 cells with stable BRCC36 overexpression. Dissected tumors F), tumor volume was monitored at the indicated times G), and weight H). I) The expression levels of BRCC36, HMGCR, GPX4, GSDMD, and NLRP3 in tumor samples. J) The expression levels of BRCC36, HMGCR, and 4‐HNE were detected by IHC assay in tumor samples. Scale bar, 100 µm. K) The xenograft model of tumor growth was established to evaluate the ability of BRCC36‐knockout cancer cells LM3 with re‐expressing wild‐type (WT) or mutant HMGCR (K248R). Dissected tumors (K), and weight L). Data are presented as mean ± S.D (n = 3), and the P value was calculated using two‐sided unpaired Student's t‐tests (B to E, H, L). Data are mean ± SEM (n = 6), and the P value was analyzed by one‐way ANOVA test followed by Turkey's multiple comparisons (F). *P < 0.05, **P < 0.01, ***P < 0.001.
Figure 7
Figure 7
Thiolutin weakens the interaction between BRCC36 and HMGCR and inhibits tumor growth in HCC. A) The expression levels of BRCC36 and HMGCR proteins was detected by a western blot assay in HepG2 and Hep3B cells treated with the indicated concentrations of THL for 24 h. B) Immunofluorescence of BRCC36 and HMGCR in HepG2 cells after THL treatment for 24 h. Scale bar, 5 µm. C) The expression levels of BRCC36 and HMGCR proteins in HepG2 and Hep3B cells treated with THL, DMSO, or CHX for the indicate time. D) HepG2 and Hep3B cells were pretreated with THL or DMSO for 24 h, and then incubated with MG132 for an additional 12 h. The ubiquitinated HMGCR was detected by IP assay. E) The cell viability was detected using the CCK8 reagent in HepG2 and Hep3B cells treated with the indicated concentrations of THL for 48 h. F) The colony formation ability in HepG2 and Hep3B cells treated with 0.25 or 0.5 µm THL. G) Tumor volume was measured every three days to determine the growth rate of THL‐treated xenografts. And the tumor weight was measured H). I) The cell viability in HepG2 cells treated with THL, RSL3, or Fer‐1 for 48 h. J) Representative phase‐contrast images of HepG2 cells treated with THL or RSL3 for 24 h. K) Flow cytometry was performed to measure the lipid ROS level in HepG2 cells treated with THL or RSL3 for 24 h. L) The clonogenic ability of HepG2 cells treated with THL (0.5 µm) and lovastatin (5 µm). Data are presented as mean ± S.D (n = 3), and the P value was analyzed by a two‐tailed unpaired Student's t‐test (F, H, I, K, L). Data are mean ± SEM (n = 6), and the P value was analyzed by one‐way ANOVA test followed by Turkey's multiple comparisons G). *P < 0.05, **P < 0.01, ***P < 0.001.
Figure 8
Figure 8
BRCC36 deubiquitinates HMGCR to regulate the interplay between ferroptosis and pyroptosis. BRCC36 stabilizes the HMGCR protein by eliminating the K63 polyubiquitin chain. HMGCR is primarily located in the mitochondria when cells are exposed to the ferroptosis inducer RSL3 or low concentration of MPs. It prevents the accumulation of lipid peroxides by modulating GPX4 activity, thereby preventing ferroptosis. When cells were exposed to LPS and Nig, or high concentrations of MPs, HMGCR was predominantly located in the endoplasmic reticulum. This localization had an impact on the assembly of GSDMD‐N protein on the membrane and subsequently led to pyroptosis.

References

    1. Koren E., Fuchs Y., Cancer Discovery 2021, 11, 245. - PubMed
    1. Jiang X., Stockwell B. R., Conrad M., Nat. Rev. Mol. Cell Biol. 2021, 22, 266. - PMC - PubMed
    1. Wang H., Cheng Y., Mao C., Liu S., Xiao D., Huang J., Tao Y., Mol. Ther. 2021, 29, 2185. - PMC - PubMed
    1. Chen X., Kang R., Kroemer G., Tang D., Nat. Rev. Clin. Oncol. 2021, 18, 280. - PubMed
    1. Yang W. S., Sriramaratnam R., Welsch M. E., Shimada K., Skouta R., Viswanathan V. S., Cheah J. H., Clemons P. A., Shamji A. F., Clish C. B., Brown L. M., Girotti A. W., Cornish V. W., Schreiber S. L., Stockwell B. R., Cell 2014, 156, 317. - PMC - PubMed

Substances