. 2024 Apr;36(14):e2312226.
doi: 10.1002/adma.202312226. Epub 2024 Jan 4.

Injectable MSC Spheroid and Microgel Granular Composites for Engineering Tissue

Affiliations

Injectable MSC Spheroid and Microgel Granular Composites for Engineering Tissue

Nikolas Di Caprio et al. Adv Mater. 2024 Apr.

Abstract

Many cell types require direct cell-cell interactions for differentiation and function; yet, this can be challenging to incorporate into 3-dimensional (3D) structures for the engineering of tissues. Here, a new approach is introduced that combines aggregates of cells (spheroids) with similarly-sized hydrogel particles (microgels) to form granular composites that are injectable, undergo interparticle crosslinking via light for initial stabilization, permit cell-cell contacts for cell signaling, and allow spheroid fusion and growth. One area where this is important is in cartilage tissue engineering, as cell-cell contacts are crucial to chondrogenesis and are missing in many tissue engineering approaches. To address this, granular composites are developed from adult porcine mesenchymal stromal cell (MSC) spheroids and hyaluronic acid microgels and simulations and experimental analyses are used to establish the importance of initial MSC spheroid to microgel volume ratios to balance mechanical support with tissue growth. Long-term chondrogenic cultures of granular composites produce engineered cartilage tissue with extensive matrix deposition and mechanical properties within the range of cartilage, as well as integration with native tissue. Altogether, a new strategy of injectable granular composites is developed that leverages the benefits of cell-cell interactions through spheroids with the mechanical stabilization afforded with engineered hydrogels.

Keywords: granular hydrogel; hyaluronic acid; microparticles; spheroids; tissue engineering.


Figures

Figure 1.
Figure 1.. Granular composite approach and component characterization.
a, Schematic overview of granular composite design, where MSC spheroids and NorHA microgels are mixed to enable (i) injectability for delivery to defects or molds, (ii) cell-cell contacts for enhanced chondrogenesis and spheroid fusion for tissue formation, and (iii) interparticle crosslinking via light to stabilize the composites. b, Schematic of granular composites over time, where spheroid fusion and growth result in cartilage tissue throughout the granular hydrogel. Schematics are not accurately scaled. c, Representative image of MSC spheroids (top) and quantification of MSC spheroid size distribution (bottom) 2 days after seeding 1000 cells/spheroid. n=50; scale bar: 200μm. d, Representative day 28 chondrogenic MSC spheroids stained for sGAGs (Alcian blue), chondroitin sulfate, and collagen II; scale bars: 200μm. e, Quantification of microgel size distribution (left) and representative image (right) of microgels fabricated via batch emulsion of NorHA (spun at 280 RPM). n=154; scale bar: 200μm.
Figure 2.
Figure 2.. Spheroids and microgels form granular composites and their ratio dictates connectivity.
a, Schematic workflow of dynamic rigid body simulation connectivity analysis through Cinema4D. Granular composite mixing (green: microgels; pink: spheroids) simulated via gravity and imported into FIJI to slice and voxelize 3D object distributions as binary Z-stacks. Binary Z-stacks analyzed for connectivity through 3D object counter function in FIJI. Connectivity is defined here as the number of particles within the largest cluster divided by the total number of particles within the component (spheroid or microgel total particle number). b, Representative images of granular composite simulations of varying volume ratios of spheroids to microgels. c, Quantified connectivity of monodisperse granular composites of varying spheroid to microgel ratios. n=5, mean ± s.d. Quantification of granular composite connectivity that incorporates microgel size distribution into the simulation of all volume ratios. n=5, mean ± s.d. Quantification of granular composite connectivity that incorporates spheroid aggregation into the simulation for 20:80, 35:65, and 50:50 volume ratios. n=5, mean ± s.d. ****P<0.0001, ***P<0.001, **P<0.01, ns=not significant.
Figure 3.
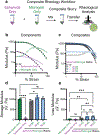
Figure 3.. Granular hydrogels are injectable with properties based on formulation.
a, Schematic of the composite rheology workflow. MSC spheroids and NorHA microgels are jammed independently, mixed into a composite slurry, and transferred onto a rheometer for analysis (note: all experiments performed without interparticle crosslinking). b, Representative strain sweeps (1 Hz) of spheroid only and microgel only granular components. c, Representative strain sweeps (1 Hz) of granular composites at varying volume ratios of spheroids to microgels. Filled objects: G’, Empty objects: G”. d, Quantification of average storage moduli of granular components or granular composites with varying volume ratios. n= 3, mean ± s.d. e, Quantification of average loss moduli of granular components or granular composites with varying volume ratios. n= 3, mean ± s.d. ****P<0.0001, ***P<0.001, **P<0.01, *P<0.05, ns=not significant.
Figure 4.
Figure 4.. In vitro granular composite fabrication and characterization.
a, Schematic of granular composite fabrication workflow. Composite slurries are transferred into 3D printed molds (Ø = 4 mm, H= 2 mm), exposed to visible light (20 mW/cm2) for 3 min. to crosslink microgels, and then removed from molds. b, Schematic of granular composite 3D reconstruction workflow for volume validation. Granular composites are formed with MSC spheroids stained with CellTracker Red and NorHA microgels incorporating FITC-dextran for visualization and processed through confocal microscopy (~300 μm z-stack height and reconstruction via Imaris microscopy software) through RapiClear® tissue clearing; scale bars: 200 μm. c, Quantification of granular composite % total volume for microgel and spheroid components. n=6-8, mean ± s.d. Representative images of 20:80 and 35:65 granular composites and representative 3D reconstructions; scale bars: 200μm. d, Quantification of pore area and % porosity for 20:80 and 35:65 granular composites. n=7, mean ± s.d, ROUT method (Q = 1) determined outliers for pore area and % porosity measurements. Representative confocal slices of granular composites (white) with their porosity highlighted in (black); scale bars: 200 μm. ****P<0.0001, ** P<0.01, *P<0.05, ns=not significant.
Figure 5.
Figure 5.. Long-term chondrogenic culture of granular composites.
a, Schematic of granular composites, where spheroid fusion and growth results in cartilage tissue over time when cultured in the presence of chondrogenic factors. b, Quantification of diameters (left) and images (right) of granular composites with culture for 20:80 and 35:65 spheroid to microgel volume ratios. scale bars: 2 mm; n=3, mean ± s.d. c, Quantification of (i) dsDNA, (ii) sGAG, and (iii) collagen contents of granular composites with culture for 20:80 and 35:65 spheroid to microgel volume ratios. n=3, mean ± s.d. d, Uniaxial compression values of granular composites with culture for 20:80 and 35:65 spheroid to microgel volume ratios. n=3, mean ± s.d. e, Representative histological images of granular composites for 20:80 and 35:65 spheroid to microgel volume ratios at day 56 stained for Alcian blue (pH:1, sGAG) and collagen II (IHC); scale bars: 2 mm; inset scale bars: 500 μm. f, Quantification of area fraction % and integrated density (intensity * area) of sGAG and collagen II for granular composites cultured at day 56. n=3, mean ± s.d. **P<0.01, *P<0.05, ns=not significant.
Figure 6.
Figure 6.. Integration of granular composites with surrounding native cartilage.
a, Schematic (top) and reality (bottom) of integration push-out testing setup. Scale bar: 8 mm. b, Integration strength of 35:65 granular composite with microgel only (i.e., granular hydrogel) and cartilage controls 28 days after culture. n= 7-10, mean ± s.d. c, Representative load vs displacement curves for each condition recorded during pushout tests on day 28. d, Transverse brightfield images of each condition on day 28. Scale bar: 4 mm. ****P<0.0001, *P<0.05.

References

    1. DeLise AM, Fischer L, Tuan RS, Osteoarthr. Cartil 2000, 8, 309. - PubMed
    1. Litviňuková M, Talavera-López C, Maatz H, Reichart D, Worth CL, Lindberg EL, Kanda M, Polanski K, Heinig M, Lee M, Nadelmann ER, Roberts K, Tuck L, Fasouli ES, DeLaughter DM, McDonough B, Wakimoto H, Gorham JM, Samari S, Mahbubani KT, Saeb-Parsy K, Patone G, Boyle JJ, Zhang H, Zhang H, Viveiros A, Oudit GY, Bayraktar OA, Seidman JG, Seidman CE, Noseda M, Hubner N, Teichmann SA, Nature 2020, 588, 466. - PMC - PubMed
    1. Gonzalez-Fernandez T, Tenorio AJ, Saiz AM, Leach JK, Adv. Healthc. Mater 2022. - PMC - PubMed
    1. S. Y. F. and J. K. L. Murphy Kaitlin C, Cell Tissue Res 2015, 357, 91. - PMC - PubMed
    1. Di Caprio N, Burdick JA, Acta Biomater. 2022. - PMC - PubMed

LinkOut - more resources