. 2024 Jan-Dec;16(1):2297450.
doi: 10.1080/19420862.2023.2297450. Epub 2024 Jan 5.

Antibodies to watch in 2024

Affiliations

Antibodies to watch in 2024

Silvia Crescioli et al. MAbs. 2024 Jan-Dec.

Abstract

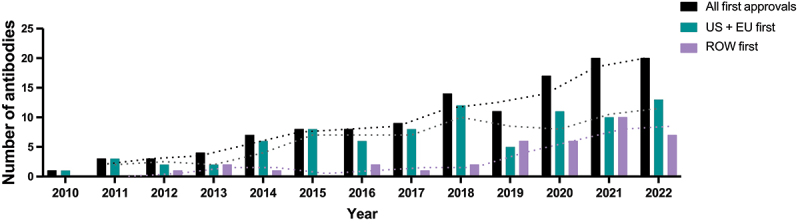
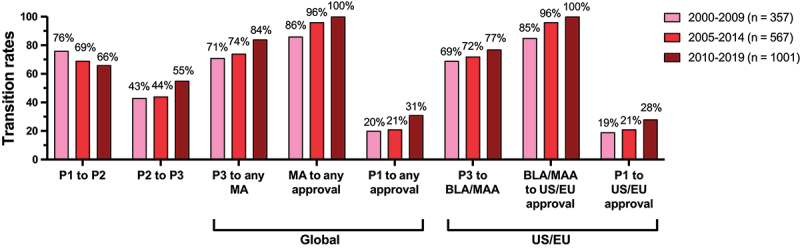
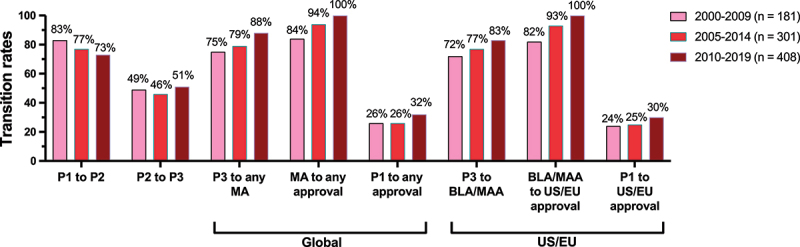
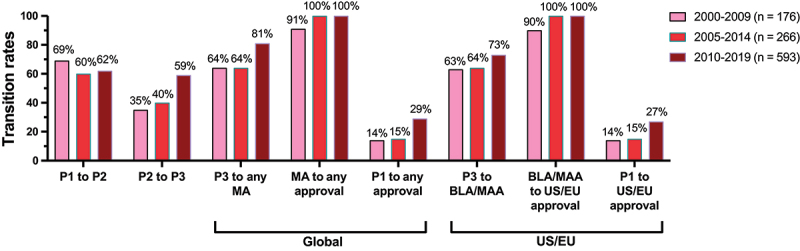
The 'Antibodies to Watch' article series provides an annual summary of commercially sponsored monoclonal antibody therapeutics currently in late-stage clinical development, regulatory review, and those recently granted a first approval in any country. In this installment, we discuss key details for 16 antibody therapeutics granted a first approval in 2023, as of November 17 (lecanemab (Leqembi), rozanolixizumab (RYSTIGGO), pozelimab (VEOPOZ), mirikizumab (Omvoh), talquetamab (Talvey), elranatamab (Elrexfio), epcoritamab (EPKINLY), glofitamab (COLUMVI), retifanlimab (Zynyz), concizumab (Alhemo), lebrikizumab (EBGLYSS), tafolecimab (SINTBILO), narlumosbart (Jinlitai), zuberitamab (Enrexib), adebrelimab (Arelili), and divozilimab (Ivlizi)). We briefly review 26 product candidates for which marketing applications are under consideration in at least one country or region, and 23 investigational antibody therapeutics that are forecast to enter regulatory review by the end of 2024 based on company disclosures. These nearly 50 product candidates include numerous innovative bispecific antibodies, such as odronextamab, ivonescimab, linvoseltamab, zenocutuzumab, and erfonrilimab, and antibody-drug conjugates, such as trastuzumab botidotin, patritumab deruxtecan, datopotamab deruxtecan, and MRG002, as well as a mixture of two immunocytokines (bifikafusp alfa and onfekafusp alfa). We also discuss clinical phase transition and overall approval success rates for antibody therapeutics, which are crucial to the biopharmaceutical industry because these rates inform decisions about resource allocation. Our analyses indicate that these molecules have approval success rates in the range of 14-32%, with higher rates associated with antibodies developed for non-cancer indications. Overall, our data suggest that antibody therapeutic development efforts by the biopharmaceutical industry are robust and increasingly successful.

Keywords: Antibody therapeutics; COVID-19; European Medicines Agency; Food and Drug Administration; SARS-CoV-2; cancer; immune-mediated disorders.


Conflict of interest statement

HK, LW, and JV are employed by companies that develop antibody therapeutics. SC and JMR are employed by The Antibody Society, a nonprofit trade association funded by corporate sponsors that develop antibody therapeutics or provide services to companies that develop antibody therapeutics. JMR is also Editor-in-Chief of mAbs, a biomedical journal focused on topics relevant to antibody therapeutics development.

Figures

Black bars: Annual total number. Green bars: Annual total US or EU first approvals. Violet bars: Annual total first approval in any country or region other than the US or EU. Dotted lines represent the 2-y moving averages for the respective set of bars. Top two ROW countries contributing to totals in 2010–22: China and Japan. Abbreviations: EU, European Union; ROW, rest of world; US, United States of America. Additional antibody therapeutic product data are available at: htt ps://ww w.antibodysociety.org/antibody-therapeutics-product-data/.
Figure 1.
Annual first approvals for antibody therapeutics during 2010–2022.
A bar chart depicting the clinical phase transition and approval success rates for antibody therapeutics for any therapeutic area that entered clinical study during three overlapping 10-y periods between 2000 and 2019. Transition rates for Phase 3 to approval and Phase 1 to approval are provided separately for antibodies granted a first approval in any country or region and for antibodies granted a first approval in the US or EU. With the exception of the Phase 1 to Phase 2 transition, rates are highest for the cohort of antibodies that entered clinical study during 2010 to 2019.
Figure 2.
Clinical phase transition and approval success rates for antibody therapeutics for any therapeutic area that entered clinical study during 3 periods. Pink bars, clinical entry during 2000–2009. Red bars, clinical entry during 2005–2014. Brick red bars, clinical entry during 2010–2019. Cohorts included only novel antibody therapeutics in clinical studies sponsored by commercial firms; biosimilars were excluded. Final fates (approval or termination) are known for 90%, 84% and 59% of the molecules that entered clinical study during 2000–2009, 2005–2014, and 2010–2019, respectively. Mabs in phase 1/2 studies were classified as phase 2; mAbs that advanced to phase 2/3 were classified as phase 3. Transitions occurring between phase 1 to 2 and phase 2 to 3 clinical studies conducted world-wide were included. Global approval refers to a first approval granted in any country or region; US/EU approval refers to a first approval in only the US or EU; supplemental approvals of any kind were not included. Single-step transition rates were calculated as the number of antibody therapeutics that transitioned from a given phase to the next divided by the sum of the number that transitioned and the number that were terminated at that phase at the time of the calculation. Phase 1 to approval rates were calculated by multiplying the four relevant single-step transition rates. Abbreviations: BLA, biologics license application submission to the US Food and Drug Administration; MA, marketing application submission to any regulatory agency; MAA, marketing authorization application submission to the European medicines agency.
A bar chart depicting the clinical phase transition and approval success rates for antibody therapeutics for non-cancer indications that entered clinical study during three overlapping 10-y periods between 2000 and 2019. Transition rates for Phase 3 to approval and Phase 1 to approval are provided separately for antibodies granted a first approval in any country or region and for antibodies granted a first approval in the US or EU. With the exception of the Phase 1 to Phase 2 transition, rates are highest for the cohort of antibodies that entered clinical study during 2010 to 2019.
Figure 3.
Clinical phase transition and approval success rates for antibody therapeutics for non-cancer indications that entered clinical study during 3 periods. Pink bars, clinical entry during 2000–2009. Red bars, clinical entry during 2005–2014. Brick red bars, clinical entry during 2010–2019.
A bar chart depicting the clinical phase transition and approval success rates for antibody therapeutics for cancer that entered clinical study during three overlapping 10-y periods between 2000 and 2019. Transition rates for Phase 3 to approval and Phase 1 to approval are provided separately for antibodies granted a first approval in any country or region and for antibodies granted a first approval in the US or EU. The rates are highest for the cohort of antibodies that entered clinical study during 2010 to 2019.
Figure 4.
Clinical phase transition and approval success rates for antibody therapeutics for cancer that entered clinical study during 3 periods. Pink bars, clinical entry during 2000–2009. Red bars, clinical entry during 2005–2014. Brick red bars, clinical entry during 2010–2019.
A bar chart depicting the number of commercially developed antibody therapeutics that entered clinical study annually during 2000 to 2022. For each year, values are given for the total number, and the numbers specifically evaluated as treatments for cancer and non-cancer indications. Lines representing the 2-y moving averages show substantial increases in the total and the number of antibodies for cancer, but only a modest increase in the number of antibodies for non-cancer indications that entered clinical study during this period.
Figure 5.
Annual number of antibody therapeutics entering clinical study, 2000–2022. Black bars, all antibody therapeutics. Green bars, antibody therapeutics for non-cancer indications only. Purple bars, antibody therapeutics for cancer only. Dotted lines, 2-y moving averages. Totals include only antibody therapeutics sponsored by commercial firms; those sponsored solely by government, academic or nonprofit organizations were excluded. Biosimilar antibodies and fc fusion proteins were also excluded.

References

    1. Kaplon H, Reichert JM.. Antibodies to watch in 2019. MAbs. 2019;11(2):219–35. doi: 10.1080/19420862.2018.1556465. - DOI - PMC - PubMed
    1. Thomas D, Chancellor D, Micklus A, LaFever S, Hay M, Chaudhuri S, Bowden R, Low AW. Clinical development success rates and contributing factors 2011–2020. Biotechnology Innovation Organization Report; 2021. Feb. [accessed 2023 Sept 12]. https://www.bio.org/clinical-development-success-rates-and-contributing-....
    1. Thomas D, Burns J, Audette J, Carroll A, Dow-Hygelund C, Hay M. Clinical development success rates 2006-2015. Biotechnology Innovation Organization Report; 2016. [accessed 2023 Sept]. https://www.bio.org/sites/default/files/legacy/bioorg/docs/Clinical%20De....
    1. Hoy SM. Lecanemab: First Approval. Drugs. 2023;83(4):359–65. doi: 10.1007/s40265-023-01851-2. - DOI - PubMed
    1. Eisai . FDA grants traditional approval for LEQEMBI® (lecanemab-irmb) for the treatment of Alzheimer’s disease; July 7, 2023, press release. [accessed 2023 Aug 15]. https://www.eisai.com/news/2023/news202349.html.

LinkOut - more resources