Substrate specificity and ecological significance of PstS homologs in phosphorus uptake in marine Synechococcus sp. WH8102
- PMID: 38179917
- PMCID: PMC10846223
- DOI: 10.1128/spectrum.02786-23
Substrate specificity and ecological significance of PstS homologs in phosphorus uptake in marine Synechococcus sp. WH8102
Abstract
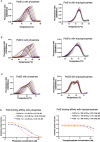
Phosphorus, a vital macronutrient, often limits primary productivity in marine environments. Marine Synechococcus strains, including WH8102, rely on high-affinity phosphate-binding proteins (PstS) to scavenge inorganic phosphate in oligotrophic oceans. However, WH8102 possesses three distinct PstS homologs whose substrate specificity and ecological roles are unclear. The three PstS homologs were heterologously expressed and purified to investigate their substrate specificity and binding kinetics. Our study revealed that all three PstS homologs exhibited a high degree of specificity for phosphate but differed in phosphate binding affinities. Notably, PstS1b displayed nearly 10-fold higher binding affinity (KD = 0.44 µM) compared to PstS1a (KD = 3.3 μM) and PstS2 (KD = 4.3 μM). Structural modeling suggested a single amino acid variation in the binding pocket of PstS1b (threonine instead of serine in PstS1a and PstS2) likely contributed to its higher Pi affinity. Genome context data, together with the protein biophysical data, suggest distinct ecological roles for the three PstS homologs. We propose that PstS1b may be involved in scavenging inorganic phosphorus in oligotrophic conditions and that PstS1a may be involved in transporting recycled phosphate derived from organic phosphate cleavage. The role of PstS2 is less clear, but it may be involved in phosphate uptake when environmental phosphate concentrations are transiently higher. The conservation of three distinct PstS homologs in Synechococcus clade III strains likely reflects distinct adaptations for P acquisition under varying oligotrophic conditions.IMPORTANCEPhosphorus is an essential macronutrient that plays a key role in marine primary productivity and biogeochemistry. However, intense competition for bioavailable phosphorus in the marine environment limits growth and productivity of ecologically important cyanobacteria. In oligotrophic oceans, marine Synechococcus strains, like WH8102, utilize high-affinity phosphate-binding proteins (PstS) to scavenge inorganic phosphate. However, WH8102 possesses three distinct PstS homologs, with unclear substrate specificity and ecological roles, creating a knowledge gap in understanding phosphorus acquisition mechanisms in picocyanobacteria. Through genomic, functional, biophysical, and structural analysis, our study unravels the ecological functions of these homologs. Our findings enhance our understanding of cyanobacterial nutritional uptake strategies and shed light on the crucial role of these conserved nutrient uptake systems in adaptation to specific niches, which ultimately underpins the success of marine Synechococcus across a diverse array of marine ecosystems.
Keywords: Synechococcus; differential scanning fluorimetry (DSF); high-affinity; phosphate binding protein (PstS); phosphate stress.
Conflict of interest statement
The authors declare no conflict of interest.
Figures


Similar articles
-
Biochemical and structural characterization of the cyanophage-encoded phosphate-binding protein: implications for enhanced phosphate uptake of infected cyanobacteria.Environ Microbiol. 2022 Jul;24(7):3037-3050. doi: 10.1111/1462-2920.16043. Epub 2022 May 31. Environ Microbiol. 2022. PMID: 35590460
-
Marine picocyanobacterial PhnD1 shows specificity for various phosphorus sources but likely represents a constitutive inorganic phosphate transporter.ISME J. 2023 Jul;17(7):1040-1051. doi: 10.1038/s41396-023-01417-w. Epub 2023 Apr 22. ISME J. 2023. PMID: 37087502 Free PMC article.
-
Phosphorus scavenging in the unicellular marine diazotroph Crocosphaera watsonii.Appl Environ Microbiol. 2006 Feb;72(2):1452-8. doi: 10.1128/AEM.72.2.1452-1458.2006. Appl Environ Microbiol. 2006. PMID: 16461699 Free PMC article.
-
Functional characterisation of substrate-binding proteins to address nutrient uptake in marine picocyanobacteria.Biochem Soc Trans. 2021 Dec 17;49(6):2465-2481. doi: 10.1042/BST20200244. Biochem Soc Trans. 2021. PMID: 34882230 Free PMC article. Review.
-
Ecological genomics of marine picocyanobacteria.Microbiol Mol Biol Rev. 2009 Jun;73(2):249-99. doi: 10.1128/MMBR.00035-08. Microbiol Mol Biol Rev. 2009. PMID: 19487728 Free PMC article. Review.
Cited by
-
Dissolved organic phosphorus bond-class utilization by Synechococcus.FEMS Microbiol Ecol. 2024 Aug 13;100(9):fiae099. doi: 10.1093/femsec/fiae099. FEMS Microbiol Ecol. 2024. PMID: 39003239 Free PMC article.
References
-
- Ammerman JW, Hood RR, Case DA, Cotner JB. 2003. Phosphorus deficiency in the Atlantic: an emerging paradigm in oceanography. EoS Transactions 84:165–170. doi:10.1029/2003EO180001 - DOI
-
- Karl DM, Tien G. 1997. Temporal variability in dissolved phosphorus concentrations in the subtropical North Pacific ocean. Mar Chem 56:77–96. doi:10.1016/S0304-4203(96)00081-3 - DOI
-
- Cotner JB, Ammerman JW, Peele ER, Bentzen E. 1997. Phosphorus-limited bacterioplankton growth in the Sargasso sea. Aquat Microb Ecol 13:141–149. doi:10.3354/ame013141 - DOI
MeSH terms
Substances
Grants and funding
LinkOut - more resources
Full Text Sources
Research Materials
Miscellaneous

