. 2024 Mar 4;223(3):e202306013.
doi: 10.1083/jcb.202306013. Epub 2024 Jan 5.

USP8 prevents aberrant NF-κB and Nrf2 activation by counteracting ubiquitin signals from endosomes

Affiliations

USP8 prevents aberrant NF-κB and Nrf2 activation by counteracting ubiquitin signals from endosomes

Akinori Endo et al. J Cell Biol. .

Abstract

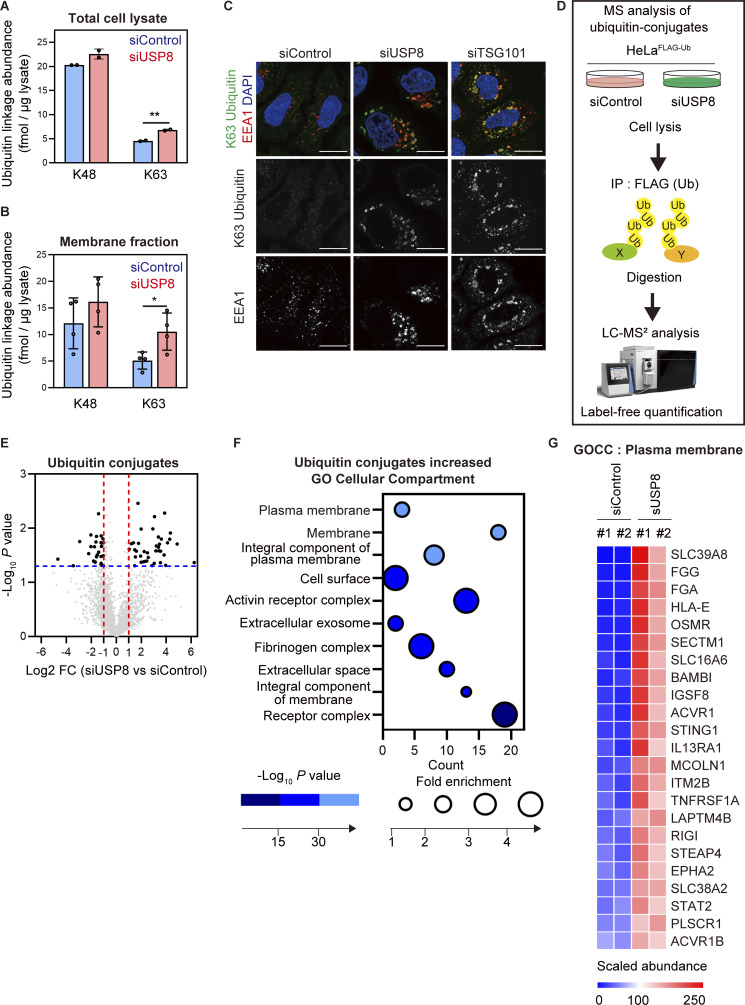
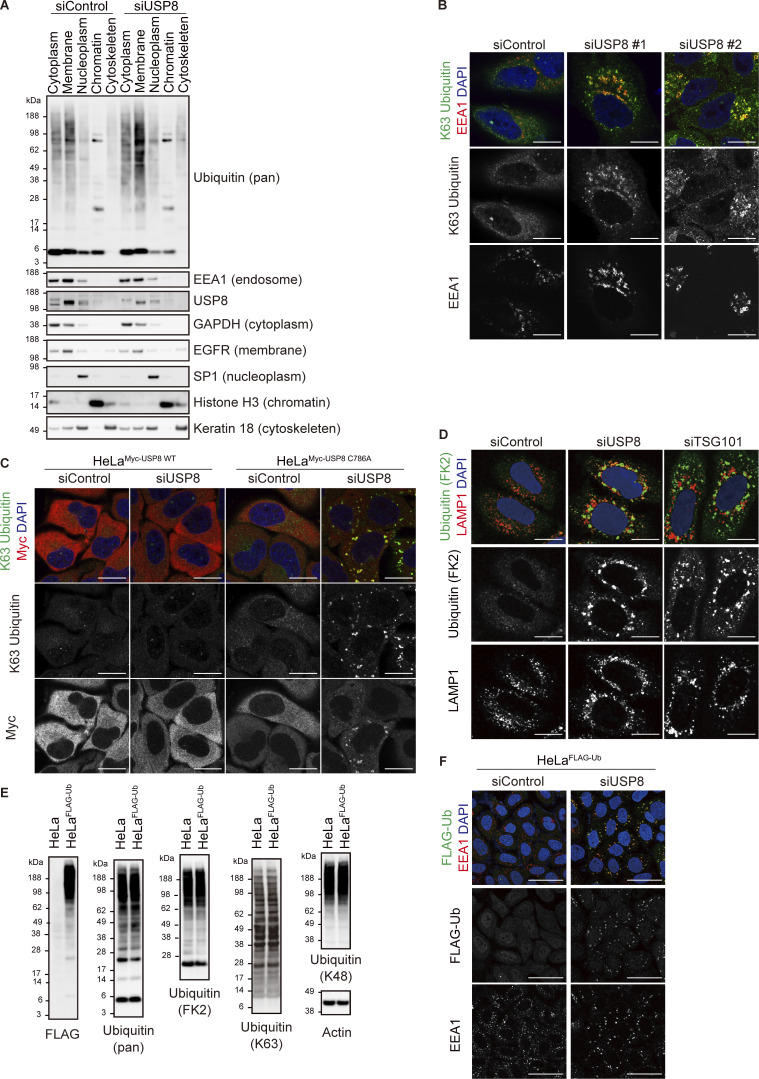
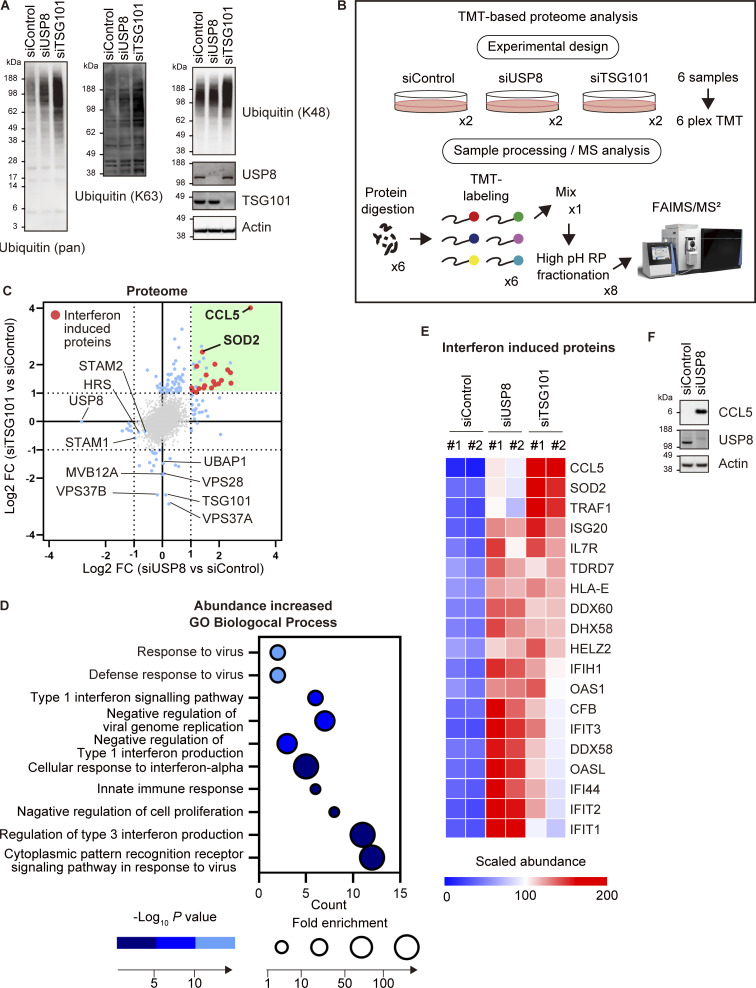
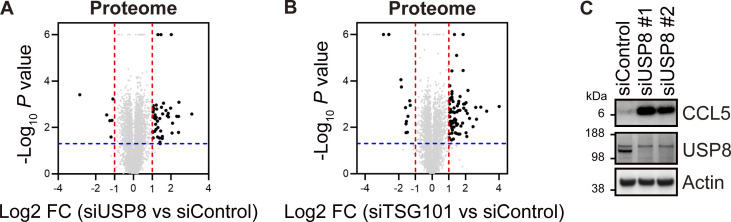
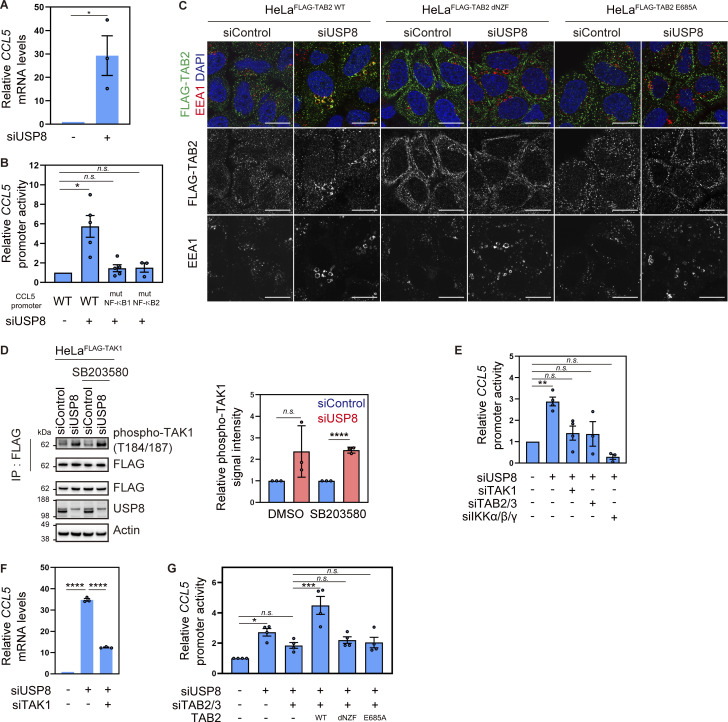
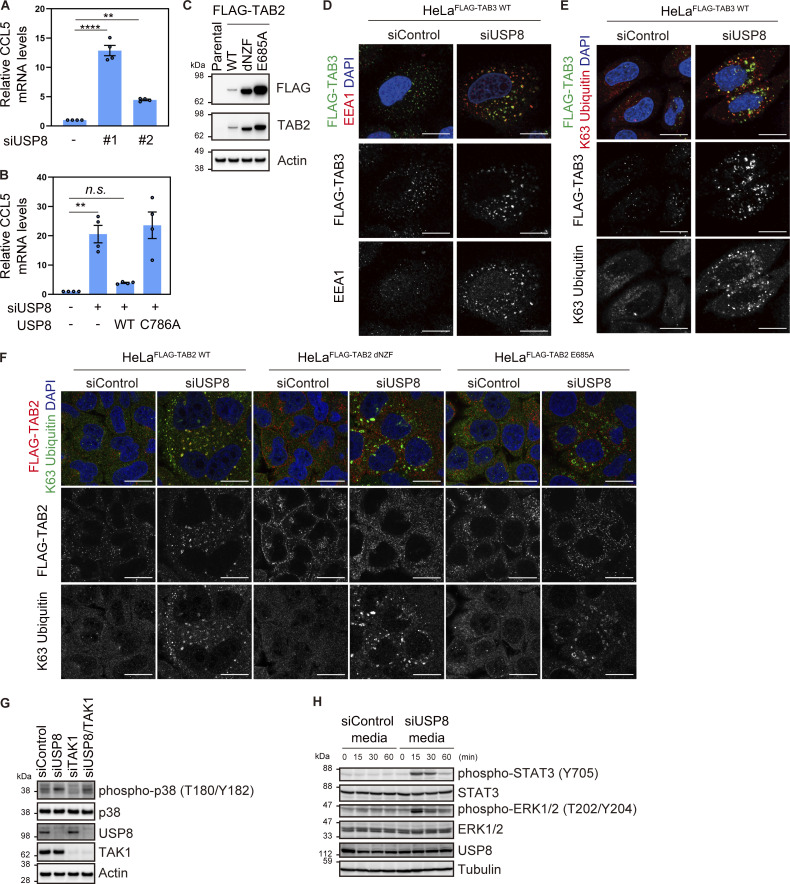
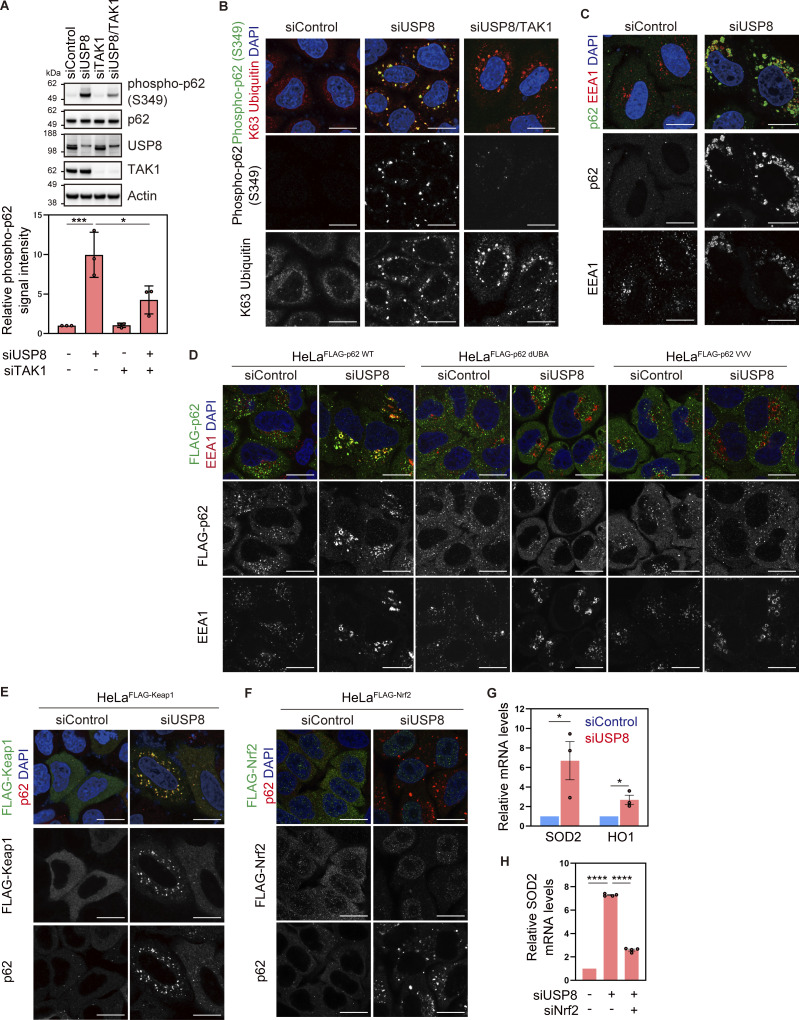
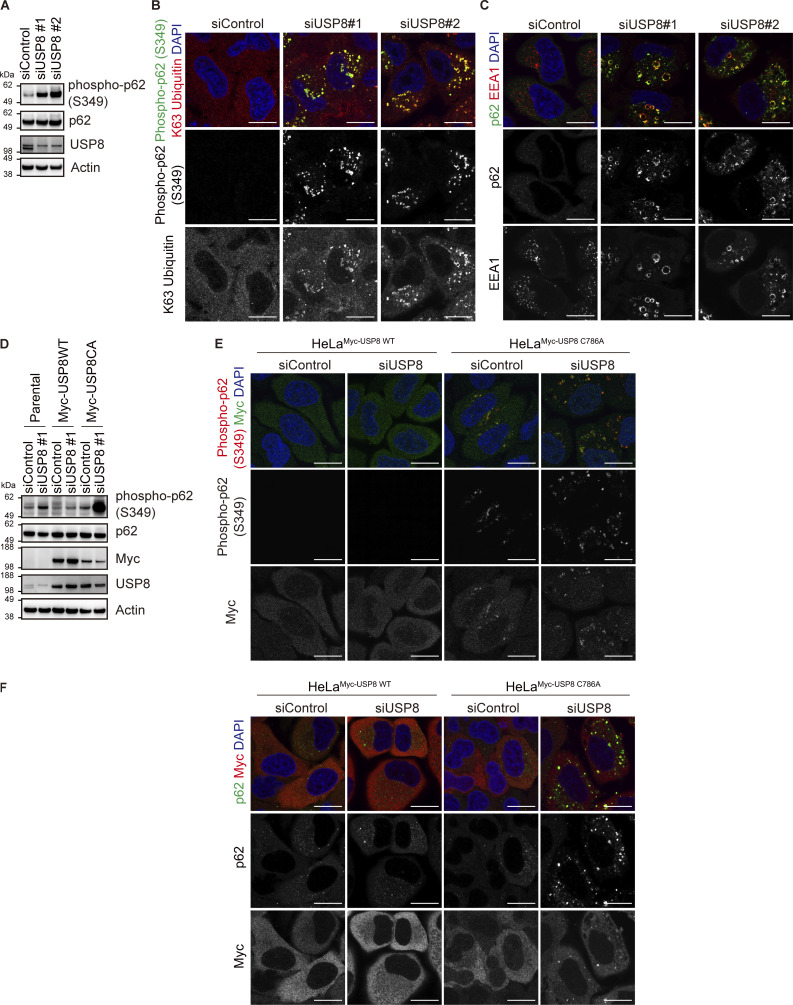
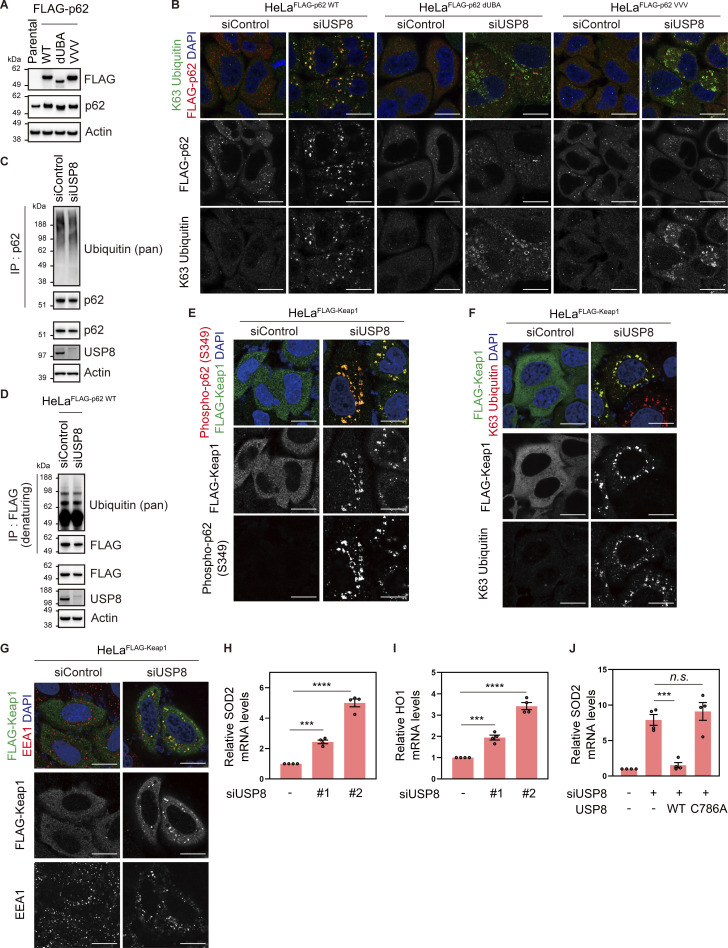
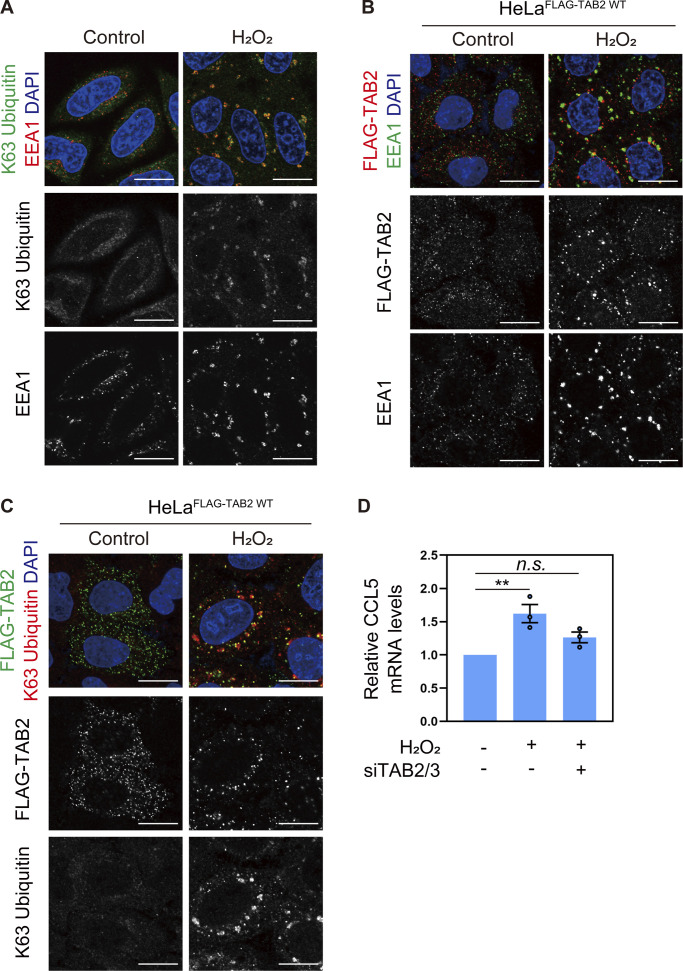
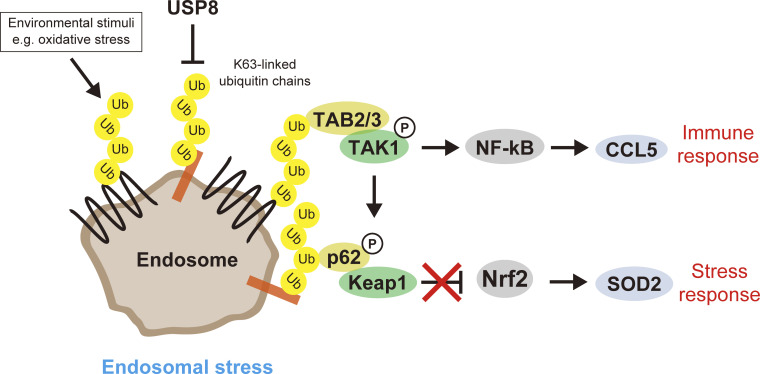
K63-linked ubiquitin chains attached to plasma membrane proteins serve as tags for endocytosis and endosome-to-lysosome sorting. USP8 is an essential deubiquitinase for the maintenance of endosomal functions. Prolonged depletion of USP8 leads to cell death, but the major effects on cellular signaling pathways are poorly understood. Here, we show that USP8 depletion causes aberrant accumulation of K63-linked ubiquitin chains on endosomes and induces immune and stress responses. Upon USP8 depletion, two different decoders for K63-linked ubiquitin chains, TAB2/3 and p62, were recruited to endosomes and activated the TAK1-NF-κB and Keap1-Nrf2 pathways, respectively. Oxidative stress, an environmental stimulus that potentially suppresses USP8 activity, induced accumulation of K63-linked ubiquitin chains on endosomes, recruitment of TAB2, and expression of the inflammatory cytokine. The results demonstrate that USP8 is a gatekeeper of misdirected ubiquitin signals and inhibits immune and stress response pathways by removing K63-linked ubiquitin chains from endosomes.


Conflict of interest statement

Disclosures: The authors declare no competing interests exist.

Figures

Figure 1.
Figure 1.
USP8 depletion induces abnormal accumulation of K63-linked ubiquitinated plasma membrane proteins on endosomes. (A and B) HeLa cells were transfected with the indicated siRNAs. The absolute abundance of K48 and K63 ubiquitin chains in total cell lysates (A) or membrane fractions (B) was analyzed by Ub-PRM. Error bars indicate SD (total cell lysate n = 2 in A, membrane fraction n = 4 in B). *P < 0.05 and **P < 0.01 (two-tailed Student’s t test). (C) HeLa cells transfected with the indicated siRNAs were immunostained with the indicated antibodies and DAPI. Scale bar, 20 μm. (D) Experimental procedures are shown (see also Materials and methods section). HeLa cells transfected with the indicated siRNAs were subjected to LC-MS/MS analysis. (E) The mean log2 FC (siUSP8/siControl) and −log10 P value of the ubiquitin conjugates analysis are shown on the x- and y-axis, respectively. (F) The bubble plot illustrating the GOCC of ubiquitinated proteins increased in USP8-depleted cells is shown (top 10 categories). (G) The heatmap illustrates the changes of proteins hit in the plasma membrane in F. Colors indicate the scaled intensity.
Figure S1.
Figure S1.
Ubiquitin accumulation in USP8-depleted cells. (A) HeLa cells transfected with the indicated siRNAs were subjected to subcellular fractionation. Each fraction (cytoplasm, membrane, nucleoplasm, chromatin, and cytoskeleton) was immunoblotted with the indicated antibodies. (B) HeLa cells transfected with the indicated siRNAs were immunostained with the indicated antibodies and DAPI. Scale bar, 20 μm. (C) HeLa cells stably expressing siRNA-resistant Myc-USP8 WT and C786A were transfected with the indicated siRNAs. Cells were immunostained with the indicated antibodies and DAPI. Scale bar, 20 μm. (D) HeLa cells transfected with the indicated siRNAs were immunostained with the indicated antibodies and DAPI. Scale bar, 20 μm. (E) Total cell lysates from parental HeLa cells and HeLa cells stably expressing FLAG-Ub were immunoblotted with the indicated antibodies. (F) HeLa cells stably expressing FLAG-Ub were transfected with the indicated siRNAs. Cells were immunostained with the indicated antibodies and DAPI. Scale bar, 50 μm. Source data are available for this figure: SourceData FS1.
Figure 2.
Figure 2.
Endosomal stress induces the expression of immune-related genes. (A) Total cell lysates from HeLa cells transfected with the indicated siRNAs were immunoblotted with the indicated antibodies. (B) Experimental procedures are shown (see also Materials and methods section). HeLa cells transfected with the indicated siRNAs were subjected to LC-MS/MS analysis. (C) The mean Log2 FC (siUSP8/siControl, and siTSG101/siControl) are shown on the x- and y-axis, respectively. (D) The bubble plot illustrating the GO enrichment test for biological process of proteins increased in USP8-depleted cells is shown (top 10 categories). (E) The heatmap illustrates the changes of interferon-induced proteins increased in USP8-depleted cells. Colors indicate the scaled intensity. (F) Total cell lysates from HeLa cells transfected with the indicated siRNAs were immunoblotted with the indicated antibodies. Source data are available for this figure: SourceData F2.
Figure S2.
Figure S2.
Proteomic analysis of USP8- and TSG101-depleted cells. (A and B) The mean Log2 FC (siUSP8/siControl in A and siTSG101/siControl in B) and -Log10 P value of the ubiquitin conjugates analysis are shown on the x- and y-axis, respectively. (C) Total cell lysates from HeLa cells transfected with the indicated siRNAs were immunoblotted with the indicated antibodies. Source data are available for this figure: SourceData FS2.
Figure 3.
Figure 3.
Endosomal stress activates TAK1–NF-κB signaling by recruiting TAB2/3. (A) Total RNA from HeLa cells transfected with the indicated siRNAs was analyzed by qRT-PCR. CCL5 expression levels were normalized to actin mRNA levels, and expression levels in cells treated with control siRNA were set to 1. Individual values, mean, and SE of the mean of the relative mRNA levels are shown. Means ± SE were calculated from three biological replicates. *P < 0.05 (two-tailed Student’s t test). (B) HeLa cells transfected with the indicated siRNAs were analyzed by luciferase assay using vectors encoding either WT CCL5 promoter or mutants (mut) lacking NF-κB binding sites. The activities of the CCL5 promoter were normalized to those of the phosphoglycerate kinase (PGK) promoter, and the relative activities of the WT CCL5 promoter in cells treated with control siRNA were set to 1. Individual values, mean, and SE of the mean of the relative promoter activities are shown. Means ± SE were calculated from three and five biological replicates. *P < 0.05 (Kruskal–Wallis and Dunn’s tests). (C) HeLa cells stably expressing FLAG-TAB2 WT, dNZF, and E685A were transfected with the indicated siRNAs. Cells were immunostained with the indicated antibodies and DAPI. Scale bar, 20 μm. (D) HeLa cells stably expressing FLAG-TAK1 were transfected with the indicated siRNAs and treated with or without SB203580. FLAG-TAK1 immunoprecipitated with anti-FLAG antibody and total cell lysates were immunoblotted with the indicated antibodies (left). Signal intensities of phospho-TAK1 were quantified and normalized to those of total immunoprecipitated FLAG-TAK1 (right). Relative intensities in cells treated with control siRNA were set to 1. Individual values, mean, and SD of the mean of relative intensities are shown. Means ± SD were calculated from three biological replicates. ****P < 0.0001 (two-tailed Student’s t test). (E) HeLa cells transfected with the indicated siRNAs were analyzed by luciferase assay using vectors encoding the WT CCL5 promoter. The activities of the CCL5 promoter were normalized to those of the PGK promoter, and the relative activities of the WT CCL5 promoter in cells treated with control siRNA were set to 1. Individual values, mean, and SE of the mean of the relative promoter activities are shown. Means ± SE were calculated from three and four biological replicates. **P < 0.01 (one-way ANOVA with Dunnett’s test). (F) Total RNA from HeLa cells transfected with the indicated siRNAs was analyzed by qRT-PCR. CCL5 expression levels were normalized to actin mRNA levels, and expression levels in cells treated with control siRNA were set to 1. Individual values, mean, and SE of the mean of relative mRNA levels are shown. Means ± SE were calculated from three biological replicates. ****P < 0.0001 (one-way ANOVA with Dunnett’s test). (G) HeLa cells transfected with the indicated siRNAs and vectors to express the indicated proteins were analyzed by luciferase assay using vectors encoding the WT CCL5 promoter. The activities of the CCL5 promoter were normalized to those of the thymidine kinase (TK) promoter, and the relative activities of the WT CCL5 promoter in cells treated with control siRNA were set to 1. Individual values, mean, and SE of the mean of the relative promoter activities are shown. Means ± SE were calculated from four biological replicates. *P < 0.05, ***P < 0.001 (one-way ANOVA with Dunnett’s test). Source data are available for this figure: SourceData F3.
Figure S3.
Figure S3.
TAB2/3-mediated signal transduction in USP8-depleted cells. (A) Total RNA from HeLa cells transfected with the indicated siRNAs was analyzed by qRT-PCR. CCL5 expression levels were normalized to actin mRNA levels, and expression levels in cells treated with control siRNA were set to 1. Individual values, mean, and SE of the mean of relative mRNA levels are shown. Means ± SE were calculated from four biological replicates. **P < 0.01, ****P < 0.0001 (one-way ANOVA with Dunnett’s test). (B) Parental HeLa cells and HeLa cells stably expressing siRNA-resistant Myc-USP8 WT and C786A were transfected with the indicated siRNAs. Total RNA from cells was analyzed by qRT-PCR. CCL5 expression levels were normalized to actin mRNA levels, and expression levels in cells treated with control siRNA were set to 1. Individual values, mean, and SE of the mean of the relative mRNA levels are shown. Means ± SE were calculated from four biological replicates. **P < 0.01 (one-way ANOVA with Dunnett’s test). (C) Total cell lysates from parental HeLa cells and HeLa cells stably expressing FLAG-TAB2 WT, dNZF, and E685A were immunoblotted with the indicated antibodies. (D and E) HeLa cells stably expressing FLAG-TAB3 WT were transfected with the indicated siRNAs. Cells were immunostained with the indicated antibodies and DAPI. Scale bar, 20 μm. (F) HeLa cells stably expressing FLAG-TAB2 WT, dNZF, and E685A were transfected with the indicated siRNAs. Cells were immunostained with the indicated antibodies and DAPI. Scale bar, 20 μm. (G) Total cell lysates from HeLa cells transfected with the indicated siRNAs were immunoblotted with the indicated antibodies. (H) HeLa cells were stimulated with culture media from HeLa cells transfected with the indicated siRNAs. Total cell lysates were immunoblotted with the indicated antibodies. Source data are available for this figure: SourceData FS3.
Figure 4.
Figure 4.
Endosomal stress activates p62–Keap1–Nrf2 signaling. (A) Total cell lysates from HeLa cells transfected with the indicated siRNAs were immunoblotted with the indicated antibodies (top). Signal intensities of phospho-p62 were quantified and normalized to those of total p62 (bottom). Relative intensities in cells treated with control siRNA were set to 1. Individual values, mean, and SD of the mean of relative intensities are shown. Means ± SD were calculated from three biological replicates. *P < 0.05, ***P < 0.001 (one-way ANOVA with Dunnett’s test). (B and C) HeLa cells transfected with the indicated siRNAs were immunostained with the indicated antibodies and DAPI. Scale bar, 20 μm. (D) HeLa cells stably expressing FLAG-p62 WT, dUBA, and VVV were transfected with the indicated siRNAs. Cells were immunostained with the indicated antibodies and DAPI. Scale bar, 20 μm. (E) HeLa cells stably expressing FLAG-Keap1 were transfected with the indicated siRNAs. Cells were immunostained with the indicated antibodies and DAPI. Scale bar, 20 μm. (F) HeLa cells stably expressing FLAG-Nrf2 were transfected with the indicated siRNAs. Cells were immunostained with the indicated antibodies and DAPI. Scale bar, 20 μm. (G) Total RNA from HeLa cells transfected with the indicated siRNAs was analyzed by qRT-PCR. Expression levels of SOD2 and HO1 were normalized to actin mRNA levels, and expression levels in cells treated with control siRNA were set to 1. Individual values, mean, and SE of the mean of relative mRNA levels are shown. Means ± SE were calculated from three biological replicates. *P < 0.05 (two-tailed Student’s t test). (H) Total RNA from HeLa cells transfected with the indicated siRNAs was analyzed by qRT-PCR. SOD2 expression levels were normalized to actin mRNA levels, and expression levels in cells treated with control siRNA were set to 1. Individual values, mean, and SE of the mean of the relative mRNA levels are shown. Means ± SE were calculated from four biological replicates. ****P < 0.0001 (one-way ANOVA with Dunnett’s test). Source data are available for this figure: SourceData F4.
Figure S4.
Figure S4.
Accumulation of phosphorylated p62 on endosomes in USP8-depleted cells. (A) Total cell lysates from HeLa cells transfected with the indicated siRNAs were immunoblotted with the indicated antibodies. (B and C) HeLa cells transfected with the indicated siRNAs were immunostained with the indicated antibodies and DAPI. Scale bar, 20 μm. (D) Parental HeLa cells and HeLa cells stably expressing siRNA-resistant Myc-USP8 WT and C786A were transfected with the indicated siRNAs. Total cell lysates from cells were immunoblotted with the indicated antibodies. (E and F) HeLa cells stably expressing siRNA-resistant Myc-USP8 WT and C786A were transfected with the indicated siRNAs. Cells were immunostained with the indicated antibodies and DAPI. Scale bar, 20 μm. Source data are available for this figure: SourceData FS4.
Figure S5.
Figure S5.
Colocalization of p62 and Keap1 on endosomes in USP8-depleted cells. (A) Total cell lysates from parental HeLa cells and HeLa cells stably expressing FLAG-p62 WT, dUBA, and VVV were immunoblotted with the indicated antibodies. (B) HeLa cells stably expressing FLAG-p62 WT, dUBA, and VVV were transfected with the indicated siRNAs. Cells were immunostained with the indicated antibodies and DAPI. Scale bar, 20 μm. (C) HeLa cells were transfected with the indicated siRNAs. Endogenous p62 immunoprecipitated with anti-p62 antibody and total cell lysates were immunoblotted with the indicated antibodies. (D) HeLa cells stably expressing FLAG-p62 WT were transfected with the indicated siRNAs. FLAG-p62 immunoprecipitated with anti-FLAG antibody under denaturing conditions and total cell lysates were immunoblotted with the indicated antibodies. (E–G) HeLa cells stably expressing FLAG-Keap1 were transfected with the indicated siRNAs. Cells were immunostained with the indicated antibodies and DAPI. Scale bar, 20 μm. (H and I) Total RNA from HeLa cells transfected with the indicated siRNAs was analyzed by qRT-PCR. SOD2 (H) and HO1 (I) expression levels were normalized to actin mRNA levels, and expression levels in cells treated with control siRNA were set to 1. Individual values, mean, and SE of the mean of relative mRNA levels are shown. Means ± SE were calculated from four biological replicates. ***P < 0.001, ****P < 0.0001 (one-way ANOVA with Dunnett’s test). (J) Parental HeLa cells and HeLa cells stably expressing siRNA-resistant Myc-USP8 WT and C786A were transfected with the indicated siRNAs. Total RNA from cells was analyzed by qRT-PCR. SOD2 expression levels were normalized to actin mRNA levels, and expression levels in cells treated with control siRNA were set to 1. Individual values, mean, and SE of the mean of relative mRNA levels are shown. Means ± SE were calculated from four biological replicates. ***P < 0.001 (one-way ANOVA with Dunnett’s test). Source data are available for this figure: SourceData FS5.
Figure 5.
Figure 5.
Oxidative stress is a potent stimulus to induce endosomal stress. (A) HeLa cells treated with 300 μM hydrogen peroxide (H2O2) for 4 h were immunostained with the indicated antibodies and DAPI. Scale bar, 20 μm. (B and C) HeLa cells stably expressing FLAG-TAB2 WT were treated with 300 μM hydrogen peroxide for 4 h. Cells were immunostained with the indicated antibodies and DAPI. Scale bar, 20 μm. (D) Total RNA from HeLa cells transfected with the indicated siRNAs and treated with 300 μM hydrogen peroxide for 4 h was analyzed by qRT-PCR. CCL5 expression levels were normalized to actin mRNA levels, and expression levels in cells treated with control siRNA were set to 1. Individual values, mean, and SE of the mean of relative mRNA levels are shown. Means ± SE were calculated from three biological replicates. **P < 0.01 (one-way ANOVA with Dunnett’s test).
Figure 6.
Figure 6.
Model of endosomal stress.

References

    1. Akimov, V., Barrio-Hernandez I., Hansen S.V.F., Hallenborg P., Pedersen A.K., Bekker-Jensen D.B., Puglia M., Christensen S.D.K., Vanselow J.T., Nielsen M.M., et al. . 2018. UbiSite approach for comprehensive mapping of lysine and N-terminal ubiquitination sites. Nat. Struct. Mol. Biol. 25:631–640. 10.1038/s41594-018-0084-y - DOI - PubMed
    1. Appay, V., and Rowland-Jones S.L.. 2001. RANTES: A versatile and controversial chemokine. Trends Immunol. 22:83–87. 10.1016/S1471-4906(00)01812-3 - DOI - PubMed
    1. Clague, M.J., Liu H., and Urbé S.. 2012. Governance of endocytic trafficking and signaling by reversible ubiquitylation. Dev. Cell. 23:457–467. 10.1016/j.devcel.2012.08.011 - DOI - PubMed
    1. Clague, M.J., Urbé S., and Komander D.. 2019. Breaking the chains: Deubiquitylating enzyme specificity begets function. Nat. Rev. Mol. Cell Biol. 20:338–352. 10.1038/s41580-019-0099-1 - DOI - PubMed
    1. Dufner, A., Kisser A., Niendorf S., Basters A., Reissig S., Schönle A., Aichem A., Kurz T., Schlosser A., Yablonski D., et al. . 2015. The ubiquitin-specific protease USP8 is critical for the development and homeostasis of T cells. Nat. Immunol. 16:950–960. 10.1038/ni.3230 - DOI - PubMed

Publication types

MeSH terms