. 2024 Feb;76(1):72-85.
doi: 10.1007/s43440-023-00562-5. Epub 2024 Jan 5.

Network analysis of monoamines involved in anxiety-like behavior in a rat model of osteoarthritis

Affiliations

Network analysis of monoamines involved in anxiety-like behavior in a rat model of osteoarthritis

Jakub Mlost et al. Pharmacol Rep. 2024 Feb.

Abstract

Background: Chronic pain is a major health problem that affects a significant number of patients, resulting in personal suffering and substantial health care costs. One of the most commonly reported causal conditions is osteoarthritis (OA). In addition to sensory symptoms, chronic pain shares an inherent overlap with mood or anxiety disorders. The involvement of the frontal cortex, striatum and nucleus accumbens, in the affective processing of pain is still poorly understood.

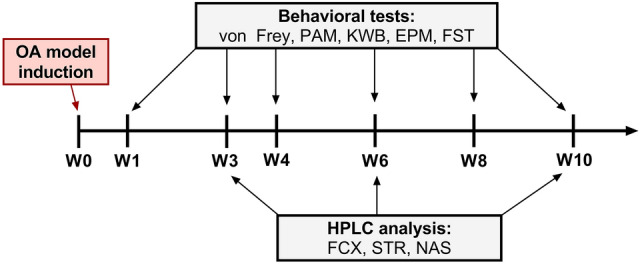
Methods: Male Wistar rats were divided into two groups: MIA (monoiodoacetate injected into the knee-model of OA) and sham (NaCl). Behavioral tests assessing pain, anxiety, and depressive behavior were performed at week 1, 3, 4, 6, 8, and 10. Neurochemical assays were conducted at weeks 3, 6, and 10 post-MIA injection, followed by the neurotransmitters and their metabolites correlation matrix and network analysis.

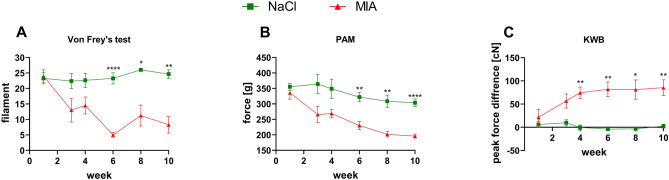
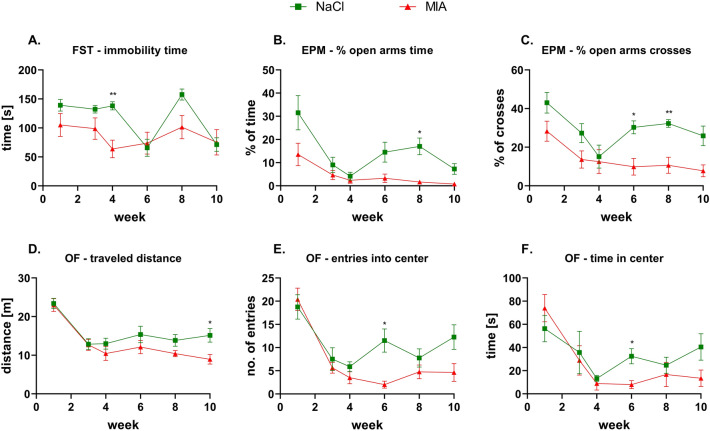
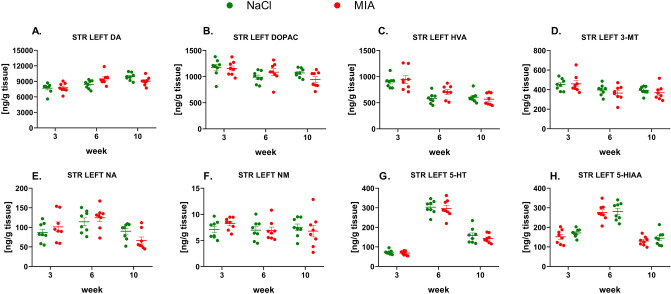
Results: OA animals developed rapid pain phenotype, whereas anxiety-like behavior accompanied the development of a pain phenotype from 6 week post-MIA injection. We did not detect any depressive-like behavior. Instead, immobility time measured in the forced swimming test transiently decreased at 3 weeks post-MIA in the OA group. We detected changes in noradrenaline and serotonin levels in analyzed structures at distinct time points. Network analysis revealed noradrenaline and serotonin neurotransmission changes in the nucleus accumbens, confirming it to be the key structure affected by chronic pain.

Conclusion: Animals with chronic pain exhibit symptoms of anxiety-like behavior and we identified underlying neurochemical changes using network analysis.

Keywords: Anxiety; Chronic pain; Depression; Monoamines; Nucleus accumbens; Osteoarthritis.


Conflict of interest statement

The authors declare no conflicts of interest.

Figures

Fig. 1
Fig. 1
Representative timeline of conducted experiments
Fig. 2
Fig. 2
Tactile allodynia (A), joint hyperalgesia (B), and difference in weight-bearing (C) in OA rats (MIA) or sham-operated controls (NaCl). At week 0, rats were injected (ia) with NaCl (0.9% saline) or MIA (2 mg). Paw sensitivity was measured by Von Frey’s, PAM, and KWB tests 1, 3, 4, 6, 8, and 10 weeks post-MIA injection. Two-way ANOVA (or mixed model) and Šidák’s post hoc test were performed, and groups contained N = 8 animals. Data are presented as mean ± SEM. * denotes p < 0.05; ** denotes p < 0.01; *** denotes p < 0.001; **** denotes p < 0.0001 difference between NaCl and MIA rats. ia, intra-articular; KWB, kinetic weight-bearing; PAM, pressure application measurement; MIA, monoiodoacetate; OA, osteoarhritis
Fig. 3
Fig. 3
Depressive and anxiety behavior analysis. At week 0, rats were injected (ia) with NaCl (0.9% saline) or MIA (2 mg). Time of immobility in the forced swim test (A); % of time spent in the open arms (B) and % of open crosses (C) in the elevated plus maze; traveled distance in the center zone (D), number of entries into the center zone (E), and time spent in the center zone (F) in the open field were measured 1, 3, 4, 6, 8, and 10 weeks after OA model induction. Two-way ANOVA (or mixed model) and Šidák’s post hoc analysis were performed, and groups contained N = 8 animals. Data are presented as mean ± SEM. * denotes p < 0.05; ** denotes p < 0.01 between the NaCl and MIA groups. ia, intra-articular; EPM, elevated plus maze; FST, forced swim test; MIA, monoiodoacetate; OA, osteoarthritis; OF, open field
Fig. 4
Fig. 4
Monoamines DA (A), NA (E), and 5-HT (G) and their metabolite levels (B, C, D, F, H) measured in the right FCX by HPLC. At week 0, rats were injected (ia) with NaCl (0.9% saline) or MIA (2 mg). Rats were decapitated at weeks 3, 6, 10 and right FCX was dissected for further HPLC analysis. Two-way ANOVA (or mixed model) and Šidák’s post hoc analysis were performed, and groups contained N = 8 animals. Data are presented as mean ± SEM, separate dots represent value in individual rats. * denotes p < 0.05 between the NaCl and MIA groups. 3-MT, 3-methoxytyramine; 5-HIAA, 5-hydroxyindoleacetic acid; 5-HT, serotonin; ia, intra-articular; DA, dopamine; DOPAC, 3,4-dihydroxyphenylacetic acid; FCX, frontal cortex; HVA, homovanillic acid; HPLC, high-performance liquid chromatography; MIA, monoiodoacetate; NA, noradrenaline; NAS, nucleus accumbens; NM, normetanephrine; OA, osteoarthritis; STR, striatum
Fig. 5
Fig. 5
Monoamines DA (A), NA (E), and 5-HT (G) and their metabolite levels (B, C, D, F, H) measured in the left FCX by HPLC. At week 0, rats were injected (ia) with NaCl (0.9% saline) or MIA (2 mg). Rats were decapitated at weeks 3, 6, 10 and left FCX was dissected for further HPLC analysis. Two-way ANOVA (or mixed model) and Šidák’s post hoc analysis were performed, and groups contained N = 8 animals. Data are presented as mean ± SEM, separate dots represent value in individual rats. * denotes p < 0.05 between the NaCl and MIA groups. 3-MT, 3-methoxytyramine; 5-HIAA, 5-hydroxyindoleacetic acid; 5-HT, serotonin; ia, intra-articular; DA, dopamine; DOPAC, 3,4-dihydroxyphenylacetic acid; FCX, frontal cortex; HVA, homovanillic acid; HPLC, high-performance liquid chromatography; MIA, monoiodoacetate; NA, noradrenaline; NAS, nucleus accumbens; NM, normetanephrine; OA, osteoarthritis; STR, striatum
Fig. 6
Fig. 6
Monoamines DA (A), NA (E), and 5-HT (G) and their metabolite levels (B, C, D, F, H) measured in the right STR by HPLC. At week 0, rats were injected (ia) with NaCl (0.9% saline) or MIA (2 mg). Rats were decapitated at weeks 3, 6, 10 and right STR was dissected for further HPLC analysis. Two-way ANOVA (or mixed model) and Šidák’s post hoc analysis were performed, and groups contained N = 8 animals. Data are presented as mean ± SEM, separate dots represent value in individual rats. * denotes p < 0.05 between the NaCl and MIA groups. 3-MT, 3-methoxytyramine; 5-HIAA, 5-hydroxyindoleacetic acid; 5-HT, serotonin; ia, intra-articular; DA, dopamine; DOPAC, 3,4-dihydroxyphenylacetic acid; FCX, frontal cortex; HVA, homovanillic acid; HPLC, high-performance liquid chromatography; MIA, monoiodoacetate; NA, noradrenaline; NAS, nucleus accumbens; NM, normetanephrine; OA, osteoarthritis; STR, striatum
Fig. 7
Fig. 7
Monoamines DA (A), NA (E), and 5-HT (G) and their metabolite levels (B, C, D, F, H) measured in the left STR by the HPLC. At week 0, rats were injected (ia) with NaCl (0.9% saline) or MIA (2 mg). Rats were decapitated at weeks 3, 6, 10 and left STR was dissected for further HPLC analysis. Two-way ANOVA (or mixed model) and Šidák’s post hoc analysis were performed, and groups contained N = 8 animals. Data are presented as mean ± SEM, separate dots represent value in individual rats. 3-MT, 3-methoxytyramine; 5-HIAA, 5-hydroxyindoleacetic acid; 5-HT, serotonin; ia, intra-articular; DA, dopamine; DOPAC, 3,4-dihydroxyphenylacetic acid; FCX, frontal cortex; HVA, homovanillic acid; HPLC, high-performance liquid chromatography; MIA, monoiodoacetate; NA, noradrenaline; NAS, nucleus accumbens; NM, normetanephrine; OA, osteoarthritis; STR, striatum
Fig. 8
Fig. 8
Monoamines DA (A), NA (E), and 5-HT (G) and their metabolite levels (B, C, D, F, H) measured in the right NAS by HPLC. At week 0, rats were injected (ia) with NaCl (0.9% saline) or MIA (2 mg). Rats were decapitated at weeks 3, 6, 10 and right NAS was dissected for further HPLC analysis. Two-way ANOVA (or mixed model) and Šidák’s post hoc analysis were performed, and groups contained N = 8 animals. Data are presented as mean ± SEM, separate dots represent value in individual rats. * denotes p < 0.05 between the NaCl and MIA groups. 3-MT, 3-methoxytyramine; 5-HIAA, 5-hydroxyindoleacetic acid; 5-HT, serotonin; ia, intra-articular; DA, dopamine; DOPAC, 3,4-dihydroxyphenylacetic acid; FCX, frontal cortex; HVA, homovanillic acid; HPLC, high-performance liquid chromatography; MIA, monoiodoacetate; NA, noradrenaline; NAS, nucleus accumbens; NM, normetanephrine; OA, osteoarthritis; STR, striatum
Fig. 9
Fig. 9
Monoamines DA (A), NA (E), and 5-HT (G) and their metabolite levels (B, C, D, F, H) measured in the left NAS by HPLC. At week 0, rats were injected (ia) with NaCl (0.9% saline) or MIA (2 mg). Rats were decapitated at weeks 3, 6, 10 and left NAS was dissected for further HPLC analysis. Two-way ANOVA (or mixed model) and Šidák’s post hoc analysis were performed, and groups contained N = 8 animals. Data are presented as mean ± SEM, separate dots represent value in individual rats. ** denotes p < 0.01 between the NaCl and MIA groups. 3-MT, 3-methoxytyramine; 5-HIAA, 5-hydroxyindoleacetic acid; 5-HT, serotonin; ia, intra-articular; DA, dopamine; DOPAC, 3,4-dihydroxyphenylacetic acid; FCX, frontal cortex; HVA, homovanillic acid; HPLC, high-performance liquid chromatography; MIA, monoiodoacetate; NA, noradrenaline; NAS, nucleus accumbens; NM, normetanephrine; OA, osteoarthritis; STR, striatum
Fig. 10
Fig. 10
Correlation networks based on Pearson’s analysis in different treatment groups with N = 8 across all timepoints (3, 6 and 10 weeks). The graph presents correlations with |r| > 0.3 and p < 0.05 in sham (A, C) and MIA (B, D) animals. Red denotes a positive correlation, whereas blue denotes a negative correlation. Edge width represents the strength of the correlation. Yellow borders denote nodes with the highest vertex degree, while red borders denote nodes selected by the Boruta algorithm. 3-MT, 3-methoxytyramine; 5-HIAA, 5-hydroxyindoleacetic acid; 5-HT, serotonin; DA, dopamine; FCX, frontal cortex; MIA, monoiodoacetate; NA, noradrenaline; NAS, nucleus accumbens; NM, normetanephrine; STR, striatum

Similar articles

Cited by

References

    1. Cohen SP, Vase L, Hooten WM. Chronic pain: an update on burden, best practices, and new advances. Lancet. 2021;397(10289):2082–2097. doi: 10.1016/S0140-6736(21)00393-7. - DOI - PubMed
    1. Szewczyk AK, Jamroz-Wiśniewska A, Haratym N, Rejdak K. Neuropathic pain and chronic pain as an underestimated interdisciplinary problem. Int J Occup Med Environ Health. 2022;35(3):249–264. - PMC - PubMed
    1. Mills SEE, Nicolson KP, Smith BH. Chronic pain: a review of its epidemiology and associated factors in population-based studies. Br J Anaesth. 2019;123(2):e273–e283. doi: 10.1016/j.bja.2019.03.023. - DOI - PMC - PubMed
    1. Bryk M, Chwastek J, Mlost J, Kostrzewa M, Starowicz K. Sodium monoiodoacetate dose-dependent changes in matrix metalloproteinases and inflammatory components as prognostic factors for the progression of osteoarthritis. Front Pharmacol. 2021;12:643605. doi: 10.3389/fphar.2021.643605. - DOI - PMC - PubMed
    1. Aqeel M, Rehna T, Sarfraz R. The association among perception of osteoarthritis with adverse pain anxiety, symptoms of depression, positive and negative affects in patients with knee osteoarthritis: a cross sectional study. J Pak Med Assoc. 2021;71(2(B)):645–650. - PubMed

LinkOut - more resources