. 2024 Jan 4;16(1):246-266.
doi: 10.18632/aging.205364. Epub 2024 Jan 4.

The potential value of the Purinergic pathway in the prognostic assessment and clinical application of kidney renal clear cell carcinoma

Affiliations

The potential value of the Purinergic pathway in the prognostic assessment and clinical application of kidney renal clear cell carcinoma

Deqian Xie et al. Aging (Albany NY). .

Abstract

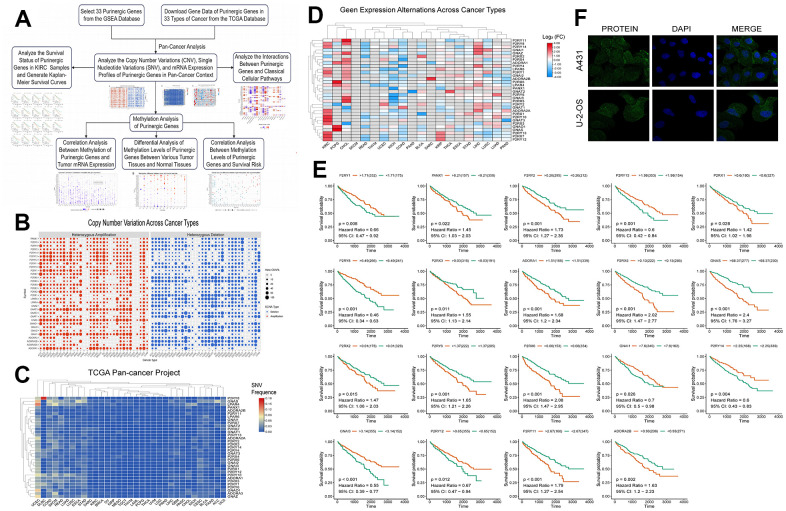
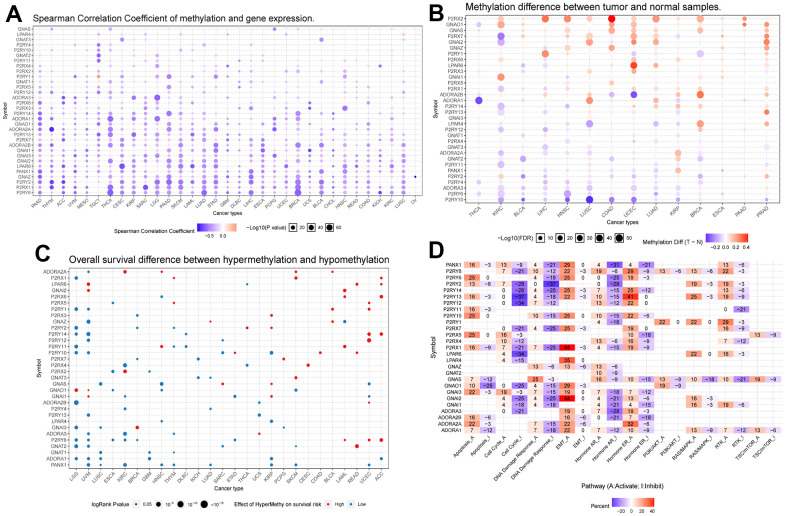
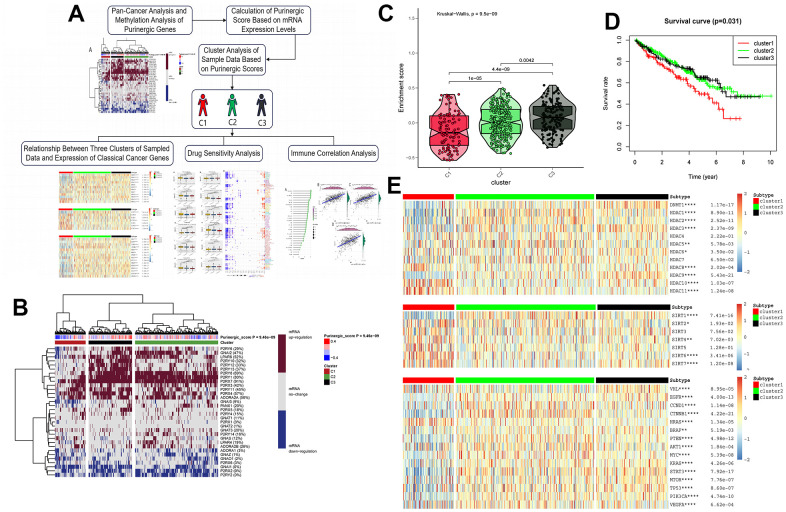
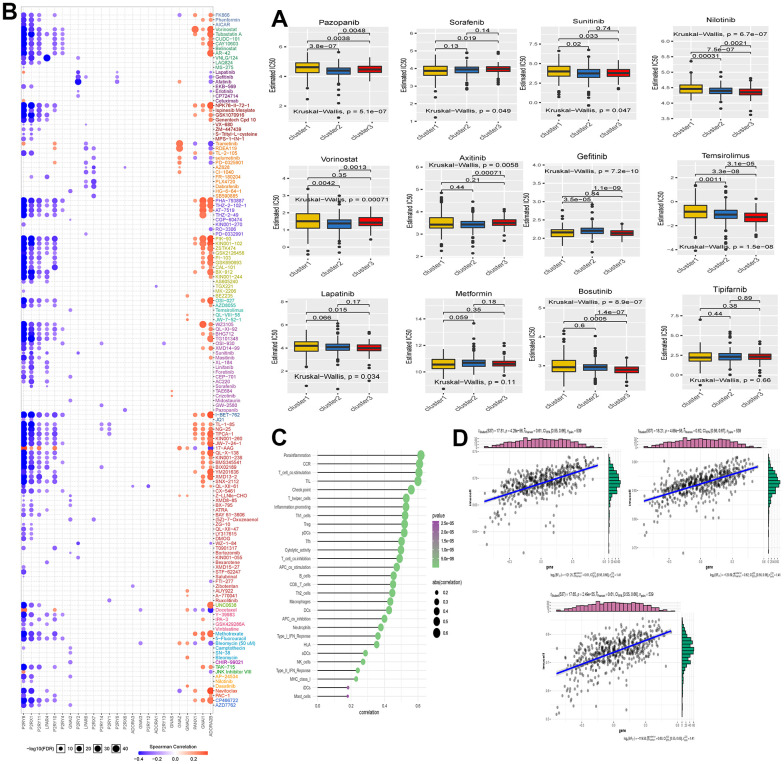
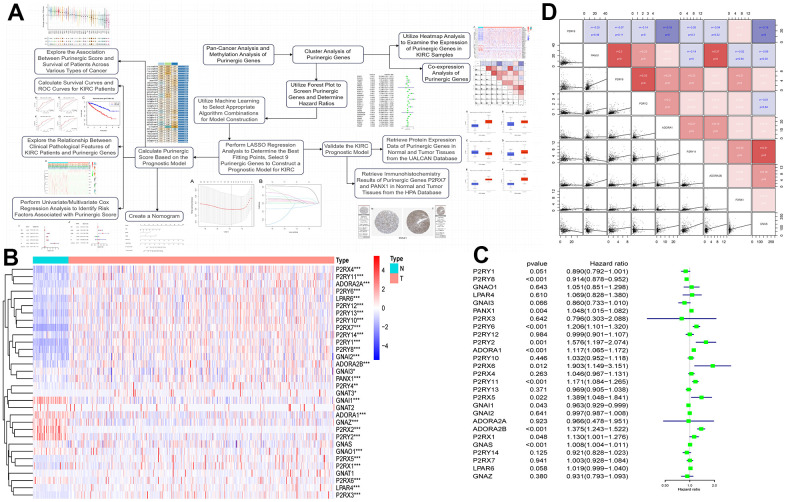
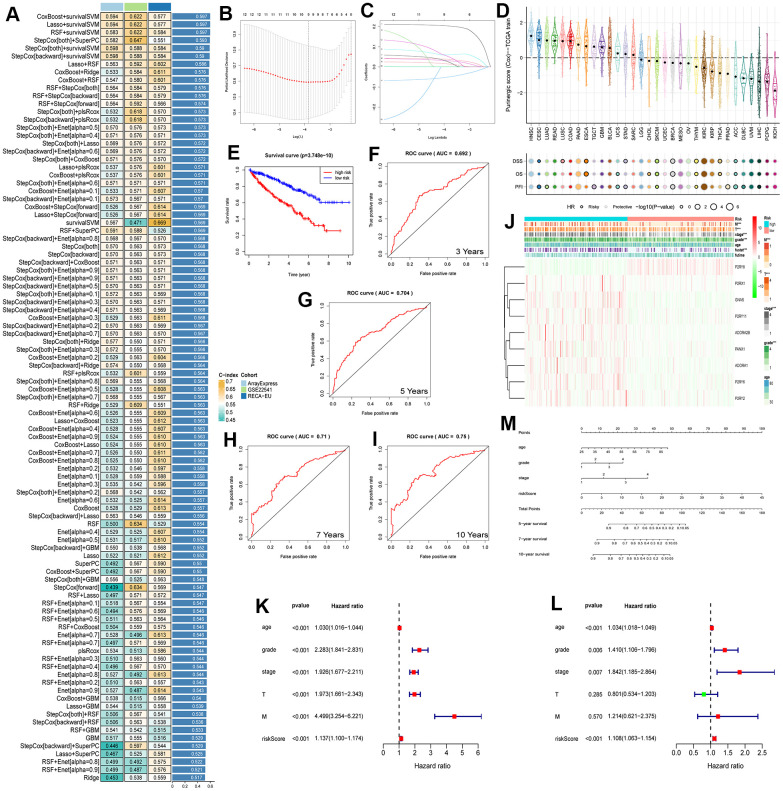
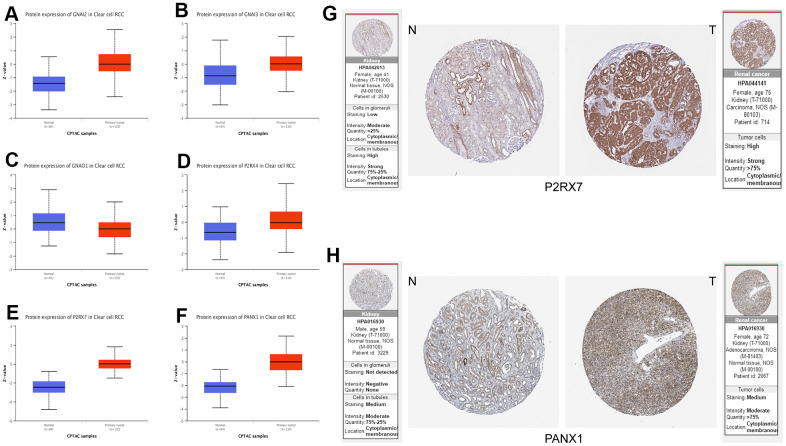
The Purinergic pathway is involved in a variety of important physiological processes in living organisms, and previous studies have shown that aberrant expression of the Purinergic pathway may contribute to the development of a variety of cancers, including kidney renal clear cell carcinoma (KIRC). The aim of this study was to delve into the Purinergic pathway in KIRC and to investigate its potential significance in prognostic assessment and clinical treatment. 33 genes associated with the Purinergic pathway were selected for pan-cancer analysis. Cluster analysis, targeted drug sensitivity analysis and immune cell infiltration analysis were applied to explore the mechanism of Purinergic pathway in KIRC. Using the machine learning process, we found that combining the Lasso+survivalSVM algorithm worked well for predicting survival accuracy in KIRC. We used LASSO regression to pinpoint nine Purinergic genes closely linked to KIRC, using them to create a survival model for KIRC. ROC survival curve was analyzed, and this survival model could effectively predict the survival rate of KIRC patients in the next 5, 7 and 10 years. Further univariate and multivariate Cox regression analyses revealed that age, grading, staging, and risk scores of KIRC patients were significantly associated with their prognostic survival and were identified as independent risk factors for prognosis. The nomogram tool developed through this study can help physicians accurately assess patient prognosis and provide guidance for developing treatment plans. The results of this study may bring new ideas for optimizing the prognostic assessment and therapeutic approaches for KIRC patients.

Keywords: KIRC; Purinergic; bioinformatics; machine learning; survival model.


Conflict of interest statement

CONFLICTS OF INTEREST: The authors declare that the study was conducted without any business or financial relationships that could be interpreted as potential conflicts of interest.

Figures

Figure 1
Figure 1
(A) We retrieved data on Purinergic genes and cancer patients from various databases, and conducted comprehensive analyses on the cancer associations and methylation patterns of these Purinergic genes. (B) CNV frequencies of 32 Purinergic genes in 33 cancer types. Red represents CNV gain, blue represents CNV loss, and the bubble size represents the degree of gain/ loss. (C) SNV frequencies of 33 Purinergic genes in 33 different cancer types. Red represents high mutation frequencies, and blue represents low mutation frequencies. (D) mRNA expression levels of 32 Purinergic genes in 20 different tumor types. Red represents increased mRNA expression, and blue represents decreased mRNA expression. (E) Survival curve analysis of the statistically significant Purinergic genes in KIRC samples. The names of Purinergic genes are labeled at the top of the curves. Orange represents the high expression of this Purinergic gene, and the green represents the low expression of this Purinergic gene. (F) The plot of immunofluorescence results of Purinergic gene PANX1 in A431 and U-2-OS cell lines from the HPA database.
Figure 2
Figure 2
(A) Correlation analysis between Purinergic gene methylation and mRNA expression. The color bar indicates the correlation coefficient's magnitude, and the dots' size represents the comparison between the P-value and 0.05. (B) Analysis of the difference in the degree of methylation of the Purinergic gene in different tumor tissues and normal tissues. The color bar indicates the degree of difference, and the size of the dots represents the comparison between the P-value and 0.05. (C) Correlation analysis between the degree of methylation of the Purinergic gene and survival risk. Red dots represent high survival risk, blue dots represent low survival risk, and the size of the dots represents the comparison between the P-value and 0.05. (D) Relationship between Purinergic genes and classical cellular pathways. A represents activation, and I represent suppression.
Figure 3
Figure 3
(A) Upon finalizing the pan-cancer and methylation studies of the Purinergic gene, we embarked on a clustering analysis of all data samples, grounded on the mRNA expression profiles of this gene. The clustering segmented the samples into three distinct groups. Subsequent analyses of these groups encompassed canonical oncogene studies, drug sensitivity evaluations, and immune infiltration assessments. (B) Purinergic scores were calculated based on the level of mRNA expression of Purinergic genes. KIRC samples were divided into three groups according to different levels of Purinergic scores: low expression group (cluster 1), normal expression group (cluster 2), and high expression group (cluster 3). The brown color in the right color bar indicates increased mRNA expression, the gray color indicates no change in mRNA expression, and the blue color indicates decreased mRNA expression. The closer the Purinergic score is to 0.4, the redder the color is, and the closer it is to -0.4, the bluer the color is. The KIRC samples were divided into three groups by cluster analysis; red, green, and black represent cluster 1, cluster 2, and cluster 3, respectively. (C) The violin plot shows the enrichment scores of the three clustered samples, the results show C3 > C2 > C1, and the p-values for comparison between groups are shown in the figure. (D) Survival curve analysis of the three clustered samples. The results show that the survival rate of KIRC patients in the C1 group is much lower than that of KIRC patients in the C2 and C3 groups. Red represents the C1 group, green represents the C2 group, and black represents the C3 group. The horizontal coordinate unit is the number of years of survival, and the vertical coordinate unit is the probability of survival. (E) Heat map showing the association between the three clustered samples and HDAC, SIRT, and classical oncogenes expression, respectively. The color bar red represents high expression, and blue represents low expression. In the legend, red represents cluster 1, green represents cluster 2, and black represents cluster 3.
Figure 4
Figure 4
(A) The box plot shows the IC50 prediction analysis of the three clustered samples with commonly used KIRC-targeted drugs. The names of the targeted drugs are shown at the top of the box line plot, and the p-values for the group comparisons are shown in the box line plot. (B) Heat map showing correlation analysis between drug sensitivity data obtained from the GDSC database and mRNA expression levels of Purinergic genes. (C) Bubble diagram showing the degree of correlation between Purinergic and immune infiltrating factors. The size of the bubbles indicates the level of correlation between the two, and the color bar indicates the size of the P-value. (D) The three scatter plots show the correlation between Purinergic and Parainflammation, CCR, and T-cell-co.stimulation, respectively.
Figure 5
Figure 5
(A) Upon completing the initial analysis, we further explored the function and divergence of the Purinergic gene in KIRC. Using integrated machine learning techniques, we selected the most suitable algorithmic blend to construct a KIRC prognostic model based on the Purinergic gene. Rigorous validation was performed to ensure the model's precision. (B) Heat map showing the difference in Purinergic gene expression in KIRC tissue versus normal kidney tissue. The light blue color in the legend represents normal kidney tissue, and the light red color represents KIRC tissue. Red in the color bar indicates increased Purinergic gene expression, and blue indicates decreased Purinergic gene expression. * indicates P < 0.05, ** indicates P < 0.01, and *** indicates P < 0.001. (C) Forest plot showing 95% confidence intervals and risk ratio analysis for different Purinergic genes in KIRC. (D) Co-expression analysis between the nine Purinergic genes. The scatter plot represents the regression relationship between two Purinergic genes, and the correlation coefficients between two Purinergic genes are distinguished by color, with red indicating a positive correlation, blue indicating a negative correlation, and darker color indicating a stronger correlation.
Figure 6
Figure 6
(A) The performance of 97 prediction models, developed using the LOOCV framework, as evaluated by their C-index across three distinct datasets. (B, C) KIRC survival models were established by LASSO regression analysis identifying 9 Purinergic genes. (D) The correlation between Purinergic gene expression levels in pan-cancer and the survival outcomes of patients. (E) KIRC patients were divided into high-risk and low-risk groups according to the median risk score, and survival analysis was performed for both groups. (FI) ROC survival curve analysis was performed on the established KIRC model to verify the accuracy of the survival model. The AUC values for the next 3, 5, 7, and 10 years were 0.692, 0.704, 0.71, and 0.75, respectively, and an AUC greater than 0.7 is usually considered predictive. (J) Heat map demonstrating the association between Purinergic gene expression and clinicopathological features of KIRC in the high-risk versus low-risk groups of KIRC. Light blue represents the KIRC high-risk group, and light red represents the KIRC low-risk group. Red in the color bar indicates an increase in Purinergic gene expression, and green indicates a decrease in Purinergic gene expression. *** indicates P < 0.001. (K, L) Univariate and multifactorial Cox regression analysis between risk scores, clinicopathological characteristics, and overall survival in KIRC patients. (M) A nomogram based on the Purinergic gene-associated KIRC survival model can be used to calculate the survival risk of KIRC patients for the next 5, 7, and 10 years by quantifying various factors in KIRC patients.
Figure 7
Figure 7
(AF) Protein expression data of Purinergic genes GNAI2, GNAI3, GNAO1, P2RX4, P2RX7, PANX1 in normal tissues vs. KIRC tissues from UALCAN database. (G, H) Immunohistochemical images of Purinergic genes P2RX7 and PANX1 in normal tissues compared with kidney cancer tissues in the HPA database.

Similar articles

Cited by

References

    1. Ljungberg B, Albiges L, Abu-Ghanem Y, Bedke J, Capitanio U, Dabestani S, Fernández-Pello S, Giles RH, Hofmann F, Hora M, Klatte T, Kuusk T, Lam TB, et al.. European Association of Urology Guidelines on Renal Cell Carcinoma: The 2022 Update. Eur Urol. 2022; 82:399–410. 10.1016/j.eururo.2022.03.006 - DOI - PubMed
    1. Siegel RL, Miller KD, Wagle NS, Jemal A. Cancer statistics, 2023. CA Cancer J Clin. 2023; 73:17–48. 10.3322/caac.21763 - DOI - PubMed
    1. Scelo G, Larose TL. Epidemiology and Risk Factors for Kidney Cancer. J Clin Oncol. 2018; 36:JCO2018791905. 10.1200/JCO.2018.79.1905 - DOI - PMC - PubMed
    1. Kase AM, George DJ, Ramalingam S. Clear Cell Renal Cell Carcinoma: From Biology to Treatment. Cancers (Basel). 2023; 15:665. 10.3390/cancers15030665 - DOI - PMC - PubMed
    1. Cui H, Shan H, Miao MZ, Jiang Z, Meng Y, Chen R, Zhang L, Liu Y. Identification of the key genes and pathways involved in the tumorigenesis and prognosis of kidney renal clear cell carcinoma. Sci Rep. 2020; 10:4271. 10.1038/s41598-020-61162-4 - DOI - PMC - PubMed

Publication types