. 2024 Mar 21;52(5):2648-2671.
doi: 10.1093/nar/gkad1242.

METTL3 drives telomere targeting of TERRA lncRNA through m6A-dependent R-loop formation: a therapeutic target for ALT-positive neuroblastoma

Affiliations

METTL3 drives telomere targeting of TERRA lncRNA through m6A-dependent R-loop formation: a therapeutic target for ALT-positive neuroblastoma

Roshan Vaid et al. Nucleic Acids Res. .

Abstract

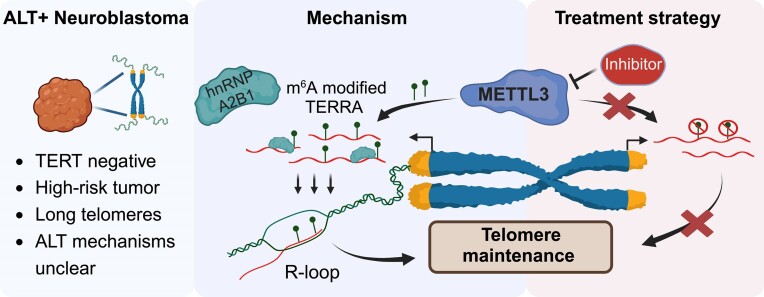
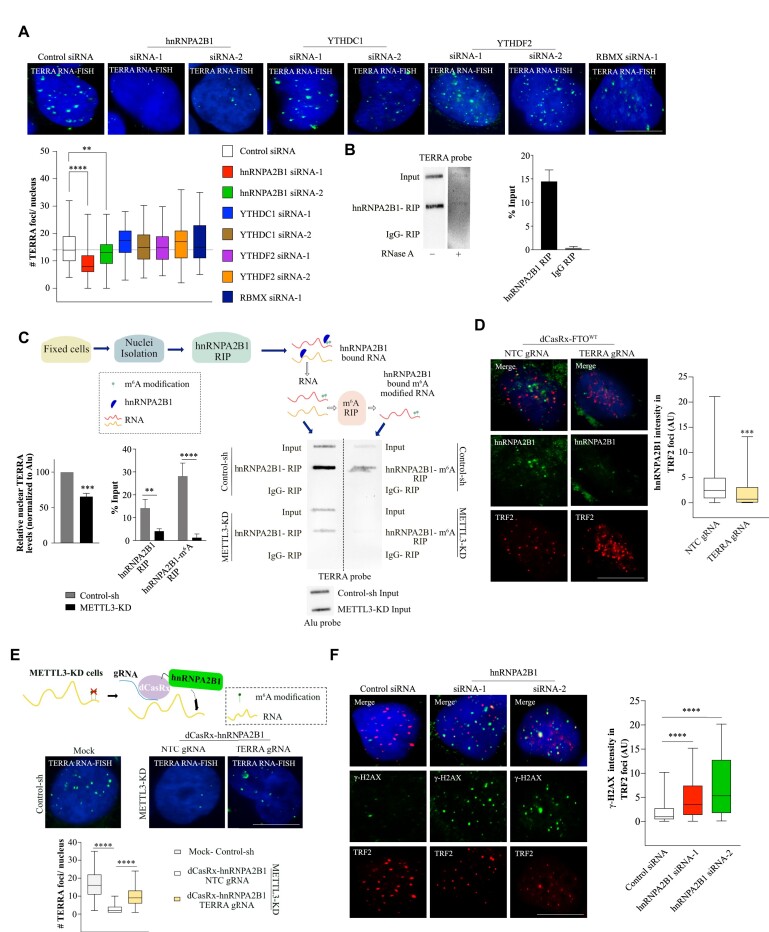
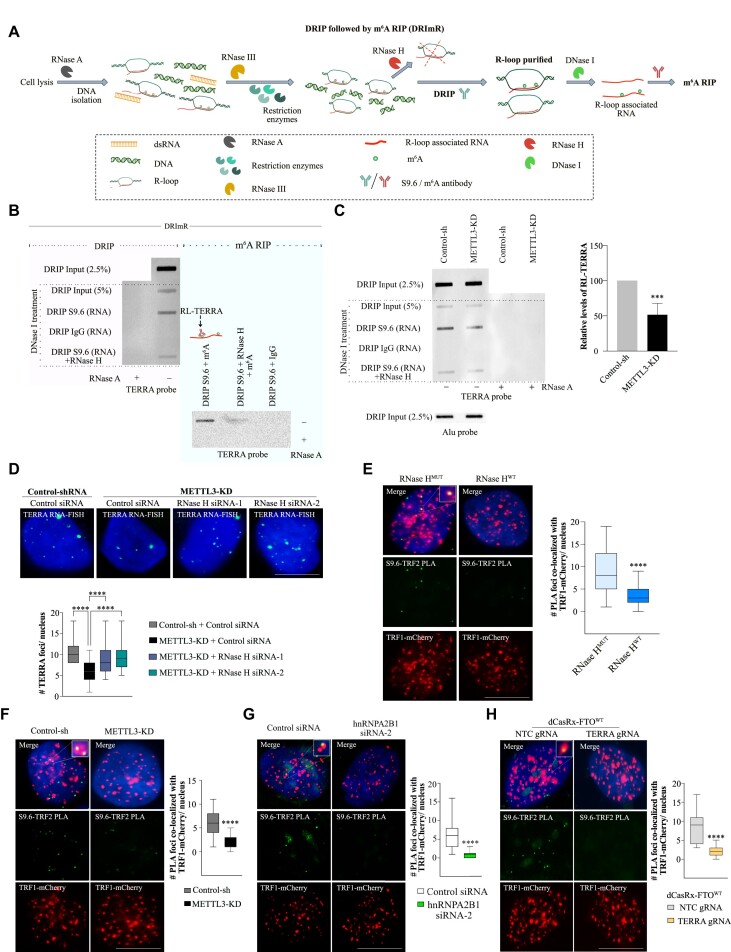
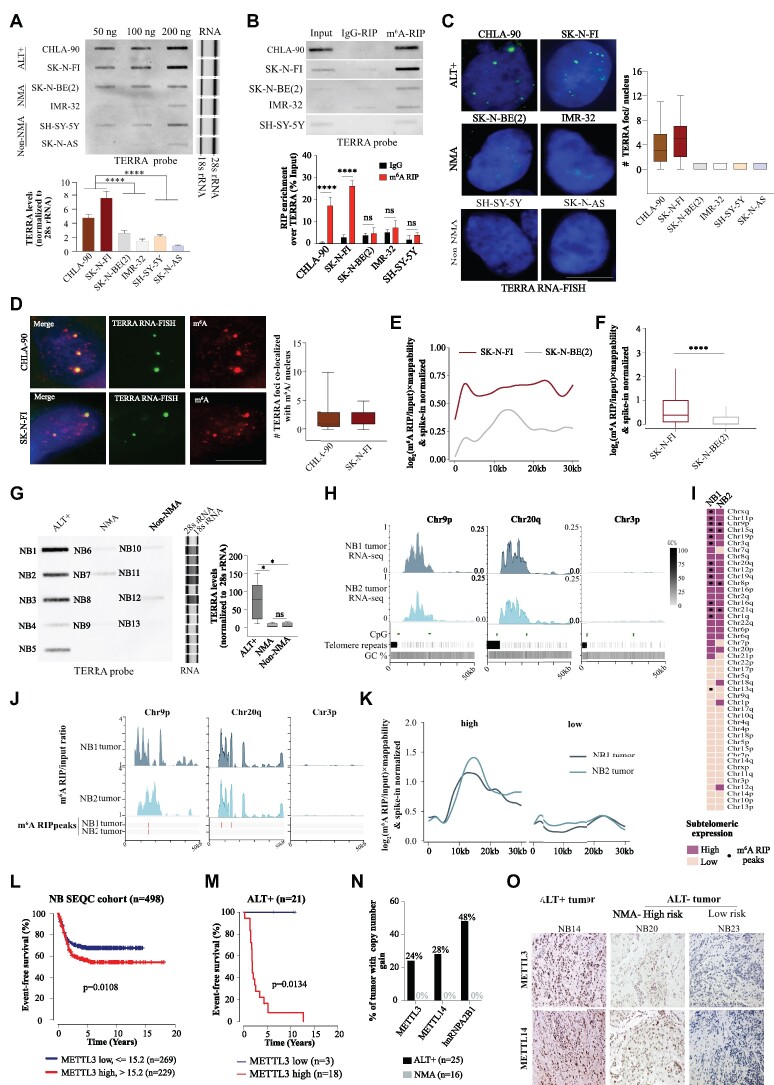
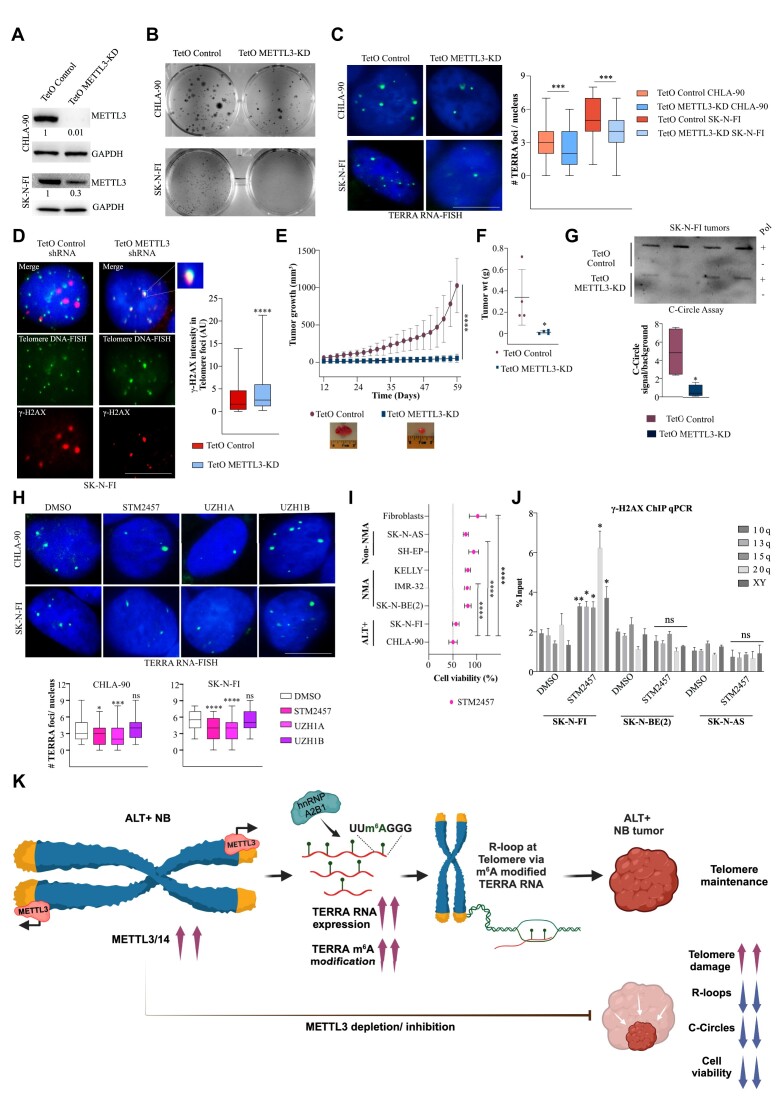
Telomerase-negative tumors maintain telomere length by alternative lengthening of telomeres (ALT), but the underlying mechanism behind ALT remains poorly understood. A proportion of aggressive neuroblastoma (NB), particularly relapsed tumors, are positive for ALT (ALT+), suggesting that a better dissection of the ALT mechanism could lead to novel therapeutic opportunities. TERRA, a long non-coding RNA (lncRNA) derived from telomere ends, localizes to telomeres in a R-loop-dependent manner and plays a crucial role in telomere maintenance. Here we present evidence that RNA modification at the N6 position of internal adenosine (m6A) in TERRA by the methyltransferase METTL3 is essential for telomere maintenance in ALT+ cells, and the loss of TERRA m6A/METTL3 results in telomere damage. We observed that m6A modification is abundant in R-loop enriched TERRA, and the m6A-mediated recruitment of hnRNPA2B1 to TERRA is critical for R-loop formation. Our findings suggest that m6A drives telomere targeting of TERRA via R-loops, and this m6A-mediated R-loop formation could be a widespread mechanism employed by other chromatin-interacting lncRNAs. Furthermore, treatment of ALT+ NB cells with a METTL3 inhibitor resulted in compromised telomere targeting of TERRA and accumulation of DNA damage at telomeres, indicating that METTL3 inhibition may represent a therapeutic approach for ALT+ NB.


Figures

Graphical Abstract
Graphical Abstract
Figure 1.
Figure 1.
(A, top panel) m6A RNA Immunoprecipitation (m6A RIP) on RNA isolated from U-2 OS cells followed by slot blot, probed with DIG-labeled TERRA probe. RNase A treatment was used as a control. (Middle panel) Quantification of the m6A RIP slot blot. Data is represented as a percentage of Input and are shown as mean ± SD from three biological replicates. Unpaired t-test was used, **** P < 0.0001. (Bottom panel) m6A RIP-qPCR validation of samples used in slot blot with TUG1 and HPRT1 primers. Data is represented as a percentage of Input. Data are shown as mean ± SD from three biological replicates. Two-way ANOVA with Sidak's post hoc test was used, ** P < 0.01. m6A RIP in fragmented and non-fragmented RNA. (B) Schematic diagram describing key steps of m6A RIP performed on either fragmented or non-fragmented RNA isolated from Control-sh or METTL3-KD U-2 OS cells. Keys for the schematic are indicated in the box. (C, top panel) m6A RIP performed with either fragmented or non-fragmented RNA isolated from Control-sh or METTL3-KD U-2 OS cells, followed by slot blot with DIG-labeled TERRA repeat probe. (Middle panel) Quantification of the slot blot. Data are shown as mean ± SD from three biological replicates. Two-way ANOVA with Sidak's post hoc test was used, * P < 0.05. (Lower panel) A representative western blot showing METTL3-KD, and GAPDH was used as a loading control. The values below indicate the fold change in levels of METTL3. Detection of UUAG tetramer in TERRA RNA by RNA-MS analysis. (D) Schematic diagram describing key steps of TERRA pulldown (TERRA PD) using biotin tagged TERRA antisense probe and RNA-MS analysis. Keys for the schematic are same as in (B). (E, F) Verification of TERRA PD by either RNA sequencing or slot blot. (E) Boxplot demonstrating log10 mappability normalized RPKM values of TERRA and luciferase (negative) PD at each TERRA or other repeat coordinates. Statistical significance between TERRA and other genomic repeat elements was calculated using the Wilcoxon test, **** P < 0.0001; ns – nonsignificant P> 0.05. (F, left panel) Slot blot assay of input, TERRA PD and negative PD, probed with either TERRA, LINE1, or Alu probe and RNase A treatment was used as a control. (Right panel) Quantification of the slot blot. Data is represented as a percentage of Input and are shown as mean ± SD from three biological replicates. Two-way ANOVA with Sidak's post hoc test was used, *** P < 0.001; ns – nonsignificant P> 0.05. (G, left panel) Base peak chromatogram (BPC): first and second rows show the BPC of standard UUAGp, isolated m/z 651.07 (doubly charged), and Standard UUm6AGp, isolated m/z 658.08 (doubly charged) respectively. Third and fourth rows show the BPC of the TERRA pulldown sample, isolated m/z 651.07 (doubly charged) and isolated m/z 658.08 (doubly charged) respectively. (Middle panel) MS2 spectrum: first and second rows show the MS2 spectrum of Standard UUAGp, isolated m/z 651.07 and Standard UUm6AGp, isolated m/z 658.08 respectively with ions of mass difference 14 (methylation) starting from m/z 673 and up (highlighted in red). Y-axis represents relative abundance in percentage. Third and fourth rows show the MS2 spectrum of the sample, isolated m/z 651.07 and isolated m/z 658.08 respectively with ions of mass difference 14 (methylation) starting from m/z 673 and up (highlighted in red). Y-axis represents absolute abundance. (Right panel) Fragment ion series for the MS2 spectra of UUm6AGp and UUAGp with ions of mass difference 14 (methylation) are highlighted in red. (H, left panel) Chromatin Immunoprecipitation (ChIP) using METTL3 antibody for Control-sh or METTL3-KD U-2 OS cells, followed by slot blot. Blot probed with a DIG-labeled Telomere probe or Alu probe. For blots probed with a telomere probe both optimal and high exposure are presented. The * denotes the band corresponding to telomeres enriched with residual METTL3 in METTL3-KD. (Right panel) Quantification of the METTL3 ChIP slot blot represented as percentage input in the bar graph. IgG antibody was used as a negative control. Data are shown as mean ± SD from three biological replicates. Two-way ANOVA with Sidak's post hoc test was used, **** P < 0.0001; ns - nonsignificant P> 0.05. (I) TERRA foci (green) in U-2 OS cells expressing TRF1-mCherry (red). Box plot shows the number of co-localizations between TRF1-mCherry and TERRA. 72 cells were counted from three independent biological replicates. (J) m6A IF (red) was performed in U-2 OS along with TERRA foci (green). Box plot shows the number of co-localizations between TERRA and m6A. Scale bar is 10 μm. 86 cells were counted from three independent biological replicates.
Figure 2.
Figure 2.
(A) Flow chart depicting the major step of m6A RIP-seq along with RNA-seq performed either on Illumina platform or on Oxford Nanopore Technologies (ONT), to generate short and long RNA-seq reads respectively. (B) Browser screenshot of 50 kb region around the telomere ends in T2T assembly, showing TERRA RNA expression (CPM) from two active chromosome ends (Chr12p, Chr20q) and one less active chromosome end (Chr3p) using ONT long read and Illumina short-read RNA-seq. RNA Pol II (purple) and CTCF (pink) enrichment at 50 kb region around the telomere ends from publicly available RNA Pol II and CTCF ChIP-seq data which were re-analyzed with T2T human genome assembly. CpG islands are marked with green bars and the telomeric repeats in this region are marked with black bars. (C) Heatmap summarizing RNA-seq and m6A RIP-seq data. Chromosomes are sorted based on high (dark violet-pink) and low (light violet-pink) subtelomeric TERRA transcription. Black dots denote m6A RIP-seq peaks and black diamonds denote the differentially modified m6A sites detected by xPore from ONT long reads at subtelomeres. (D) Genome browser screenshots showing IP/input ratio tracks for m6A RIP (Control-sh and METTL3-KD) or IgG RIP (Control-sh) at two active chromosome ends (Chr12p, Chr20q) and one inactive chromosome end (Chr3p). Red bars mark m6A RIP peaks identified using MACS (for short reads) or the differential m6A sites identified using xPore (for long reads) for the samples as denoted. (E) The m6A enrichment profiles across all subtelomeres in T2T assembly in Control-sh and METTL3-KD. The m6A RIP/input signals were normalized to spike-in and the mappability likelihood of each chromosome ending. Subtelomeres (high and low TERRA transcription) were classified according to the normalized median expression shown. (F) Box plot of spike-in, mappability-normalized m6A RIP/input enrichment profiles of all chromosome ends. Statistical significance was calculated using the Wilcoxon test, **** P < 0.0001.
Figure 3.
Figure 3.
(A, left panel) TERRA foci (green) in U-2 OS cells with stable KD of METTL3. (Middle panel) Box plot shows the number of TERRA foci per nucleus. Dunnett's multiple comparisons test was used, **** P < 0.0001. At least 100 cells were counted from three independent biological replicates. (Right panel) A representative western blot showing METTL3 level in stable shRNA-depleted U-2 OS cells. GAPDH was used as a loading control. The values below indicate the fold change in levels of METTL3. (B) Localization of the γ-H2AX (green) over telomere in Control-sh and METTL3-KD cells. Telomere is detected by TRF2 staining (red). Box plot shows the γ-H2AX intensity in TRF2 foci (Arbitrary units, AU). Dunnett's multiple comparisons test was used, **** P < 0.0001. At least 70 cells were counted from three independent biological replicates. (C) Localization of γ-H2AX (green) over telomere (marked by TRF2) in bleomycin-treated Control and METTL3-KD cells 4 h post-treatment and followed by 20 h of recovery without bleomycin. Box plot shows the γ-H2AX intensity in TRF2 foci (Arbitrary units, AU). Two-way ANOVA with Tukey's post hoc test was used, **** P <0.0001. At least 70 cells were counted from three independent biological replicates. (D) m6A IF (red) along with TERRA RNA-FISH (green) was performed in U-2 OS cells 4 h post-treatment and followed by 20 h of recovery without bleomycin. Box plot shows the m6A intensity in TERRA foci (Arbitrary units, AU). One-way ANOVA with Tukey's post hoc test was used, **** P <0.0001. At least 70 cells were counted from three independent biological replicates. (E) Cartoon demonstrating recruitment of dCasRx-METTL3 to target RNA. TERRA RNA-FISH detecting TERRA foci (green) was performed on METTL3-KD U-2 OS cells expressing dCasRx-METTL3WT (wild-type- shRNA resistant) / dCasRx-METTL3MUT (catalytically dead APPA mutant- shRNA resistant) with either NTC (non-target control) or TERRA guide RNA. Control-sh cells were used as a positive control for TERRA RNA-FISH. Box plot shows the quantification of the number of TERRA foci per nucleus in the conditions as indicated. One-way ANOVA with Tukey's post hoc test was used, **** P < 0.0001; ns - nonsignificant p> 0.05. At least 100 cells were counted from three independent biological replicates. (F) Illustration demonstrating recruitment of dCasRx-FTO to target RNA. m6A RIP followed by TERRA slot blot on RNA isolated from U-2 OS cells expressing dCasRx-FTOWT with either NTC or TERRA guide RNA. IgG antibody was used as a negative control for the RIP experiment. Input samples were probed with an Alu probe to serve as a loading control. Bar graph shows the quantification of slot blot. Data are shown as mean ± SD from three biological replicates. Unpaired t-test was used, **** P < 0.0001 (G) TERRA RNA-FISH detecting TERRA foci (green) was performed on U-2 OS cells expressing dCasRx-FTOWT (wild-type) / dCasRx-FTOMUT (catalytically dead—H231A and D233A mutant) with either NTC or TERRA guide RNA. Box plot shows the quantification of TERRA foci per nucleus. At least 70 cells were counted from three independent biological replicates. One-way ANOVA with Tukey's post hoc test was used, **** P < 0.0001; ns – nonsignificant P> 0.05.
Figure 4.
Figure 4.
(A) TERRA foci (green) in U-2 OS cells with siRNA-mediated transient KD of m6A reader proteins as denoted. Box plot shows the number of TERRA foci per nucleus. At least 100 cells were counted from three independent biological replicates. Dunnett's multiple comparisons test was used ** P < 0.01; **** P < 0.0001. (B) hnRNPA2B1 RIP followed by TERRA slot blot demonstrates the interaction of hnRNPA2B1 with TERRA. Quantification of the hnRNPA2B1 RIP slot blot represented as percentage input in the bar graph. IgG RIP and RNase A treatment were used as controls. Data are shown as mean ± SD from three biological replicates. (C) Scheme and results of the re-RIP (hnRNPA2B1-m6A) experiment in Control-sh or METTL3-KD U-2 OS cells. First RIP was performed with hnRNPA2B1/IgG antibody, the precipitated RNA was further subjected to RIP with m6A antibody. The RNA after hnRNPA2B1 RIP and re-RIP were blotted and probed with the TERRA probe. Input samples were probed with an Alu probe to serve as a loading control. RIP with IgG served as a negative control. Bar graph shows the quantification of TERRA in the nuclear input (Control-sh Vs. METTL3-KD) normalized to Alu (loading control) and for RIP/re-RIP experiment presented as percentage of input. Data are shown as mean ± SD from three biological replicates. Unpaired t-test was used, ** P < 0.01; *** P < 0.001; **** P < 0.0001. (D) IF with hnRNPA2B1(green) and telomeres (TRF2, red) in U-2 OS cells recruited with dCasRx-FTOWT at TERRA or NTC. Box plot shows the hnRNPA2B1 intensity in TRF2 foci (Arbitrary units, AU). At least 90 cells were counted from three independent biological replicates. Unpaired t-test was used, *** P < 0.001. (E) Cartoon demonstrating recruitment of dCasRx-hnRNPA2B1 to target RNA in METTL3-KD U-2 OS cells. TERRA RNA-FISH detecting TERRA foci (green) was performed on METTL3-KD U-2 OS cells expressing dCasRx-hnRNPA2B1 with either NTC or TERRA guide RNA. Control-sh cells were used as a positive control for TERRA RNA-FISH. Box plot shows the quantification of TERRA foci per nucleus in the conditions as indicated. At least 100 cells were counted from three independent biological replicates. One-way ANOVA with Tukey's post hoc test was used, **** P < 0.0001. (F) γ-H2AX (green) accumulation at telomeres (TRF2, red) in U-2 OS cells with siRNA-mediated KD of hnRNPA2B1. Box plot shows the γ-H2AX intensity in TRF2 foci. At least 75 cells were counted from three independent biological replicates. Dunnett's multiple comparisons test was used, **** P < 0.0001. Scale bar is 10 μm.
Figure 5.
Figure 5.
(A) Schematic diagram describing the DRIP and DRImR method to purify R-loop bound RNA and R-loop bound m6A modified RNA respectively. (B) Blot on the left is from RNA purified in the DRIP experiment and the blot on the right is from the DRImR experiment performed on U-2 OS cells. Experiments performed with IgG antibody or nucleic acid pre-treated with RNase H served as a control. RNase A treatment was done to affirm the presence of only RNA in the final elution in the lanes indicated. Blots were probed with a DIG-labeled TERRA probe. (C) RNA enriched in R-Loops from Control-sh or METTL3-KD U-2 OS cells were isolated by the DRIP method followed by slot blot assay. Blot was probed with a DIG-labeled TERRA probe. Input samples probed with an Alu probe served as a loading control. DRIP performed with IgG antibody or pre-treatment with RNase H served as a control. RNase A treatment was done to affirm the presence of only RNA in the final elution. Bar graph shows the quantification of the blots. Data are shown as mean ± SD from three biological replicates. Unpaired t-test was used, *** P < 0.001. (D) TERRA RNA-FISH detecting TERRA foci (green) in Control-sh or METTL3-KD U-2 OS cells that were transfected with either Control siRNA or siRNAs against RNase H. Box plot shows the quantification of TERRA foci per nucleus. At least 100 cells were counted from three independent biological replicates. One-way ANOVA with Tukey's post hoc test was used, **** P < 0.0001. R-loop PLA assay. (E) PLA in U-2 OS TRF1-mCherry cells with overexpression of either RNase HMUT (left) or RNase HWT (right) depicting the interaction of TRF2 with R-Loop (S9.6 antibody). TRF1-mCherry (Red), PLA foci (green) in the nucleus (marked by DAPI). Box plot shows the number of overlaps of PLA signal and TRF1-mCherry per nucleus. At least 100 cells were counted from three independent biological replicates. Unpaired t-test was used, **** P < 0.0001. (F–H) PLA depicting the interaction of TRF2 with R-Loop (S9.6 antibody) in U-2 OS TRF1-mCherry cells with (F) Control-sh or METTL3-KD. (G) Control siRNA or hnRNPA2B1 siRNA2. TRF1-mCherry (red), PLA foci (green) in the nucleus (marked by DAPI). Box plot shows the number of overlaps of PLA signal and TRF1-mCherry per nucleus. At least 70 cells were counted from three independent biological replicates. Unpaired t-test was used, **** P < 0.0001. (H) U-2 OS TRF1-mCherry cells expressing dCasRx-FTO with either NTC (left) or TERRA guide RNA (right). Box plot shows the quantification of the overlapping PLA and TRF1-mCherry signal. At least 105 cells were counted from three independent biological replicates. Unpaired t-test was used, **** P < 0.0001. Scale bar is 10 μm.
Figure 6.
Figure 6.
(A) Profiling TERRA expression in ALT+ and ALT- NB cell lines (with MYCN amplification [NMA] and without MYCN amplification [Non-NMA]) by slot blot assay performed with 50, 100, and 200 ng of RNA isolated from cell lines indicated. Blot probed with a DIG-labeled TERRA probe. TapeStation profile on the right shows 18s and 28s rRNA served as a loading control. Bar graph shows the TERRA level quantified from blots and normalized to 28s rRNA loading control. Data are shown as mean ± SD from three biological replicates. One-way ANOVA with Tukey's post hoc test was used, **** P < 0.0001. (B) m6A RIP followed by TERRA slot blot on RNA isolated from ALT+ and ALT-cell lines. RIP with IgG severed as a negative control. Bar graph shows the quantification of the blots. Data are shown as mean ± SD from three biological replicates. Sidak's multiple comparisons test was used, **** P < 0.0001; ns - nonsignificant P> 0.05. (C) TERRA foci (green) visualized by TERRA RNA-FISH in ALT+ (upper panel), NMA (middle panel) and Non-NMA (lower panel) NB cell lines. Box plot shows the quantification of the TERRA foci per nucleus. At least 67 cells were counted from three independent biological replicates. (D) TERRA foci (green) combined with m6A (red) IF in CHLA-90 (top) and SK-N-FI (bottom) cells. Box plot shows the number of overlaps of TERRA and m6A per nucleus. At least 65 cells were counted from three independent biological replicates. Scale bar is 10 μm. (E) The m6A enrichment profiles across all subtelomeres using T2T assembly in SK-N-FI and SK-N-BE(2) cells. The m6A RIP/input signals were normalized to spike-in and to the mappability likelihood of each chromosome ends. (F) Box plot of spike-in, mappability-normalized m6A RIP/input enrichment profiles of all subtelomeres in SK-N-FI and SK-N-BE(2). Statistical significance was calculated using the Wilcoxon test, **** P < 0.0001. (G, left panel) TERRA expression in ALT+, NMA and Non-NMA NB patient tumor RNA samples were detected by slot blot assay performed with 100 ng of total RNA. (Middle panel) TapeStation profile shows 18s and 28s rRNA served as a loading control, samples are loaded as NB1 to NB13 from top to bottom. (Right panel) Box plot shows the TERRA level quantified from blots and normalized to 28s rRNA loading control. Two-way ANOVA with Tukey's post hoc test was used, * P < 0.05; ns - nonsignificant P> 0.05. (H) Representative browser screenshot of 50 kb region around the telomere ends, showing TERRA RNA expression (CPM) from two of the active chromosome ends (Chr9p, Chr16q) and one inactive chromosome end (Chr3p) using Illumina short read RNA-seq performed on NB1 and NB2 tumor samples. CpG islands are marked with green bars and the telomeric repeats in this region are marked with black bars. (I) Heatmap summarizing RNA-seq and m6A RIP-seq data of two NB tumor samples (NB1 and NB2). Chromosomes are sorted based on high (dark-colored) and low (light-colored) subtelomeric TERRA transcription. Black dots denote m6A RIP-seq peaks identified using MACS peak caller in these NB tumor samples. (J) Genome browser screenshots showing m6A RIP/input ratio tracks for NB1 and NB2 tumor samples at two active chromosome ends (Chr12p, Chr20q) and one inactive chromosome end (Chr3p). Red bars mark m6A RIP peaks identified using MACS peak caller. (K) The m6A enrichment profiles across subtelomeres using T2T assembly in NB1 and NB2 tumors. The m6A RIP/input signals were normalized to spike-in and to the mappability likelihood of each chromosome ends. Subtelomeres (high and low TERRA transcription) were classified according to the normalized median expression shown. (L) Event-free survival of NB patients (n = 498, SEQC cohort) with either low (blue) or high (red) expression of METTL3. (M) Event-free survival of ALT+ NB patients (n = 21) with either low (blue) or high (red) expression of METTL3. (N) Bar graph showing the percentage of ALT+ or NMA tumors with copy number gain in METTL3, METTL14, or hnRNPA2B1 genes. (O) Immunohistochemistry (IHC) analysis of METTL3 and METTL14 in human neuroblastoma tumors belonging to either of the subgroups (ALT+, NMA- high risk, or low risk). Sections were counterstained with hematoxylin. One representative image is presented from each subgroup of NB patients.
Figure 7.
Figure 7.
(A) A representative western blot showing METTL3 level in TetO Control and METTL3-KD ALT+ NB cells following DOX induction for 48 h. GAPDH was loading control. The values below indicate the fold change in levels of METTL3. (B) Representative images from colony formation assay performed on CHLA-90 (top) and SK-N-FI (bottom) cells with TetO Control or METTL3-KD. (C) TERRA RNA-FISH in TetO Control and METTL3-KD SK-N-FI and CHLA-90 cells. Box plot shows the quantification of the TERRA foci in the indicated conditions. At least 70 cells were counted from three independent biological replicates. Unpaired t-test was used, *** P < 0.001. (D) Accumulation of γ-H2AX (red) over telomere after 48 h of DOX induction in SK-N-FI TetO METTL3-KD cells. Telomeres were detected by telomere DNA-FISH (green). Box plot shows the γ-H2AX intensity in telomeric foci (Arbitrary units, AU). At least 65 cells were counted from three independent biological replicates. Unpaired t-test was used, **** P < 0.0001. (E) Line graph showing average tumor growth (mm3) of SK-N-FI cells (TetO Control and METTL3-KD) derived xenografts over time. Data are shown as mean ± SD. Sidak's multiple comparisons test was used, **** P < 0.0001. (F) Scatter plot showing tumor weight post necropsies of xenografts derived from SK-N-FI cells with either TetO Control or METTL3-KD. Data are shown as mean ± SD. Unpaired t-test was used, * P < 0.05 (n = 4). One representative image of the tumor is shown per condition. (G) C-Circle assay results visualized on slot blot. C-Circle assay with/without Phi29 polymerase (Pol+/Pol-) performed with DNA isolated from SK-N-FI cells derived xenografts with either TetO Control or METTL3-KD. Box plots show the quantification of the blots, data are presented as signal/background. Unpaired t-test was used, * P < 0.05 (n = 4). (H) TERRA RNA-FISH detecting TERRA foci (green) in CHLA-90 (top panel) and SK-N-FI (bottom panel) cells treated with METTL3 inhibitors (10 μM STM2457, 50 μM UZH1A, and 50 μM UZH1B) for 6 h. DMSO treatment served as a control. Box plot showing quantification of the TERRA foci as indicated. At least 70 cells were counted from three independent biological replicates. Dunnett's multiple comparisons test was used, * P < 0.05; *** P < 0.001; **** P < 0.0001; ns - nonsignificant P> 0.05. (I) Cell viability was measured by MTT assay after treating ALT+, ALT– (NMA and non-NMA), and fibroblast cells with 10 μM of METTL3 inhibitor (STM2457) for 72 h. Data for each cell line were normalized to DMSO control. Data are shown as mean ± SD from three biological replicates. One-way ANOVA with Tukey's post hoc test was used, **** P < 0.0001. (J) Bar plot shows the percentage input values of γ-H2AX enrichment over selected telomere ends from ChIP qPCR data in DMSO and METTL3 inhibitor STM2457 treated SK-N-FI, SK-N-BE(2) and SK-N-AS cells. STM247 treatment was done for 72 h. Data are shown as mean ± SD from three independent biological replicates. Sidak's multiple comparisons test was used, **P < 0.01; *P < 0.05; ns – nonsignificant P> 0.05. (K) The model illustrates the role of METTL3-mediated TERRA m6A modification in telomere maintenance of ALT+ NB. TERRA is m6A modified at both UUAGGG repeats and at the subtelomeres, which recruits hnRNPA2B1. Elevated levels of METTL3/14 and TERRA m6A promote telomere maintenance in ALT+ NBs in an R-loop dependent manner. Elevated levels of METTL3/14 and TERRA m6A promote telomere maintenance in ALT+ NBs in an R-loop-dependent manner. In contrast, METTL3 depletion or inhibition in NBs results in reduced TERRA m6A levels, leading to compromised R-loop formation, decreased DNA C-Circle content, and an accumulation of telomere damage. The deficiency in telomere maintenance after METTL3 depletion leads to tumor regression.

Similar articles

Cited by

References

    1. Barbieri I., Kouzarides T. Role of RNA modifications in cancer. Nat. Rev. Cancer. 2020; 20:303–322. - PubMed
    1. Huang H., Weng H., Zhou K., Wu T., Zhao B.S., Sun M., Chen Z., Deng X., Xiao G., Auer F. et al. . Histone H3 trimethylation at lysine 36 guides m(6)A RNA modification co-transcriptionally. Nature. 2019; 567:414–419. - PMC - PubMed
    1. Patil D.P., Chen C.K., Pickering B.F., Chow A., Jackson C., Guttman M., Jaffrey S.R. m(6)A RNA methylation promotes XIST-mediated transcriptional repression. Nature. 2016; 537:369–373. - PMC - PubMed
    1. Yue Y., Liu J., Cui X., Cao J., Luo G., Zhang Z., Cheng T., Gao M., Shu X., Ma H. et al. . VIRMA mediates preferential m(6)A mRNA methylation in 3'UTR and near stop codon and associates with alternative polyadenylation. Cell Discov. 2018; 4:10. - PMC - PubMed
    1. Xu W., Li J., He C., Wen J., Ma H., Rong B., Diao J., Wang L., Wang J., Wu F. et al. . METTL3 regulates heterochromatin in mouse embryonic stem cells. Nature. 2021; 591:317–321. - PubMed