

The interrelationships between sleep regularity, obstructive sleep apnea, and hypertension in a middle-aged community population
- PMID: 38180870
- PMCID: PMC10925954
- DOI: 10.1093/sleep/zsae001
The interrelationships between sleep regularity, obstructive sleep apnea, and hypertension in a middle-aged community population
Abstract
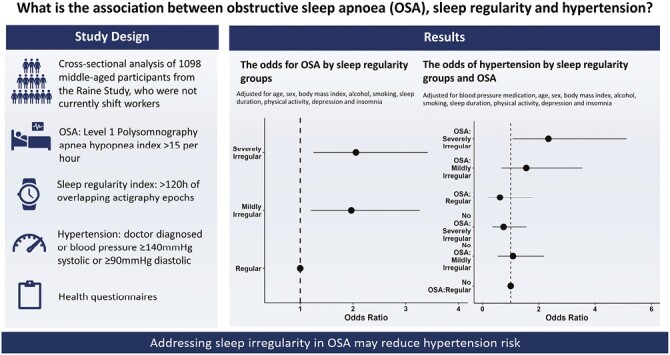
Study objectives: Little is known about the interrelationships between sleep regularity, obstructive sleep apnea (OSA) and important health markers. This study examined whether irregular sleep is associated with OSA and hypertension, and if this modifies the known association between OSA and hypertension.
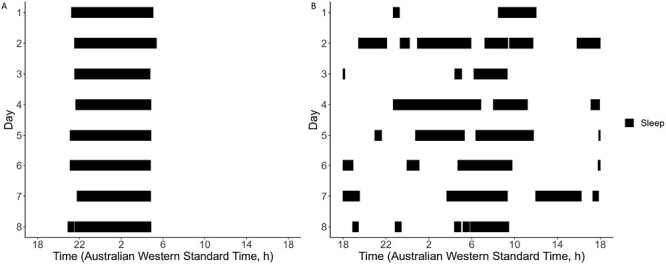
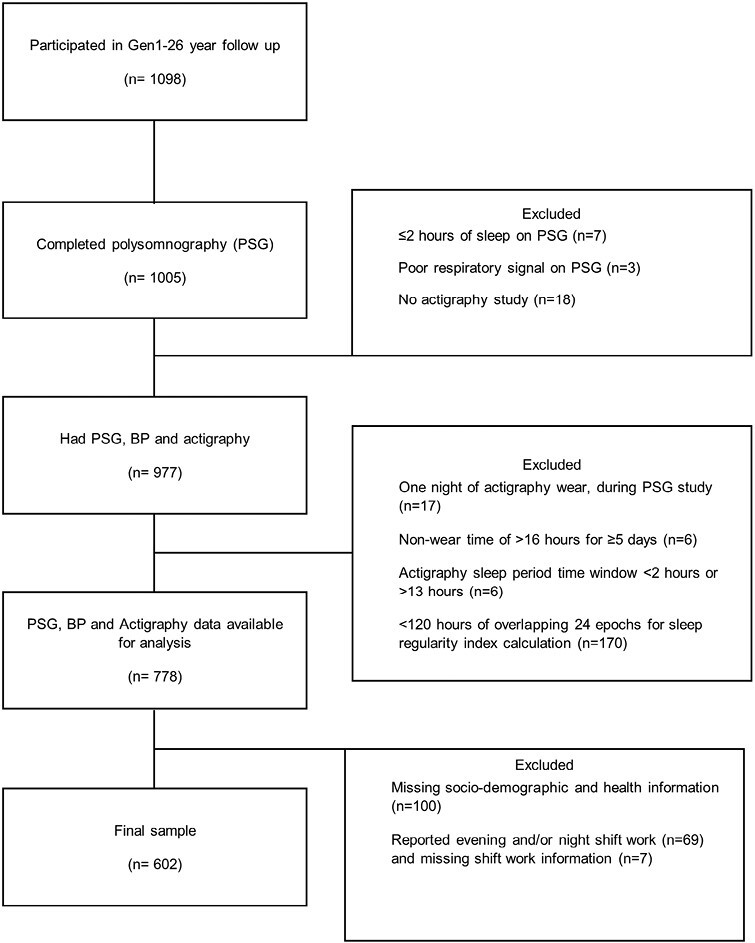
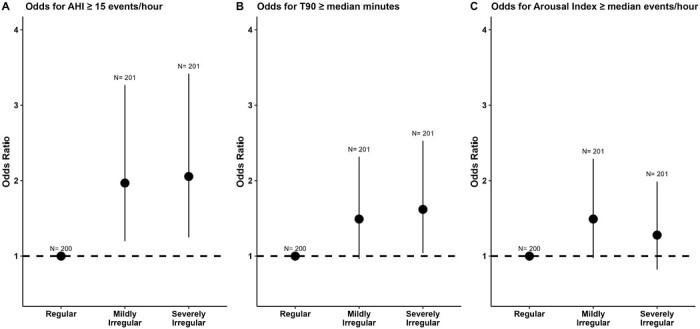
Methods: Six hundred and two adults (age mean(SD) = 56.96(5.51) years, female = 60%) from the Raine Study who were not evening or night shift workers were assessed for OSA (in-laboratory polysomnography; apnea-hypopnea index ≥ 15 events/hour), hypertension (doctor diagnosed, or systolic blood pressure ≥140 mmHg and/or diastolic ≥90 mmHg) and sleep (wrist actigraphy for ≥5 days). A sleep regularity index (SRI) was determined from actigraphy. Participants were categorized by tertiles as severely irregular, mildly irregular, or regular sleepers. Logistic regression models examined the interrelationships between SRI, OSA and hypertension. Covariates included age, sex, body mass index, actigraphy sleep duration, insomnia, depression, activity, alcohol, smoking, and antihypertensive medication.
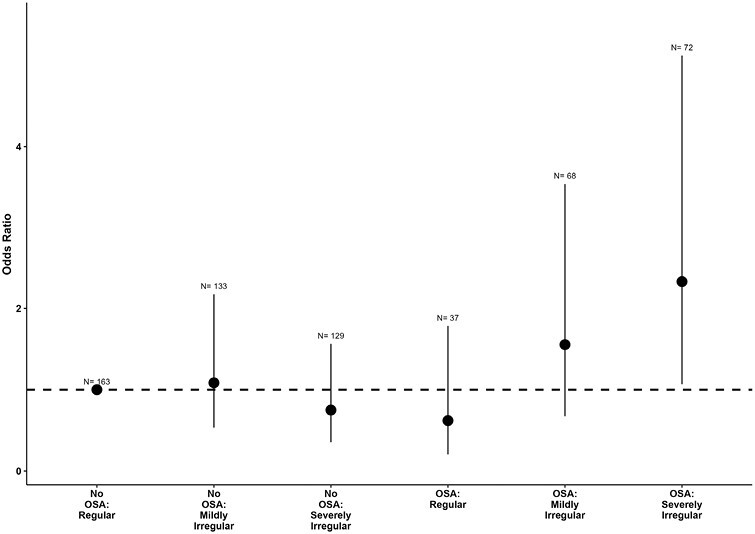
Results: Compared to regular sleepers, participants with mildly irregular (OR 1.97, 95% confidence intervals [CI] 1.20 to 3.27) and severely irregular (OR 2.06, 95% CI: 1.25 to 3.42) sleep had greater odds of OSA. Compared to those with no OSA and regular sleep, OSA and severely irregular sleep combined had the highest odds of hypertension (OR 2.34 95% CI: 1.07 to 5.12; p for interaction = 0.02) while those with OSA and regular/mildly irregular sleep were not at increased risk (p for interaction = 0.20).
Conclusions: Sleep irregularity may be an important modifiable target for hypertension among those with OSA.
Keywords: actigraphy; hypertension; obstructive sleep apnea; patterns; sleep regularity.
© The Author(s) 2024. Published by Oxford University Press on behalf of Sleep Research Society.
Figures
Similar articles
-
Association of Obstructive Sleep Apnea and Uncontrolled Hypertension in the Middle Aged 40-59 in Korean Population.J Korean Med Sci. 2025 Jun 23;40(24):e129. doi: 10.3346/jkms.2025.40.e129. J Korean Med Sci. 2025. PMID: 40551608 Free PMC article.
-
Effect of age on the association of obstructive sleep apnea with metabolic syndrome among obese and nonobese adults.J Clin Sleep Med. 2025 Aug 1;21(8):1371-1378. doi: 10.5664/jcsm.11698. J Clin Sleep Med. 2025. PMID: 40160006
-
Tonsillectomy or adenotonsillectomy versus non-surgical management for obstructive sleep-disordered breathing in children.Cochrane Database Syst Rev. 2015 Oct 14;2015(10):CD011165. doi: 10.1002/14651858.CD011165.pub2. Cochrane Database Syst Rev. 2015. PMID: 26465274 Free PMC article.
-
Drug therapy for obstructive sleep apnoea in adults.Cochrane Database Syst Rev. 2006 Apr 19;(2):CD003002. doi: 10.1002/14651858.CD003002.pub2. Cochrane Database Syst Rev. 2006. Update in: Cochrane Database Syst Rev. 2013 May 31;(5):CD003002. doi: 10.1002/14651858.CD003002.pub3. PMID: 16625567 Updated.
-
Rapid eye movement (REM)-related obstructive sleep apnea and hypertension: insights from the clinical spectrum of apnea-hypopnea index ratios across REM and non-REM sleep stages in a Chinese cohort.J Sleep Res. 2025 Aug;34(4):e14418. doi: 10.1111/jsr.14418. Epub 2024 Nov 27. J Sleep Res. 2025. PMID: 39604302
Cited by
-
Association between sleep duration and hypertension risk in patients with obstructive sleep apnea.NPJ Prim Care Respir Med. 2025 Apr 28;35(1):26. doi: 10.1038/s41533-025-00429-7. NPJ Prim Care Respir Med. 2025. PMID: 40295507 Free PMC article.
-
Obstructive sleep apnea severity varies by season and environmental influences such as ambient temperature.Commun Med (Lond). 2025 Jul 29;5(1):314. doi: 10.1038/s43856-025-01016-0. Commun Med (Lond). 2025. PMID: 40731164 Free PMC article.
-
Exploring nightly variability and clinical influences on sleep measures: insights from a digital brain health platform.Sleep Med. 2025 Jul;131:106532. doi: 10.1016/j.sleep.2025.106532. Epub 2025 Apr 22. Sleep Med. 2025. PMID: 40306226
-
Association between sleep regularity and arterial stiffness among middle-age adults in Southwestern China.BMC Public Health. 2024 Sep 17;24(1):2530. doi: 10.1186/s12889-024-20054-2. BMC Public Health. 2024. PMID: 39289652 Free PMC article.
-
Sleep Irregularity, Circadian Disruption, and Cardiometabolic Disease Risk.Circ Res. 2025 Aug 15;137(5):709-726. doi: 10.1161/CIRCRESAHA.125.325613. Epub 2025 Aug 14. Circ Res. 2025. PMID: 40811504 Review.
References
Publication types
MeSH terms
Grants and funding
LinkOut - more resources
Full Text Sources
Medical
