Time trends and geographical variation in major lower limb amputation related to peripheral arterial disease in England
- PMID: 38180913
- PMCID: PMC10768980
- DOI: 10.1093/bjsopen/zrad140
Time trends and geographical variation in major lower limb amputation related to peripheral arterial disease in England
Abstract
Background: Above and below knee amputation (AKA, BKA) are treatments of last resort for peripheral arterial disease (PAD). The aim was to examine amputation rates, AKA:BKA ratios, previous revascularization and minor amputation, lengths of stay in hospital, mortality following amputation, and regional variation in people with and without diabetes in England.
Methods: The study used population-based ecological and cohort study designs, 31 672 census areas, hospital admissions from 2006 to 2018 and Poisson, logistic and Cox regression.
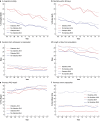
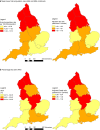
Results: There were 47 249 major lower limb amputations (50.7% AKA; 48% had diabetes), giving an annual PAD-related amputation rate of 11 per 100 000 in the population aged 25+ years. Amputation rates were higher in men and substantially higher in people with diabetes. The AKA:BKA ratio was 0.63 in patients with diabetes (n = 22 702) and 1.62 in patients without diabetes (n = 24 547). Of patients having AKA, 25.3% died within 90 days of amputation compared with 11.9% for BKA. Median survival following amputation ranged from only 1.68 years following AKA in patients with diabetes to 5.72 years following BKA in patients without diabetes. Amputation rates decreased over time mainly in the population with diabetes. Short-term mortality and lengths of stay in hospital also decreased over time, while the percentage with previous revascularization generally increased. Amputation rates and AKA:BKA ratios were highest in the North. Adjustment for age, sex and deprivation did not substantially alter geographical patterns. Adjusted 90-day mortality was generally higher in the North and the Midlands but also high in London. There were also regional variations in adjusted duration from admission to amputation, duration from amputation to discharge or death in hospital, previous revascularization and previous minor amputation.
Conclusions: There were large variations in amputation rates and survival following amputation in relation to diabetes status and amputation level, and regional variations which remained after adjustment for deprivation.
© The Author(s) 2024. Published by Oxford University Press on behalf of BJS Society Ltd.
Figures


References
-
- Moxey PW, Gogalniceanu P, Hinchliffe RJ, Loftus IM, Jones KJ, Thompson MM et al. Lower extremity amputations—a review of global variability in incidence. Diabet Med 2011;28:1144–1153 - PubMed
-
- Kolossváry E, Farkas K, Colgan MP, Edmonds M, Fitzgerald HP, Fox M et al. “No more amputations”: a complex scientific problem and a challenge for effective preventive strategy implementation on vascular field. Int Angiol 2017;36:107–115 - PubMed
-
- Holman N, Young RJ, Jeffcoate WJ. Variation in the recorded incidence of amputation of the lower limb in England. Diabetologia 2012;55:1919–1925 - PubMed
Publication types
MeSH terms
Grants and funding
LinkOut - more resources
Full Text Sources
Medical

