. 2024 Jan 5;9(91):eadi0672.
doi: 10.1126/sciimmunol.adi0672. Epub 2024 Jan 5.

A dynamic atlas of immunocyte migration from the gut

Affiliations

A dynamic atlas of immunocyte migration from the gut

Silvia Galván-Peña et al. Sci Immunol. .

Abstract

Dysbiosis in the gut microbiota affects several systemic diseases, possibly by driving the migration of perturbed intestinal immunocytes to extraintestinal tissues. Combining Kaede photoconvertible mice and single-cell genomics, we generated a detailed map of migratory trajectories from the colon, at baseline, and in several models of intestinal and extraintestinal inflammation. All lineages emigrated from the colon in an S1P-dependent manner. B lymphocytes represented the largest contingent, with the unexpected circulation of nonexperienced follicular B cells, which carried a gut-imprinted transcriptomic signature. T cell emigration included distinct groups of RORγ+ and IEL-like CD160+ subsets. Gut inflammation curtailed emigration, except for dendritic cells disseminating to lymph nodes. Colon-emigrating cells distributed differentially to distinct sites of extraintestinal models of inflammation (psoriasis-like skin, arthritic synovium, and tumors). Thus, specific cellular trails originating in the gut and influenced by microbiota may shape peripheral immunity in varied ways.


Conflict of interest statement

Competing interests: The authors declare that they have no competing interests.

Figures

Figure 1.
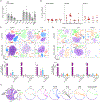
Figure 1.. Turnover of colon immunocytes at steady-state.
A) Representative flow cytometry plots of photoconversion proportions of B, T and MNPs in the descending colon in unconverted (control) mice versus 10min, 12hr, 24hr, 72hr post colonic photoconversion. B) Egress rates of cells photo-tagged in the descending colon, measured by flow cytometry (n=4–6 mice, from 3 or more independent experiments). Normalized to the average of time 0hr. C) Egress rates of cells within the IEL fraction photo-tagged in the descending colon, measured by flow cytometry (n=4–6, from three or more independent experiments, each datapoint represents a mouse) D) Proportions of photo-tagged B, αβ T and CD11c+ DCs left in the colon 24hr post-photoconversion, with and without pre-treatment with FTY720 (1mg/kg). Normalized to the average of time 0hr timepoints. Each datapoint represents a mouse, from three independent experiments E) Schematic of gut draining LNs. F) Percentage of migratory Kaede-red populations across individual mLNs, caLN and iLN, 24hr post-photoconversion of the descending colon, measured by flow cytometry (n=2–3 mice from two independent experiments). Error bars indicate mean ± SD; *p < 0.05, ****p < 0.0001, unpaired t test.
Figure 2.
Figure 2.. Immunocytes from the colon migrate into both lymphoid and non-lymphoid tissues.
A) Percentage of CD45+ migratory Kaede-red cells across tissues, measured by flow cytometry 24hr following colon photoconversion (n=4–8). B) Percentage of photo-tagged MNPs, B and T cells in the blood 12hr, 24hr, 48hr and 72hr post colonic photoconversion (n=4–9). C and D) Local (Kaede-green) immunologic populations compared to colon-origin (Kaede-red) cells in (C) BM, spleen, iLN, (D) lung, liver and kidneys post colonic photoconversion by high dimensional flow cytometry. tSNE of CD45+ cells built on CD11c, CD11b, F4/80, γδ TCR, αβ TCR, CD8, CD4, CD25, CD19 (pool of n=6). E) Chord diagrams depicting the numeric distribution of each Kaede-red population across all tissues examined (n=6 mice). All results are pooled from three independent experiments; except in the tSNE, each datapoint represents a mouse; error bars indicate mean ± SD.
Figure 3.
Figure 3.. Transcriptome of colon-derived B cells.
A) Single cell experiment schematic. Splenic cells were isolated from mice photoconverted at various points and sorted as CD45+ Kaede-green+ or CD45+ Kaede-red+, labelled with hashtag antibodies and sequenced in a single lane. Sample demultiplexing was performed computationally. B) scRNAseq analysis of total CD45+ cells in spleen. UMAP representation, color-coded by cell identity. C) UMAP representation of B cells selected from (B). Color coded by k-nearest neighbour (knn) cell clusters (total 8440 cells). D) Distribution of 24hr post-photoconversion Kaede-green vs Kaede-red cells across the UMAP in (C) (1194 Kaede-green cells, 2002 Kaede-red cells). E) Clustered heatmap of differentially expressed genes between Kaede-red and Kaede-green cells within the top four most migrant-enriched clusters from (D), across all three timepoints (355 genes, p < 0.01). F) Gene expression of selected markers across Kaede-green and Kaede-red cells (same plots as in D).
Figure 4.
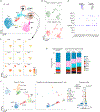
Figure 4.. Distinct colon-derived migratory T cell populations are found in the spleen.
A) UMAP representation of T cells selected from 3B. Color-coded by knn cell clusters (total 3500 cells). B) Same plot as in (A), with Kaede-green vs Kaede-red distribution 24hr post-photoconversion (782 Kaede-green cells, 852 Kaede-red cells). C) Gene expression of selected markers across the ‘Rorγ T’ and ‘CD160+ T’ clusters from (A). D) Differential marker genes for the CD160+ T cluster. E) Percentage quantification of the distribution of the Kaede-green and Kaede-red cells across clusters per timepoint. F) scRNAseq analysis of total CD45+ cells from cecum. UMAP representation, color-coded by cell identity (n=2) (left); Kaede red T cells projected onto the dataset from (F) UMAP (right).
Figure 5.
Figure 5.. Migratory ILC/NK populations found in the spleen.
A) UMAP representation of the ILC/NK cells selected from 3B. Color-coded by knn cell clusters (total 426 cells). B) Marker and differential gene expression for the CD27hi and CD27lo clusters from (A). C) Same plot as in (A), with kaede-green vs kaede-red distribution (309 Kaede-green cells, 117 Kaede-red cells). D) Representative flow cytometry plots and gating strategy of the ILC/NK populations in the spleen, 24hr post-photoconversion of the descending colon (left), together with quantification of the percentage of Kaede-red cells within each population (right) (Lin (lineage): CD11c, CD11b, CD3, CD19, γδ TCR, αβ TCR). Quantification pooled from three independent experiments (n=6 mice).
Figure 6.
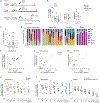
Figure 6.. Intestinal perturbations significantly alter systemic migration.
A) Experimental set-up for antibiotic-treated mice. B) Percentage of colon-origin Kaede red populations in the spleen and iLN, 24hr post-photoconversion of the descending colon in mice treated with an antibiotic cocktail for 10 days (VGCA, vancomycin, gentamycin, clindamycin and ampicillin). C) Proportions of immunocytes left in the colon in the same experimental setup as in (B) D) Experimental set-up for DSS-treated mice. E) Proportions of immunocytes left in the colon 24hr post-photoconversion in control mice (Ctl) as well as different stages of DSS-induced colitis. F) Percentage of colon-origin Kaede-red populations in the spleen in the same experimental setup as in (E). G) Representative flow cytometry plots of the CD11c+ population in the spleen and iLN of control mice (steady-state) vs mice on day 20 post initial DSS administration, 24hr post-photoconversion of the descending colon. H) Correlation between Kaede-red CD11c+ in iLN (y-axis) and Kaede-red CD11c+ in spleen (x-axis) (left) or Kaede-red CD11c+ in colon-draining lymph nodes (right) in control vs mice on day 20 post initial DSS administration, 24hr post-photoconversion of the descending colon. All results from two to four independent experiments. Each dot represents a mouse, error bars: mean ± SD *p<0.05; **p<0.01, ***p<0.001, unpaired t-test.
Figure 7.
Figure 7.. Immunocyte migration from the colon to distal diseased sites.
A) Experimental set-up for the KxB/N serum-transfer arthritis model, MC38 subcutaneous tumor model and the skin hypersensitivity DTH model. B) Proportions of immunocytes left in the colon 24hr post-photoconversion in control mice and mouse models of arthritis (KxB/N, day 10), MC38 tumors (day 11), and DTH (day 8) (n=6–12). C) Percentage of CD45+ cells 24hr post-photoconversion of the descending colon in the synovial fluid of KxB/N mice, MC38 tumors and the inflamed ear of DTH mice (n=6–12). D) Identity of the colon-derived immunocytes, as measured in (C). Each column represents a mouse. E, F, G) Mice examined 24hr post-photoconversion of the descending colon. Correlation between Kaede-red CD19+ B cells in the synovial fluid of KxB/N mice (y axis) and the spleen from the same mice (x axis) (n=11) (E); correlation between Kaede-red MNPs in MC38 tumors (y axis) and the spleen from the same mice (x axis) (n=12) (F); correlation between Kaede-red Tconv (CD4+ CD25) in the inflamed ear of DTH mice (y axis) and the spleen from the same mice (x axis) (n=6) (G). H) Percentage of colon-derived Kaede-red cells in MC38 tumors of antibiotic-treated mice (11 days, VGCA), 24hr post-photoconversion of the descending colon. Data normalized to the average of each control (n=3–7). I) Percentage of colon-derived Kaede-red cells in MC38 tumors of mice pre-treated with anti-CXCR3 (250μg/mouse) and anti-CCL2 (250μg/mouse) antibodies, 24hr post-photoconversion of the descending colon. Data normalized to the average of each control (n=5–7). All results from two to four independent experiments. Each dot represents a mouse, mean is marked. *p<0.05; **p<0.01, unpaired t-test.

References

    1. Wu H-J, Wu E, The role of gut microbiota in immune homeostasis and autoimmunity. Gut Microbes. 3, 4–14 (2012). - PMC - PubMed
    1. Zheng D, Liwinski T, Elinav E, Interaction between microbiota and immunity in health and disease. Cell Res. 30, 492–506 (2020). - PMC - PubMed
    1. Ruff WE, Greiling TM, Kriegel MA, Host-microbiota interactions in immune-mediated diseases. Nat Rev Microbiol. 18, 521–538 (2020). - PubMed
    1. Wu HJ, Ivanov II, Darce J, Hattori K, Shima T, Umesaki Y, Littman DR, Benoist C, Mathis D, Gut-residing segmented filamentous bacteria drive autoimmune arthritis via T helper 17 cells. Immunity. 32, 815–827 (2010). - PMC - PubMed
    1. Lee YK, Menezes JS, Umesaki Y, Mazmanian SK, Proinflammatory T-cell responses to gut microbiota promote experimental autoimmune encephalomyelitis. Proc Natl Acad Sci U S A. 108 Suppl 1, 4615–4622 (2011). - PMC - PubMed

Publication types