. 2024 Jan 5;9(91):eadh0152.
doi: 10.1126/sciimmunol.adh0152. Epub 2024 Jan 5.

Regulatory T cells in skin mediate immune privilege of the hair follicle stem cell niche

Affiliations

Regulatory T cells in skin mediate immune privilege of the hair follicle stem cell niche

Jarish N Cohen et al. Sci Immunol. .

Abstract

Immune tolerance is maintained in lymphoid organs (LOs). Despite the presence of complex immune cell networks in non-LOs, it is unknown whether self-tolerance is maintained in these tissues. We developed a technique to restrict genetic recombination to regulatory T cells (Tregs) only in skin. Selective depletion of skin Tregs resulted in T cell-mediated inflammation of hair follicles (HFs). Suppression did not rely on CTLA-4, but instead on high-affinity interleukin-2 (IL-2) receptor expression by skin Tregs, functioning exclusively in a cell-extrinsic manner. In a novel model of HF stem cell (HFSC)-driven autoimmunity, we reveal that skin Tregs immunologically protect the HFSC niche. Finally, we used spatial transcriptomics to identify aberrant IL-2 signaling at stromal-HF interfaces in a rare form of human alopecia characterized by HFSC destruction and alopecia areata. Collectively, these results reveal the fundamental biology of Tregs in skin uncoupled from the systemic pool and elucidate a mechanism of self-tolerance.


Conflict of interest statement

Competing interests: M.D.R. is a consultant and co-founder of TRex Bio Inc., Sitryx Bio Inc., and Radera Bio Inc. He is also a consultant for Mozart Bio Inc. J.N.C. is a consultant for TRex Bio Inc and Radera Bio Inc. All other authors declare no competing interests.

Figures

Figure 1.
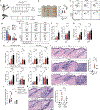
Figure 1.. Natural life history of Tregs in skin revealed by localized fate-mapping.
A. Representative photo of a mouse with dorsal back skin shaved in a “mohawk” configuration. B. Experimental schematic in which Foxp3tdTomato mice were treated topically for 5 consecutive days with 4OHT on one side of shaved skin or vehicle control (acetone) on the contralateral side, and organs were harvested 2 days after the last treatment. C. Representative flow cytometry plots and quantification of % tdTomato+ of Tregs (live CD45+ TCRβ+ CD4+ CD8− Foxp3-GFP+) from the indicated organs following topical 4OHT or vehicle control treatment. SDLN- skin draining lymph node, MLN- mesenteric lymph node. D. Representative medium-power images of tissue sections from the indicated organs following the treatment regimen outlined in (B) (bar = 50 μm); quantification of # tdTomato+ cells per high powered field (HFP). E. Experimental schematic which Foxp3tdTomato mice were treated topically for 5 consecutive days with 4OHT on shaved skin and skin was harvested at the indicated time points. F, G. Representative flow cytometry plots (F) and quantification (G) of % tdTomato+ of skin Tregs at the indicated time points. Statistics were calculated as a comparison to the day 0 timepoint. H. Quantification of # tdTomato+ cells per high powered field (HFP) in skin sections from the indicated time points. Data in C and D are representative of two independent experiments with similar results. Data in F, G, and H are pooled from two independent experiments. Results are shown as individual data points and mean +/− s.e.m (C) or individual data points and mean (D, G, H). Statistics are calculated by one-way ANOVA with Tukey’s test for multiple comparisons. ***p < 0.001, ****p < 0.0001.
Figure 2.
Figure 2.. Skin regulatory T cells suppress hair follicle-associated inflammation.
A. Experimental schematic in which Foxp3iDTA mice were treated for 5 consecutive days with 4OHT on one side of shaved back skin and vehicle control (acetone) on the contralateral side and every three days thereafter for 4 weeks. A separate group of Foxp3iDTA mice were treated with intraperitoneal injection of Tamoxifen every three days for 4 weeks. Skin and skin draining lymph nodes (SDLN) were harvested at 4 weeks. B. Representative photo of SDLN (axLN: axillary, brLN: brachial, ingLN: inguinal) from Foxp3iDTA mice that underwent the indicated treatments; bar= 2 mm (left). Quantification of ingLN length measurements (right). C, D. Representative flow cytometry plots and quantification of % Tregs. E, F. Representative flow cytometry plots and quantification of # CD8+ T cells. G. Quantification of # Teffs (CD4+ Foxp3−). H. Quantification of pro-inflammatory cytokine production by CD8+ T cells and Teffs in skin and SDLN of Foxp3iDTA mice (interferon-γ: IFNγ, tumor necrosis factor-α: TNFα). I. Representative photomicrographs of dorsal back skin histology sections of Foxp3iDTA mice that underwent the indicated treatment (bar= 50 μm); inset: higher magnification of hair follicle (bar= 20 μm), and quantification of # foci of hair follicle-associated inflammation (folliculitis). J. Quantification of # CD8+ T cells in skin. Mice underwent the topical treatment regimen as depicted in (A) and were concurrently treated with intraperitoneal injections of control IgG or anti-CD8 depleting antibody every 5 days. K. Representative photomicrographs of histology during the indicated treatment conditions (bar = 50 μm), and quantification of # folliculitis foci in skin under the indicated treatment conditions. Data in B-K are representative of two independent experiments with similar results. Results are shown as individual data points and mean (B, I, K), individual data points and mean +/− s.e.m (D, F, G, H), or paired data points (J). Statistics are calculated by one-way ANOVA with Tukey’s test for multiple comparisons (B, D, F, and H (Tam comparison), and I), two-way ANOVA (J and K: 4OHT vs. 4OHT comparison), and paired two-tailed Student’s t-test (B, D, F-H, K (ctrl vs. 4OHT comparison)). *p < 0.05, **p < 0.01, ***p < 0.001, ****p <0.0001, ns = not significant.
Figure 3.
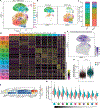
Figure 3.. Skin Tregs exhibit a heightened immunoregulatory gene signature.
(A to F and H) scRNAseq of sort-purified Tregs (gating: live CD45+ TCRβ+ CD4+ CD8 GFP+ cells) from dorsal back skin and SDLNs of adult Foxp3-CreERT2-GFP mice. (A and B) Unsupervised clustering of combined (A) and separate skin and SDLN Treg scRNAseq data (B). (C) Graphical summary of the frequency of Tregs in each cluster according to tissue. (D) Heatmap displaying the top 10 differentially expressed (DE) genes for each cluster when comparing clusters 1 to 11 (ranked by fold change). (E) Heatmap of select genes involved in immune tolerance/immunoregulation. (F) Feature plot displaying the immune regulatory gene signature in combined skin and SDLN scRNAseq data. (G) Violin plot of the immune regulatory gene signature split by tissue. (H) Violin plots of the immune regulatory gene signature in each individual cluster split by tissue type. Horizontal triangle in grayscale denotes decreasing expression score moving left to right. Data are representative of one experiment (A to H). Statistics were calculated by unpaired Wilcoxon rank sum test of SDLN Tregs pooled from two mice and skin Tregs pooled from four mice (G). ****P < 0.0001.
Figure 4.
Figure 4.. CTLA-4 expression on skin Tregs is dispensable for immune homeostasis.
(A) Feature plots of Ctla4 gene expression in skin and SDLN Tregs. Dashed oval indicates relative location of cluster 4 (Fig. 3A). (B) Representative flow cytometry plots and quantification of the frequency and expression level of CTLA-4 on skin and SDLN Tregs.(C) Experimental schematic in which Foxp3ΔCTLA−4 mice were treated for five consecutive days with 4OHT on one side of shaved back skin and vehicle control (acetone) on the contralateral side and every 2 days thereafter for 4 weeks. A separate group of Foxp3ΔCTLA−4 mice was treated with intraperitoneal injection of tamoxifen every 3 days for 4 weeks. Skin and SDLNs were harvested at 4 weeks. (D) Representative flow cytometry plots and quantification of % CTLA-4+ Tregs and mean fluorescence intensity (MFI) of CTLA-4 expression on Tregs. (E) Representative flow cytometry plots and gating of CD8+ T cells, Teffs, and Tregs and quantification of the frequency of Tregs. (F) Quantification of number of Teffs and CD8+ T cells. (G) Quantification of proinflammatory cytokine production by CD8+ T cells and Teffs in skin. (H) Quantification of MFI of CD80, CD86, and MHCII expression on DCs (live CD45+ TCRβ CD3ε MHCII+ CD64 CD11c+) or macrophages (Macs; live CD45+ TCRβ CD3ε MHCII+ CD64+ CD11c). (I) Representative photomicrographs of dorsal back skin histology sections of Foxp3ΔCTLA−4 mice that underwent the indicated topical treatment (scale bar, 50 μm) and quantification of the number of foci of HF-associated inflammation (folliculitis). Data in (A) to (I) are representative of two independent experiments with similar results. Results are shown as individual data points and mean ± SEM (B, D, and H), paired data points (E to G), or individual data points and mean (I). Statistics were calculated by unpaired two-tailed Student’s t test (B and I), paired two-tailed Student’s t test (D to H; ctrl versus 4OHT comparison), or one-way ANOVA with Tukey’s test for multiple comparisons (D; Tam comparison). *P < 0.05, ***P <0.001, and ****P < 0.0001. ns, not significant.
Figure 5.
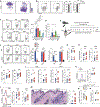
Figure 5.. CD25 expression on skin Tregs restrains hair follicle-associated inflammation.
(A) Feature plots of Il2ra gene expression in skin and SDLN Tregs. (B) Representative flow cytometry plots and quantification of the frequency and expression level of CD25 on skin and SDLN Tregs. (C and D) Representative flow cytometry plots and quantification of % and number of IL-2 expression in lymphocyte subsets from skin of IL-2–GFP reporter mice. IL-2–GFP+ gates were set according to wild-type C57Bl/6 controls. (E) Experimental schematic in which Foxp3ΔCD25 mice were treated for five consecutive days with 4OHT on one side of shaved back skin and vehicle control (acetone) on the contralateral side and every 2 days thereafter for 4 weeks. A separate group of mice was treated with intraperitoneal injection of tamoxifen every 3 days for 4 weeks. Skin and SDLNs were harvested at 4 weeks. (F) Representative flow cytometry plots and quantification of % CD25+ Tregs and mean fluorescence intensity (MFI) of CD25 expression on Tregs. (G and H) Quantification of # Tregs, Teffs, and CD8+ T cells. (I) Quantification of the proliferation index (% Ki-67+) of Teffs and CD8+ T cells. (J) Quantification of proinflammatory cytokine production by Teffs and CD8+ T cells. (K) Representative flow cytometry histogram plot and quantification of Foxp3 MFI in skin Tregs. (L) Representative flow cytometry histogram plots and quantification of pSTAT5 MFI in skin Teffs and CD8+ T cells. (M) Representative photomicrographs of dorsal back skin histology sections of Foxp3ΔCD25 mice that underwent the indicated topical treatment (scale bar, 50 μm) and quantification of number of foci of hair follicle–associated inflammation (folliculitis). (N and O) Ubiq-CreERT2 × IL-2fl/fl mice were shaved in a mohawk configuration and treated with topical 4OHT or vehicle control for 4 weeks as in (C). (N) Quantification of # Tregs in skin. (O) Quantification of Foxp3 MFI in skin Tregs. Data in (A) to (L) are representative of two independent experiments with similar results. Data in (M) to (O) show pooled data from two independent experiments. Results are shown as individual data points and mean ± SEM (B, C, D, and F), paired data points (G to L, N, and O), or individual data points and mean (M). Statistics were calculated by unpaired two-tailed Student’s t test (B and M), paired two-tailed Student’s t test (F to L, N, and O; ctrl versus 4OHT comparison), or one-way ANOVA with Tukey’s test for multiple comparisons [C, D, and E; Tam comparison (F)]. *P < 0.05, **P < 0.01, ***P < 0.001, and ****P < 0.0001. ns, not significant.
Figure 6.
Figure 6.. Skin Tregs restrain autoimmune attack of hair follicle stem cells.
A. Schematic and model of experimental timeline in which bone marrow from Foxp3iDTA donor mice was transferred to irradiated OVA-expressing Lgr5iOVA recipients. Lgr5iOVA mice were treated with Tamoxifen intraperitoneally (i.p.) for two consecutive days to induce OVA in bulge hair follicle stem cells (HFSCs), followed by irradiation and transfer of 1 × 10⁷ Foxp3iDTA bone marrow cells. Following bone marrow reconstitution, chimeric mice underwent adoptive transfer of 1 × 10⁶ OT-I T cells (CD45.1+). One week after OT-I T cell transfer, mice were shaved in a mohawk configuration and topical 4OHT or vehicle was applied for 5 consecutive days. Skin and skin draining lymph nodes (SDLN) were harvested 2 days thereafter. B. Quantification of the mean fluorescence intensity (M.F.I.) of GFP expression in Lgr5+ cells (gated on live, CD45−, Sca-1- EpCAMint CD34+) from Lgr5iOVA mice that were treated with the Tamoxifen and 4OHT regimen and harvested on day 14 as described in (A). C. Representative flow cytometry plots and quantification of % skin Tregs. D. Representative flow cytometry plots and quantification of % skin OT-I T cells. E, F. Representative flow cytometry plots and quantification of % Ki-67 and CD25 of OT-I T cells. G. Quantification of interferon-γ (IFNγ) and tumor necrosis factor-α (TNFα) producing skin OT-I T cells. H, I. Representative flow cytometry plots and quantification of % and # of Lgr5-GFP+ HFSCs. J. Quantification of M.F.I. of GFP in Lgr5+ cells. K. Representative medium- and high-powered views from photomicrographs of dorsal back skin histology sections of chimeric mice; bar= 50 μm (left panels) and 20 μm (right panels). Arrowheads indicate apoptotic bulge keratinocytes and arrows indicate intraepithelial bulge lymphocytes. L. Quantification of # foci of bulge-associated inflammation, intraepithelial (IE) bulge lymphocytes, and apoptotic bulge keratinocytes. M-P. Experimental results utilizing Foxp3ΔCD25 → Lgr5iOVA chimeric mice with quantification of % CD25 on skin Tregs (M), # skin epithelial OT-I T cells (N), GFP M.F.I. in Lgr5-GFP+ cells (O), and foci of bulge-associated inflammation (P). Data in A-L are representative of two independent experiments with similar results. Data in M-P shows pooled data from two independent experiments. Results are shown as individual data points and mean +/− s.e.m (B), paired data points (C-G, I-J, and M-O) or individual data points and mean (L, P). Statistics are calculated by paired two-tailed Student’s ttest (C-G, I-J, and M-O), or unpaired two-tailed Student’s t-test (L, P). **p < 0.01, ***p <0.001, ****p <0.0001, ns = not significant.
Figure 7.
Figure 7.. Human autoimmune alopecia demonstrates a heightened IL-2 signaling gene signature around hair follicles.
A, E. Medium-power photomicrographs of hematoxylin and eosin (H&E) stained tissue sections representative of regions of pathology in human scarring alopecia (SA), alopecia areata (AA) and corresponding regions in healthy scalp skin (HS) as denoted by the dashed boxes in Figure S9B and S10A. In (A), arrowheads indicate lymphocytic inflammation around hair follicles, and asterisks indicate perifollicular fibrosis. In (E), arrowheads indicate lymphocytic inflammation around hair follicles, and asterisks indicate involutional hair follicles. Bar = 50 μm. B, F. Medium-power images of spatial transcriptomic (ST) feature plots of the IL2-STAT5 pathway, and CD8 and Treg gene signatures superimposed on the corresponding H&E images in (A) and (E). C, H. Unsupervised clustering of ST data from two samples of SA and two samples of HS, and two samples of AA and two samples of HS as demonstrated in Figure S9C and S10B. D, I. Feature plots of SA, AA, and HS spatial transcriptomic data displaying the IL2-STAT5 pathway, and CD8 T cell and Treg gene signatures. E, J. Violin plots of the IL2-STAT5 pathway in ST clusters representative of microanatomic stromal niches in diseased and healthy skin. Bar represents mean. Horizontal triangle in greyscale denotes decreasing expression score moving left to right. Data are representative of one independent 10X Visium capture area each for the scarring alopecia TMA sample and the alopecia areata TMA sample.

References

    1. Kyewski B, Klein L, A Central Role for Central Tolerance. Annual Review of Immunology. 24, 571–606 (2006). - PubMed
    1. Anderson MS, Venanzi ES, Klein L, Chen Z, Berzins SP, Turley SJ, von Boehmer H, Bronson R, Dierich A, Benoist C, Mathis D, Projection of an immunological self shadow within the thymus by the aire protein. Science. 298, 1395–1401 (2002). - PubMed
    1. Gallegos AM, Bevan MJ, Central tolerance: good but imperfect. Immunol Rev. 209, 290–296 (2006). - PubMed
    1. Mueller DL, Mechanisms maintaining peripheral tolerance. Nat Immunol. 11, 21–27 (2010). - PubMed
    1. Krishnamurty AT, Turley SJ, Lymph node stromal cells: cartographers of the immune system. Nat Immunol. 21, 369–380 (2020). - PubMed

Publication types