. 2024 Jan 4;31(1):106-126.e13.
doi: 10.1016/j.stem.2023.12.002.

Mechanosensitive hormone signaling promotes mammary progenitor expansion and breast cancer risk

Affiliations

Mechanosensitive hormone signaling promotes mammary progenitor expansion and breast cancer risk

Jason J Northey et al. Cell Stem Cell. .

Abstract

Tissue stem-progenitor cell frequency has been implicated in tumor risk and progression, but tissue-specific factors linking these associations remain ill-defined. We observed that stiff breast tissue from women with high mammographic density, who exhibit increased lifetime risk for breast cancer, associates with abundant stem-progenitor epithelial cells. Using genetically engineered mouse models of elevated integrin mechanosignaling and collagen density, syngeneic manipulations, and spheroid models, we determined that a stiff matrix and high mechanosignaling increase mammary epithelial stem-progenitor cell frequency and enhance tumor initiation in vivo. Augmented tissue mechanics expand stemness by potentiating extracellular signal-related kinase (ERK) activity to foster progesterone receptor-dependent RANK signaling. Consistently, we detected elevated phosphorylated ERK and progesterone receptors and increased levels of RANK signaling in stiff breast tissue from women with high mammographic density. The findings link fibrosis and mechanosignaling to stem-progenitor cell frequency and breast cancer risk and causally implicate epidermal growth factor receptor-ERK-dependent hormone signaling in this phenotype.

Keywords: RANK; RANKL; breast cancer risk; extracellular matrix stiffness; integrin signaling; mammary progenitor cells; mammographic density; mechanobiology.


Conflict of interest statement

Declaration of interests The authors declare no competing interests.

Figures

Figure 1.
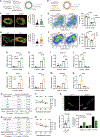
Figure 1.. Extracellular matrix stiffness associates with frequency of mesenchymal human mammary epithelial progenitor cells
(A) Cartoon: human breast tissue with low and high mammographic density (MD). (B) (left) Representative plots showing FACS analysis of human breast tissues (n=7; low MD, n=22; high MD, biological replicates). (right) Graph illustrating average percentage of mature luminal (ML), luminal progenitor (LP) and basal MECs. (C) FACS isolated (n=7; low MD, n=22; high MD, biological replicates) LP and Basal MECs were subjected to colony formation assays in rBM to assess progenitor activity. Graph includes all technical repeats and shows average colonies/1000 cells. (D) (left) Immunohistochemistry of low MD and high MD (n=5 biological replicates) breast tissues with ALDH antibody. Nuclei are counterstained with hematoxylin. Scale bar, 50 μm. (right) Graph shows average percent positive ALDH staining/cell area. (E-G) qRT-PCR analysis of relative gene expression (normalized to Krt8) for the indicated genes in human breast tissues (n=11; low MD, n=10; high MD, biological replicates). (H) Correlation matrix comparing individual patient values for the qRT-PCR analyses from (E-G). Red-to-blue scale indicates negative-to-positive Pearson correlation (n=21). (I and J) (left) Representative immunofluorescence images of human breast tissues stained for collagen (CNA-35, red) and nuclei (DAPI, blue), (center left) ZEB1 (I) or SLUG (J). (center right) Predicted matrix elasticity “collagen paint” (STIFMap, viridis) and (right) an overlay of STIFMap and ZEB1 or SLUG staining. Scale bar, 20 μm. (K and L) Scatterplots of STIFMap intensity (log (Epredicted)) versus ZEB1 (K) or SLUG (L) stain intensity for each pixel in (I and J) indicating the 99th percentile of stain intensity for each STIFMap percentile. (M and N) Violin plots of the Spearman correlation for each field-of-view comparing the 99th percentile of ZEB1 (M) or SLUG (N) staining intensity versus percentiles of collagen stain intensity, predicted elasticity, or DAPI stain intensity. Internal bars indicate a Box-plot with median and interquartile range (n=5–6 biological replicates; 17 individual regions). Graphs are represented as mean +/− S.E.M with the exception of K and N as indicated. Statistical tests used were 2-way ANOVA with Tukey’s multiple comparisons test (B, C), unpaired t-test (D-G), Pearson’s correlation (H), Wilcoxon signed-rank test (* in red, K, N) and Mann-Whitney test (K, N), *P<0.05, **P<0.005, ***P<0.0005, ns=non-significant.
Figure 2.
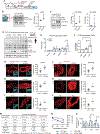
Figure 2.. Mechanosignaling in luminal mammary epithelial cells fosters stem/progenitor activity
(A) (left) Representative immunofluorescence for human breast tissues (n=6 biological replicates each; low and high MD) with antibodies to active β1-integrin (red), Keratin 18 (K18, green) and Keratin 14 (K14, magenta). Nuclei are stained with DAPI (cyan). Scale bar, 50 μm. (right) Graph shows average percentage of positive active β1-integrin staining/epithelial cell area. (B) Cartoons illustrating control mice (CTLM) and mice expressing V737N-β1-integrin (V737NM) with the predicted V737N-expression in a ductal cross-section (blue). (C) (left) Representative H&E-stained mammary gland wholemounts. Scale bar, 400 μm. (middle and right) Graphs showing the average number and size of terminal end buds (TEBs) (CTLM; n=3–5, V737NM; n=4–9 biological replicates). Asterisks indicate TEBs. (D) Graphs showing average tertiary ductal branches observed for CTLM and V737NM mice at 6-(left) and 10- (right) weeks of age (n=5–9 biological replicates). (E) (left) Representative H&E-stained mammary gland sections from 10-week-old mice. Scale bars, 50 μm. White double-sided arrows demarcate basal MEC layer thickness (inset). (right) Graph shows average thickness of the basal/myoepithelial layer (CTLM and V737NM; n=3 biological replicates). (F) Representative immunofluorescence of luminal and basal cytokeratins (K8; green and K14; red) for mammary glands from CTLM and V737NM mice (n=5 biological replicates each) at 6-(left) and 10- (center right) weeks of age. White double-sided arrows demarcate K14-positive basal layer thickness. Scale bar, 50 μm. Graphs show average thickness of K14-postive layers for mice at 6- (center left) and 10- (right) weeks of age. (G) (left) Representative FACS of mammary epithelial lineages. (right) The average percentages of luminal and basal populations are plotted (CTLM; n=4, V737NM; n=3 biological replicates). (H-K) RNA was isolated from luminal and basal MECs sorted from CTLM and V737NM mice (n=4–6 biological replicates). Graphs show relative expression for the indicated genes. (L and M) MECs sorted as in (G) were subjected to primary and secondary rBM colony formation assays (n=8; primary colony, n=4; secondary colony, biological replicates). (M) shows secondary colony formation in the presence of vehicle (DMSO) or FAK-inhibitor (FAKi; PND1186). (N) Limiting dilution transplantation assays were performed with basal (CD24+; CD49fhi) MECs sorted as in (G). (right) Representative images of carmine alum-stained epithelial transplants. Scale bar, 2 mm. O) The data from (N) plotted as percentage of mammary gland repopulating events (take rate) against transplanted cell number. (P) A comparison of the extent of fat pad repopulation from (N) at each transplanted cell number. Graphs are represented as mean +/− S.E.M. Statistical tests used were unpaired t-test (A, C, D-F), 2-way ANOVA with Tukey’s multiple comparisons test (G-M, P) and score test for differences in stem cell frequencies (N and O), *P<0.05, **P<0.005, ***P<0.0005, ns=non-significant.
Figure 3.
Figure 3.. Mechanosignaling in basal mammary epithelial cells and increased stromal collagen density foster stem/progenitor activity
(A) Cartoons illustrating control mice (CTLK5) and mice expressing V737N-β1-integrin (V737NK5) with the predicted V737N-expression in a ductal cross-section (green). (B) Cartoons illustrating wildtype (WT) and Collagenase-resistant Collagen I-expressing mice (COL) with increased ECM density around mammary epithelial ducts (orange). (C and D) (left) Representative immunofluorescence of luminal and basal cytokeratins (K8; green and K14; red) for mammary glands from CTLK5 and V737NK5 mice (C, n=5 biological replicates each) at 12-weeks of age and WT and COL mice (D, n=5 biological replicates each) at 10-weeks of age. Scale bar, 20 μm. (right) White double-sided arrows indicate K14-positive basal layer thickness. Graphs show the average thickness of K14-postive layers for the indicated mice. (E and F) (left) Representative FACS for mammary epithelial lineages from CTLK5 and V737NK5 mice (E) and WT and COL mice (F). (right) The average percentages of luminal and basal epithelial populations are plotted (n=5 biological replicates each). (G-J) RNA was isolated from MECs sorted as in (E) from CTLK5 and V737NK5 mice (n=3–4 biological replicates). Graphs showing relative expression for the indicated genes are displayed. (K-N) RNA was isolated from WT and COL mice as in (G-J) (n=3–4 biological replicates). Graphs showing relative expression for the indicated genes are displayed. (O) Limiting dilution transplantation assays (LDTAs) were performed with basal (CD24+; CD49fhi) MECs sorted from CTLK5 and V737NK5 mice. Stem cell frequency was calculated from the number of mammary gland repopulating events. (P) The data from (O) plotted as percentage of mammary gland repopulating events (take rate) against the transplanted cell number. (Q) LDTAs were performed for WT and COL mice as in (O). (R) The data from (Q) plotted as in (P). (S) Tamoxifen inducible lineage tracing of MECs in CTLK5 and V737NK5 mammary glands (n=3 biological replicates each). (top) Representative images of mammary glands 16-weeks post tamoxifen induction. Scale bar, 50 μm. Frequency of distinct fluorescent clones per ductal region (bottom left) and the relative percentage of single cell, two-cell, and multicellular clones (bottom right) are represented as bar plots. Graphs are represented as mean +/− S.E.M. Statistical tests used were unpaired t-test (C, D and S), 2-way ANOVA with Šídák’s multiple comparisons test (E, F), 2-way ANOVA with Tukey’s multiple comparisons test (G-N) and score test for differences in stem cell frequencies (O-R), *P<0.05, **P<0.005, ***P<0.0005, ns=non-significant.
Figure 4.
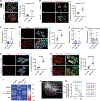
Figure 4.. Mechanosensitive mammary stem-progenitor cell expansion is driven by hormone-induced RANK signaling
(A) Cartoon: cytology used to determine stages of the estrus cycle (E2=estrogen; P4=progesterone) in mice prior to FACS-mediated isolation of MECs for RNA extraction and qRT-PCR. (B-G) Graphs showing qRT-PCR analysis of relative gene expression for the indicated genes using cells sorted as in (A) (n=3–4 biological replicates). (H) Cartoon: P4 stimulates progesterone receptor (PR)-mediated transcription of paracrine factors, RANKL and WNT4, to stimulate NFκB activity and MEC proliferation. (I) Whole mammary gland lysates were subjected to ELISA to measure RANKL levels (CTLM; n=3, V737NM; n=4 biological replicates). (J) Graph showing qRT-PCR analysis of gene expression for Tnfsf11 (Rankl) in MECs sorted as in (A) (n=3–4 biological replicates). (K) (left) Representative immunofluorescence of mammary gland tissues (n=6 biological replicates each, CTLM and V737NM) with antibodies specific for RANKL (red), Keratin 8 (K8, green) and Keratin 14 (K14, magenta). Nuclei are stained with DAPI (blue, inset). Scale bars, 50 μm. (right) Graph shows average percentage of positive RANKL staining/MEC area. (L and M) Graphs showing qRT-PCR analysis of gene expression for Ccnd1 (L) and Rspo1 (M) in MECs sorted as in (A) (n=3 biological replicates). (N and O) (left) Representative immunofluorescence of mammary gland tissues and quantification as in (K) for CTLK5 and V737NK5 mice (N, n=7 biological replicates each) and WT and COL mice (O; n=6 biological replicates each). MECs were isolated by FACS from CTLM and V737NM mice that were treated with RANK:Fc or Murine:Fc (Mu:Fc). Representative FACS plots are shown and the average percentage of luminal and basal MECs are plotted (n=2–3 biological replicates). (Q) Limiting dilution transplantation assays (LDTAs) were performed with basal (CD24+; CD49fhi) MECs sorted from CTLM and V737NM mice treated as in (P). Stem cell frequency was calculated from the number of mammary gland repopulating events. Data not noted: CTL Mu:Fc vs. V737NM R:Fc, P = 0.0143. (R) The data from (Q) plotted as percentage of mammary gland repopulating events (take rate) against transplanted cell number. (S) A comparison of the extent of fat pad repopulation from (Q) at each transplanted cell number. (T) LDTAs were performed and analyzed as in (Q) for WT and COL mice. Data not noted: COL Mu:Fc vs. WT R:Fc, P = 0.0152, and COL Mu:Fc vs. COL R:Fc, P = 0.00157. (U and V) The data from (T) plotted as in (R and S). Graphs are represented as mean +/− S.E.M. Statistical tests used were 2-way ANOVA with Tukey’s multiple comparisons test (B-G, P, S and V), unpaired t-test (I-O) and score test for differences in stem cell frequencies (Q-R and T-U), *P<0.05, **P<0.005, ***P<0.0005, ns=non-significant.
Figure 5.
Figure 5.. Matrix stiffness and mechanosignaling potentiate progesterone signaling
(A) Cartoon: progesterone receptor (PR) isoforms with sites of post-translational modification (P=phosphorylation, K=SUMOylation/acetylation). (B) MECs were isolated by FACS as in Figure 2G and fractionated to prepare nuclear and cytoplasmic lysates. (left) Cytoplasmic fractions were subjected to immunoblotting with antibodies specific to phospho-ERK (p-ERK; T202/Y204) and total ERK. (right) Densitometry for phospho-ERK:total ERK is plotted (3 biological replicates). (C) (left) Nuclear lysate fractions from (B) were subjected to immunoblotting with antibodies to phosphorylated PR (p-PR, S294), p65-NFκB and Lamin B1. Densitometry for p-PR:Lamin B1 (S294; middle), and p65-NFκB:Lamin B1 (right) are plotted (3 biological replicates each). (D) T47D breast cancer cells were cultured on ECMs with varied stiffness (0.4 and 60 kPa), serum starved, and treated with EGF, R5020, or EGF and R5020 together (E+R) for 15 min. Cells were lysed for immunoblotting with antibodies to phospho-PR (S294), total PR, phospho-ERK (p-ERK; T202/Y204) and ERK. (E) Graph showing densitometry for PR-B phosphorylation:total PR-B from three biological replicates conducted as in (D). Treatments were normalized to the non-treated serum-starved condition. (F) Data from (D) plotted as fold change (STIFF/SOFT). (G-I) (left) Representative immunofluorescence for mammary gland tissues with antibodies for phospho-PRS294 (red) and Keratin 8 (K8; green, inset). Nuclei are stained with DAPI (blue, inset). Scale bars, 50 μm. (right) Graphs show the average percentage of K8-positive cell nuclei also positive for phospho-PRS294 (top, G: CTLM, n=5 and V737NM, n=6; center, H: CTLK5, n=6 and V737NK5, n=6; bottom, WT, n=5 and COL, n=6 biological replicates). (J-L) (left) Representative immunofluorescence for mammary gland tissues with an antibody to p65-NFκB (red). Scale bar, 50 μm. (right) Graphs show the average percentage of epithelial cell nuclei positive for p65-NFκB (top, G: CTLM, n=5 and V737NM, n=6; center, H: CTLK5, n=5 and V737NK5, n=5; bottom, WT, n=5 and COL, n=5 biological replicates). (M) Limiting dilution transplantation assays were performed with basal (CD24+; CD49fhi) MECs sorted from CTLM and V737NM mice treated with vehicle or an ERK inhibitor (ERKi). Stem cell frequency was calculated from the number of mammary gland repopulating events. Data not noted: V737NM Veh vs. CTL ERKi, P = 0.0541, and V737NM Veh vs. V737NM ERKi, P = 0.000419. (N) The data from (M) plotted as percentage of mammary gland repopulating events (take rate) against transplanted cell number. (O) A comparison of the extent of fat pad repopulation from (M) at each transplanted cell number. Graphs are represented as mean +/− S.E.M with the exception of B and C which show median, min and max. Statistical tests used were Mann-Whitney test (B and C, one-tailed), 2-way ANOVA with Šídák’s multiple comparisons test (E), 2-way ANOVA with Tukey’s multiple comparisons test (F, O), unpaired t-test (G-L) and score test for differences in stem cell frequencies (M, N), *P<0.05, **P<0.005, ***P<0.0005, ns=non-significant.
Figure 6.
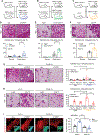
Figure 6.. Mammographic density correlates with stromal stiffness and elevated RANK activity
(A and B) (left) Representative immunofluorescence of human breast tissues with antibodies for (A) phospho-ERK (red), and (B) phospho-PRS294 (red), Keratin 18 (K18, green) and PR (magenta). Nuclei are stained with DAPI (cyan). Scale bars, 50 μm. (right) Graphs show average percentage of positive phospho-ERK staining per total epithelial cell area (A), and average percentage of PR-positive nuclear area also positive for phospho-PRS294 staining (B) (n=5 biological replicates each for low and high MD). (C) qRT-PCR analysis of gene expression for TNFSF11 (RANKL) (normalized to Krt8) in human breast tissues (low MD; n=9, high MD; n=10 biological replicates). (D) (left) Representative immunofluorescence of human breast tissues with antibodies for RANKL (red), Keratin 18 (K18, green) and Keratin 14 (K14, magenta). Nuclei are stained with DAPI (cyan). Scale bar, 50 μm. (right) Graph shows average percentage of K18-positive cell area also positive for RANKL staining (n=6 biological replicates each for low and high MD). (E and F) qRT-PCR analysis as in (C) for TNFRS11B (OPG) and TNFRSF11A (RANK) (low MD; n=9, high MD; n=10 biological replicates). (G and H) (left) Representative immunofluorescence of human breast tissues with antibodies for (G) RANK (red), Keratin 18 (K18, green) and Keratin 14 (K14, magenta), and (H) p65-NFκB (red) and Keratin 18 (K18, green). Nuclei are stained with DAPI (cyan). Scale bars, 50 μm. (right) Graphs show average percentage of positive RANK staining per total epithelial cell area (G), and average percentage of positive nuclear p65-NFκB staining per total epithelial cell nuclei (H) (n=6 biological replicates each for low and high MD). (I) Correlation matrix comparing immunofluorescence from the same individual patient specimens and the analyses presented in Figures 1A, 6B and 6D (n=8). Red-to-blue scale indicates negative-to-positive Pearson correlation values. (J) Representative whole breast mammogram where two regions of different mammographic density (MD) were excised for cryo-sectioning and subsequent analysis. (K) Two regions of the same breast as in (J) were used to measure average ECM stiffness by AFM. Sections of each region were also used to isolate RNA and determine relative TNFSF11 (RANKL) gene expression as in (C). Average AFM measurements and relative RANKL expression levels were plotted for each region to display their relationship (n=4 individual patients (Pa1–4)). Graphs are represented as mean +/− S.E.M. Statistical tests used were unpaired t-test (A-H) and Pearson’s correlation (I), *P<0.05, **P<0.005, ***P<0.0005, ns=non-significant.
Figure 7.
Figure 7.. Mechanosignaling-dependent early tumor lesion formation is abrogated by RANKL inhibition
(A-C) Breeding schematics for Neu and V737NNeu (A), PyMT and K5-V737NPyMT (B), and PyMT and COLPyMT (C) transgenic mice. (D-F) (top) Representative H&E images of mammary gland sections for Murine:Fc treated (Mu:Fc) mice. Scale bar, 400 μm. (bottom) Quantification of average normal ductal and early tumor lesion area per total gland area. (D) Neu and V737NNeu mice (n=5 biological replicates each), (E) PyMT and K5-V737NPyMT mice (n=7 and n=5 biological replicates), (F) PyMT and COL mice (n=4 biological replicates each). (G and H) Representative H&E images of mammary gland sections (left) and quantification (right) as in (D-F). Scale bar, 400 μm. (G) Neu and V737NNeu mice, (H) PyMT and COLPyMT mice (n=5 biological replicates each) were also treated with RANK:Fc. Mu:Fc treated mice are the same as those displayed in (D) and (F) for comparison. (I) (left) Representative immunofluorescence of mammary gland tissues from mice treated as in (G and H) using antibodies to p65-NFκB (red) and Keratin 8 (K8, green, inset). Nuclei are stained with DAPI (blue, inset). Scale bar, 50 μm. (right) Graph shows average percentage of positive nuclear p65-NFκB staining/epithelial cell nuclei (n=5 biological replicates each). Graphs are represented as mean +/− S.E.M. Statistical tests used were 2-way ANOVA with Tukey’s multiple comparisons test (D-I), *P<0.05, **P<0.005, ***P<0.0005, ns=non-significant.

References

    1. Tomasetti C, Li L, and Vogelstein B. (2017). Stem cell divisions, somatic mutations, cancer etiology, and cancer prevention. Science 355, 1330–1334. 10.1126/science.aaf9011. - DOI - PMC - PubMed
    1. Tomasetti C, and Vogelstein B. (2015). Cancer etiology. Variation in cancer risk among tissues can be explained by the number of stem cell divisions. Science 347, 78–81. 10.1126/science.1260825. - DOI - PMC - PubMed
    1. Blokzijl F, de Ligt J, Jager M, Sasselli V, Roerink S, Sasaki N, Huch M, Boymans S, Kuijk E, Prins P, et al. (2016). Tissue-specific mutation accumulation in human adult stem cells during life. Nature 538, 260–264. 10.1038/nature19768. - DOI - PMC - PubMed
    1. Shibue T, and Weinberg RA (2017). EMT, CSCs, and drug resistance: the mechanistic link and clinical implications. Nat Rev Clin Oncol 14, 611–629. 10.1038/nrclinonc.2017.44. - DOI - PMC - PubMed
    1. Taube JH, Herschkowitz JI, Komurov K, Zhou AY, Gupta S, Yang J, Hartwell K, Onder TT, Gupta PB, Evans KW, et al. (2010). Core epithelial-to-mesenchymal transition interactome gene-expression signature is associated with claudin-low and metaplastic breast cancer subtypes. Proc Natl Acad Sci U S A 107, 15449–15454. 10.1073/pnas.1004900107. - DOI - PMC - PubMed

Publication types

Substances