Comment
. 2024 Jan 4;31(1):39-51.e6.
doi: 10.1016/j.stem.2023.11.013.

Human cerebellar organoids with functional Purkinje cells

Affiliations
Comment

Human cerebellar organoids with functional Purkinje cells

Alexander Atamian et al. Cell Stem Cell. .

Abstract

Research on human cerebellar development and disease has been hampered by the need for a human cell-based system that recapitulates the human cerebellum's cellular diversity and functional features. Here, we report a human organoid model (human cerebellar organoids [hCerOs]) capable of developing the complex cellular diversity of the fetal cerebellum, including a human-specific rhombic lip progenitor population that have never been generated in vitro prior to this study. 2-month-old hCerOs form distinct cytoarchitectural features, including laminar organized layering, and create functional connections between inhibitory and excitatory neurons that display coordinated network activity. Long-term culture of hCerOs allows healthy survival and maturation of Purkinje cells that display molecular and electrophysiological hallmarks of their in vivo counterparts, addressing a long-standing challenge in the field. This study therefore provides a physiologically relevant, all-human model system to elucidate the cell-type-specific mechanisms governing cerebellar development and disease.

Keywords: functional Purkinje cells; human cerebellum; human pluripotent stem cell-derived organoids; human-specific rhombic lip subventricular zone; network activity; single-cell RNA sequencing; spatial transcriptomics.


Conflict of interest statement

Declaration of interests The following patent has been filed by A.A. and G.Q.: U.S. Provisional Application Serial No. 63/456,584 filed April 3, 2023.

Figures
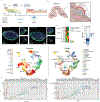
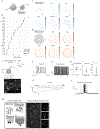
Fig. 1.
Fig. 1.. Human cerebellar organoids (hCerOs) reproducibly generate the cellular diversity of the human cerebellum.
(A) Protocol schematic for generating cerebellar organoids; ROCKi: ROCK inhibition, SB: TGFB inhibition, Noggin: BMP inhibitor, CHIR (CHIR-99021 - GSK3 inhibitor), FGF8b: Fibroblast Growth Factors 8b, T3: triiodothyronine. (B) Schematic of the developing human cerebellar plate (sagittal view) EGL: external granular layer, isth: isthmic organizer, mb: midbrain, NTZ: nuclear transitory zone, r1: rhombomere 1, RL: rhombic lip, SVZ: sub ventricular zone, VZ: ventricular zone. (C) Immunofluorescence staining of KIRREL2+ ventricular zone progenitors and ATOH1+ rhombic lip progenitors on 1 month old hCerO. SOX2 defines early neuroepithelium. (D) Normalized mean qRT-PCR expression for region-specific markers among various brain region specific organois at Day 16. (E) VoxHunt analysis on neuronal subtypes (GCP, GC, eCN/UBC, iCN, PIP, immature PC, PC, MLI) for PCW 12-24. STR: striatum, NCx: neocortex, HIP: hippocampus, DTH: dorsal thalamus, CB: cerebellum, AMY: amygdala. (F) Uniform Manifold Approximation and Projection (UMAP) plot of scRNA-seq data from 2-month organoids after canonical correlation analysis (CCA) batch correction and alignment (D2: one batch; n = 3 individual organoids combined). Left UMAP: combined organoids, colored by cell types. Right UMAP: human dataset. Ast: astrocyte, BG: Bergmann glia, BS: brainstem, CHR: choroid plexus, Div-: dividing, eCN/Unibrush: excitatory cerebellar nuclei and unipolar brush cells, GC: granule cells, GCP: granule cell progenitors, iCN: inhibitory cerebellar nuclei, MEN: meninges, MLI: molecular layer interneurons, OPC: oligodendrocyte progenitor cells, PC: Purkinje cells, PGC: progenitor cells, PIP: pax2+ interneuron progenitors, RG: radial glia, RL: rhombic lip, VZ: ventricular zone. (G) Violin Plot of key markers that identify major cell types of the developing cerebellum in organoids vs human fetal tissue.
Fig. 2.
Fig. 2.. Identification of human specific rhombic lip ventricular and subventricular subsets.
(A) UMAP unbiased clustering and DEG-based annotation of the RL and dividing-VZ subcluster (n=1629 cells; n=788 for SVZ; n=645 for VZ, n=196 for IZ). IZ, intermediate zone; SVZ, subventricular zone; VZ, ventricular zone. (B) UMAP visualization of cells grouped by sample (n=611 for D2 and n=1018 for fetal) (D2 vs fetal). (C, D) UMAP visualization of cells split by sample (D2 vs fetal). (E-G) Heatmap showing the organoid cells’ expression of human single cell DEGs from Aldinger et al 2022 used to identify IZ, SVZ, and VZ. (H) Dot plot showing the expression of selected marker genes in each subcluster used in Aldinger et al 2022.
Fig. 3.
Fig. 3.. hCerOs display organized laminar layering reminiscent of the external granule cell layer (EGL) and the Purkinje Cell layer (PCL).
(A) Schematic representation of in vivo human development around Carnegie Stage 23 (CS23) [56 days post conception]. (B) Feature plot of CXCR4 (receptor for SDF1a) within 2-month-old hCerOs and human dataset. (C) Immunofluorescence of hCerOs BARHL1 (granule cell progenitors) and CXCR4 (SDF1a receptor). scale bar: 200um. (D-I) Immunofluorescence of hCerOs BARHL1, SKOR2, and PAX6 (excitatory granule cell progenitor and marker) D-F (−SDF1a) and G-I (+SDF1a) are consecutive sections. (J-M) Immunofluorescence of hCerOs BARHL1 (granule cell progenitors) and CALB1 (Purkinje cells) (N) Binning quantification of BARHL1+ cells. Student’s t-test was performed on total of 12 regions for each condition from 3 independent experiments. (O) 6-month-old hCerO no longer treated with SDF1a. ***p-value<0.001, ****p-value<0.0001. scale bar: 200um.
Fig. 4.
Fig. 4.. hCerOs display functionally mature network activity in long-term cultures, resembling patterns of in vivo cerebellar circuits.
(A) Schematic showing functional characterization of 2- and 6-month-old hCerOs. (B) Representative 2-month-old 11a organoid transduced with SomaGCaMP6f2. (C) Spontaneous calcium signal traces as ΔF/F in 2-month-old 11a-derived hCerOs. (D) Spontaneous calcium signal traces as pseudocolor heatmap. (E) Representative heatmap as ΔF/F after bath application of 1μM TTX of a 2-months-old 11a organoid. (F) Representative pseudocolor heatmap after bath application of 1μM TTX of a 2-months-old 11a organoid. (G) Representative clustering identification on a 2-month-old hCerO. (H) Quantification of number of clusters in n=48 2-month-old hCerOs. Dots represent average value for each recorded field; bars: standard deviation. (I) Quantification of average activation for frames for n=14 2-months and n=14 6-month-old hCerOs. Student unpaired t test of ****p-value<0.0001. Dots represent max average value for each recorded field; bars: standard deviation. (J) Quantification of mean interpeak times for n=14 2-month and n=14 6-month-old hCerOs. Student unpaired t test **p-value=0.0022. Dots represent average value for each recorded field; bars: standard deviation. (K) Quantification of correlation coefficient of calcium events in n=14 2-month and n=14 6-month-old hCerO. Student unpaired t test **p-value=0.0020. Dots represent average value for each recorded field; bars: standard deviation. (L) Quantification of burstiness in each cluster for n=14 2-month and n=14 6-month-old hCerO. Student unpaired t test ***p-value<0.0001. Dots represent average value for each recorded field; bars: standard deviation. (M) Representative heatmap after bath application of 3μM NMDA of a 2-months-old 11a organoid. (N) Representative heatmap after bath application of 3μM NMDA and 3μM PTX of a 2-months-old 11a organoid. (O) One way ANOVA comparison of burstiness in each cluster of n=6 2-month-old and n=7 6-month-old hCerOs treated with NMDA and NMDA+PTX. Dots represent average value for each recorded organoid; bars: standard deviation. ***p-value=0.005, **p-value=0.0065. (P) Schematic representation of 6-months-old hCerO transduction with AAV8-SomaGCaMP6f and Lentivurus L7-eOPN3. Optogenetic stimulation was performed with 520 nm LED. Calcium imaging was performed with 2-photon microscopy. (Q) Representative images of maximum projection of stacks acquired during calcium imaging recording. (R) Analysis of average intensity per frame from calcium imaging analysis in n=3 eOPN3− and n=8 eOPN3+ infected organoids. Each dot represents an organoid. Student paired t-test ***p-value=0.0001.
Fig. 5.
Fig. 5.. Functionally mature, human Purkinje neurons develop within long-term culture of hCerOs.
(A) Schematic representation of spatial transcriptomics conducted on hCerOs. (B) Differential expression of genes between cells identified as Purkinje and non-Purkinje cells in 6-month-old hCerOs. Significant changes (p-value<0.05) are marked with solid circle. (C) UMAP feature plots showing cell level expression of Purkinje cell marker genes identified with overlapping expression of high CA8 levels. (D) Spatial localization of upregulated Purkinje cell genes within a section of 6-month-old hCerO sample #2. (E) Upper panel: schematic of patch clamp recording of PCP2+ neurons from intact hCerOs. Lower panel: representative PCP2+ neuron. Imaged with SP8-8X microscope. (F) Representative whole-cell patch-clamp trace of induced AP from PCP2+ neuron from intact hCeOs. (G) Representative whole-cell patch-clamp trace of spontaneous firing from PCP2+ neuron from intact hCerOs. (H) Quantification of peak amplitude for AP elicited from n=14 recorded cells. Mean + SD. Each dot represents a single AP from an individual neuron. (I) Quantification of AP frequency from 8 spontaneously firing cell. Mean + SD. Each dot represents a recorded neuron. (J) Quantification of Ih current for n=10 Inward Sodium/Outward Potassium Rectified currents. Mean + SD. Each dot represents a recorded neuron. (K) Representative whole-cell patch-clamp trace of Ih current from PCP2+ neuron from intact hCeOs. (L) Representative whole-cell patch-clamp trace of repetitive spontaneous firing from PCP2+ neuron from intact hCerOs. (M) Drawings of human Purkinje cells at various developmental stages (Figure reprinted with permission from Zecevic et al., 1976) compared to 6-month-old hCerO stained for CALB1. Imaged with Leica Model TL LED Thunder widefield scope.

Comment on

References

    1. Schmahmann JD (2019). The cerebellum and cognition. Neuroscience Letters 688, 62–75. 10.1016/j.neulet.2018.07.005. - DOI - PubMed
    1. Marek S, Siegel JS, Gordon EM, Raut RV, Gratton C, Newbold DJ, Ortega M, Laumann TO, Adeyemo B, Miller DB, et al. (2018). Spatial and Temporal Organization of the Individual Human Cerebellum. Neuron 100, 977–993.e7. 10.1016/j.neuron.2018.10.010. - DOI - PMC - PubMed
    1. Cutando L, Puighermanal E, Castell L, Tarot P, Belle M, Bertaso F, Arango-Lievano M, Ango F, Rubinstein M, Quintana A, et al. (2022). Cerebellar dopamine D2 receptors regulate social behaviors. Nat Neurosci 25, 900–911. 10.1038/s41593-022-01092-8. - DOI - PubMed
    1. Hoshino M, Nakamura S, Mori K, Kawauchi T, Terao M, Nishimura YV, Fukuda A, Fuse T, Matsuo N, Sone M, et al. (2005). Ptf1a, a bHLH Transcriptional Gene, Defines GABAergic Neuronal Fates in Cerebellum. Neuron 47, 201–213. 10.1016/j.neuron.2005.06.007. - DOI - PubMed
    1. Pascual M, Abasolo I, Mingorance-Le Meur A, Martínez A, Del Rio JA, Wright CVE, Real FX, and Soriano E (2007). Cerebellar GABAergic progenitors adopt an external granule cell-like phenotype in the absence of Ptf1a transcription factor expression. Proc. Natl. Acad. Sci. U.S.A 104, 5193–5198. 10.1073/pnas.0605699104. - DOI - PMC - PubMed

Supplementary concepts