. 2024 Jan 23;43(1):113575.
doi: 10.1016/j.celrep.2023.113575. Epub 2024 Jan 4.

Chronic hypoxia stabilizes 3βHSD1 via autophagy suppression

Affiliations

Chronic hypoxia stabilizes 3βHSD1 via autophagy suppression

Liang Qin et al. Cell Rep. .

Abstract

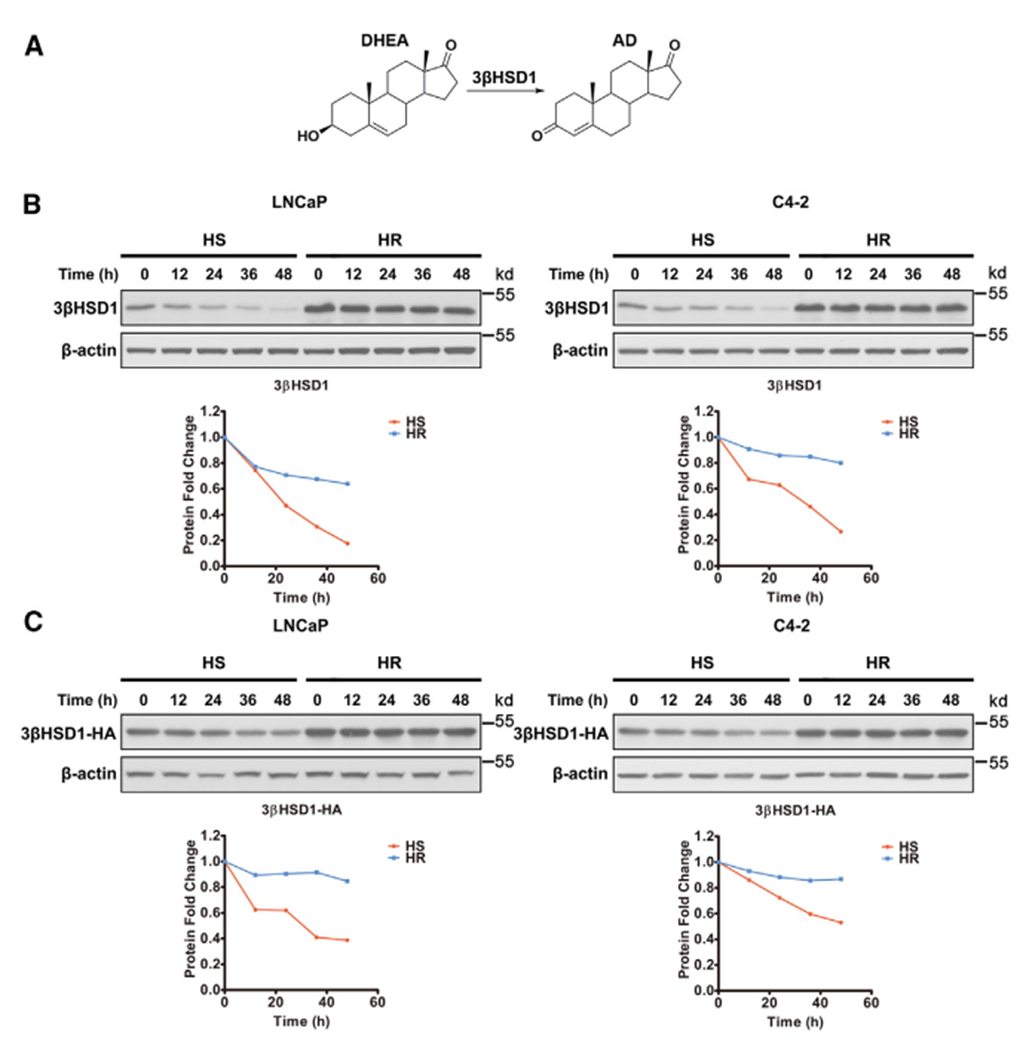
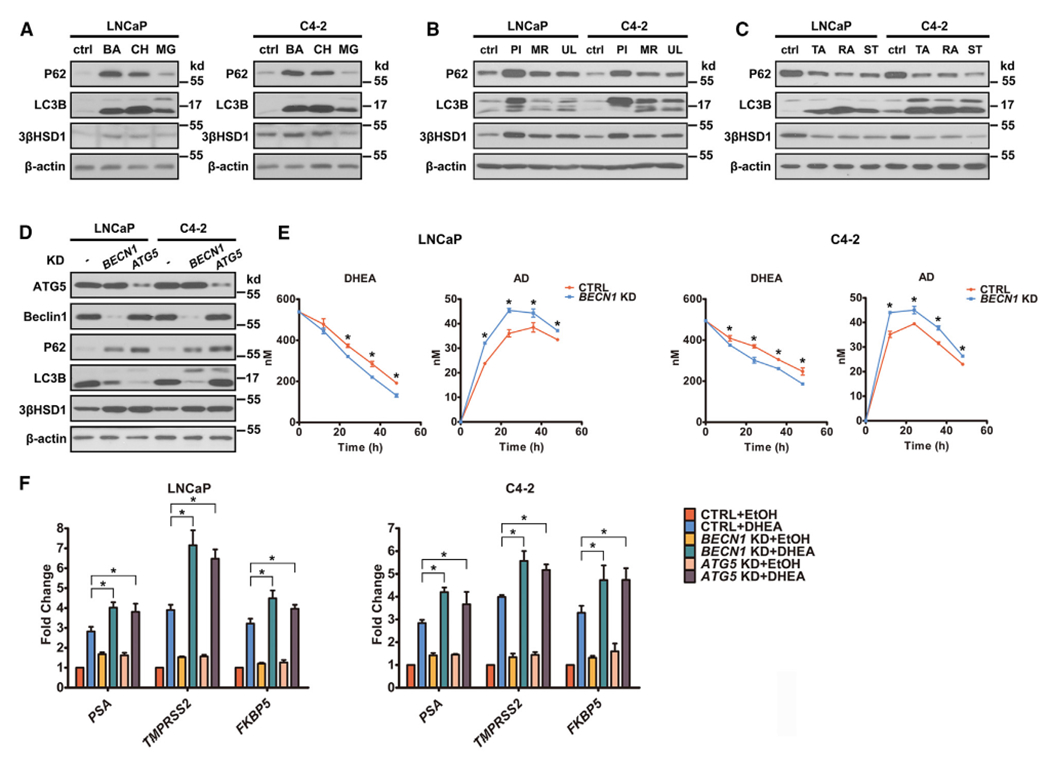
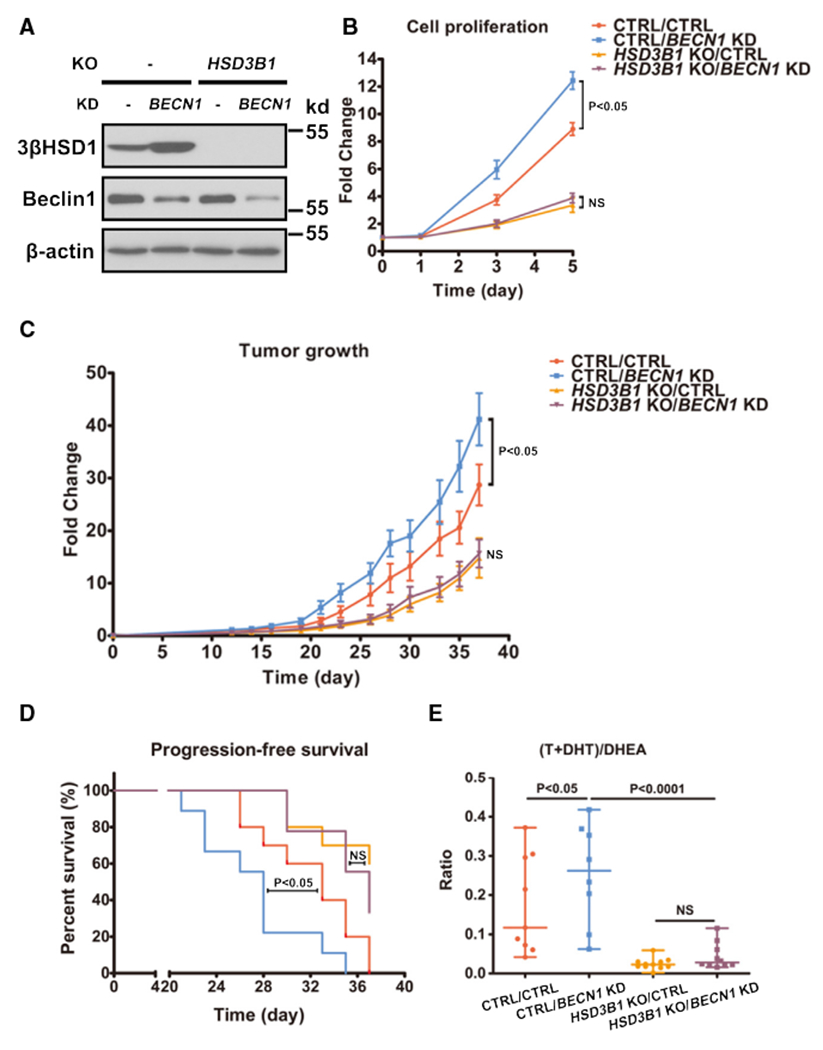
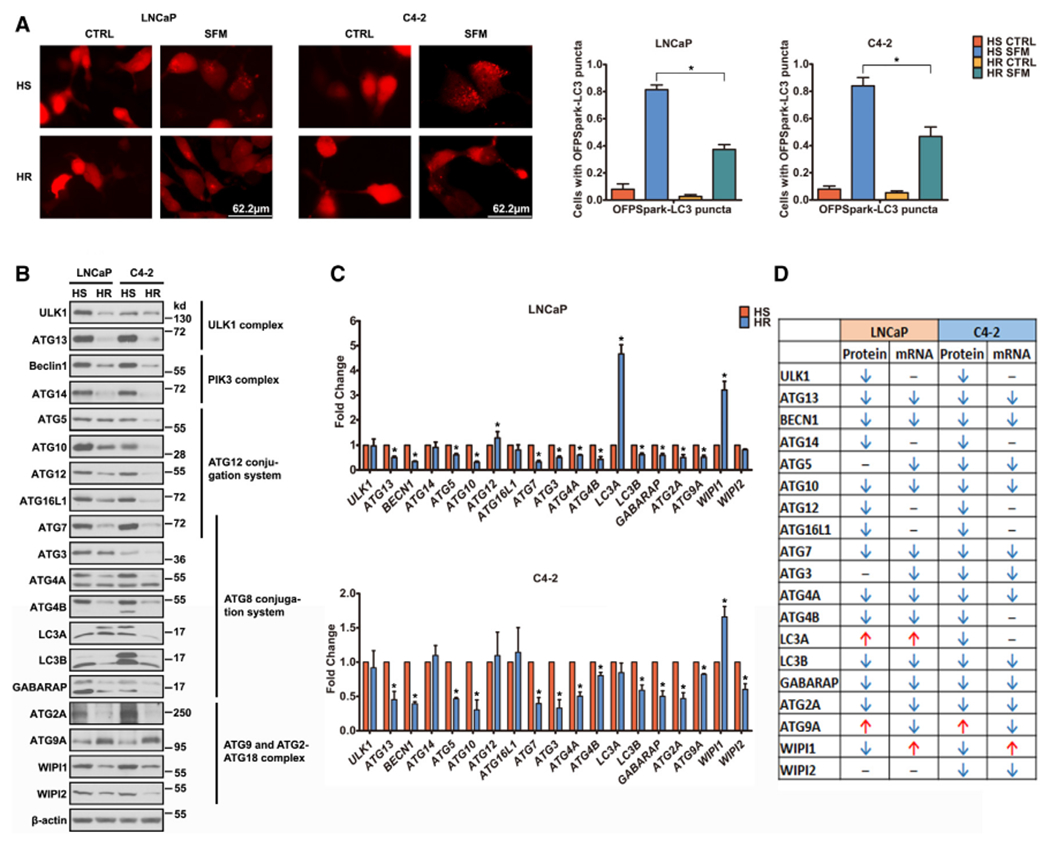
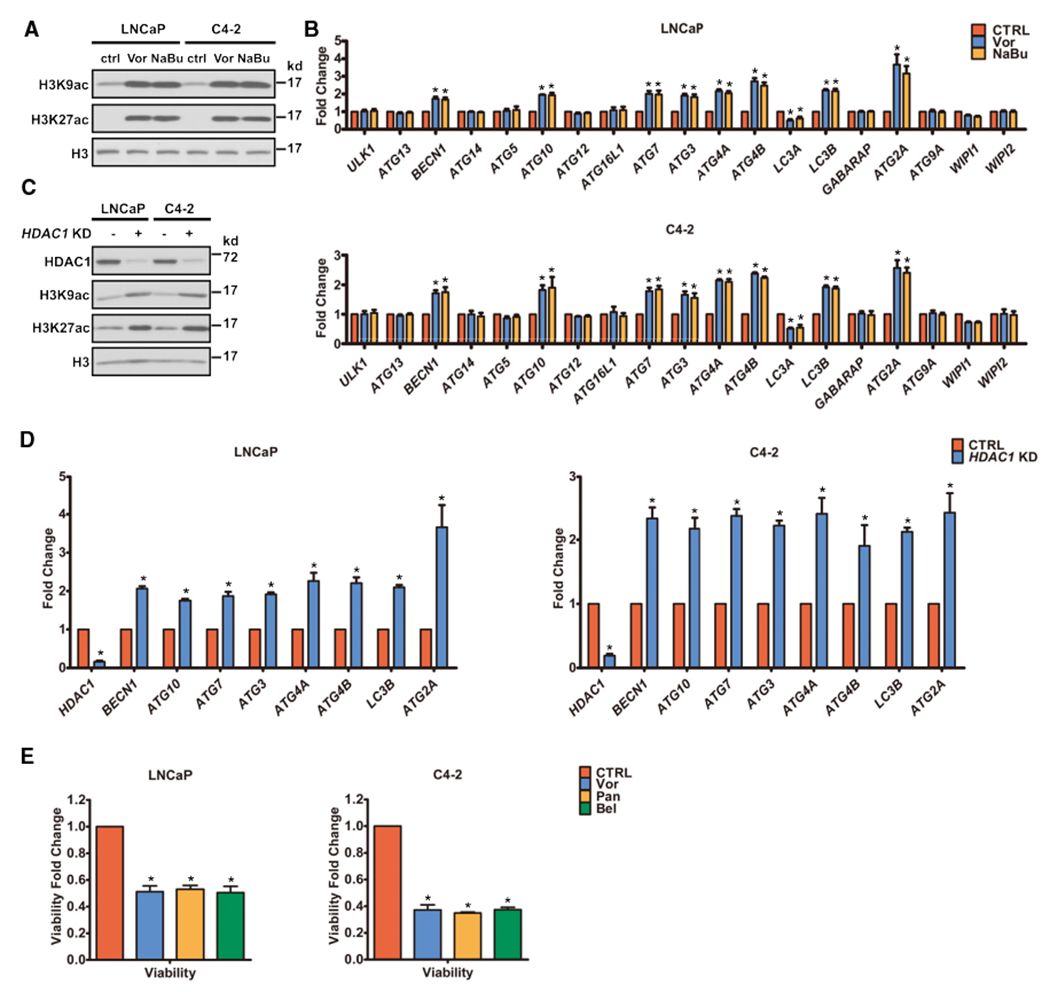
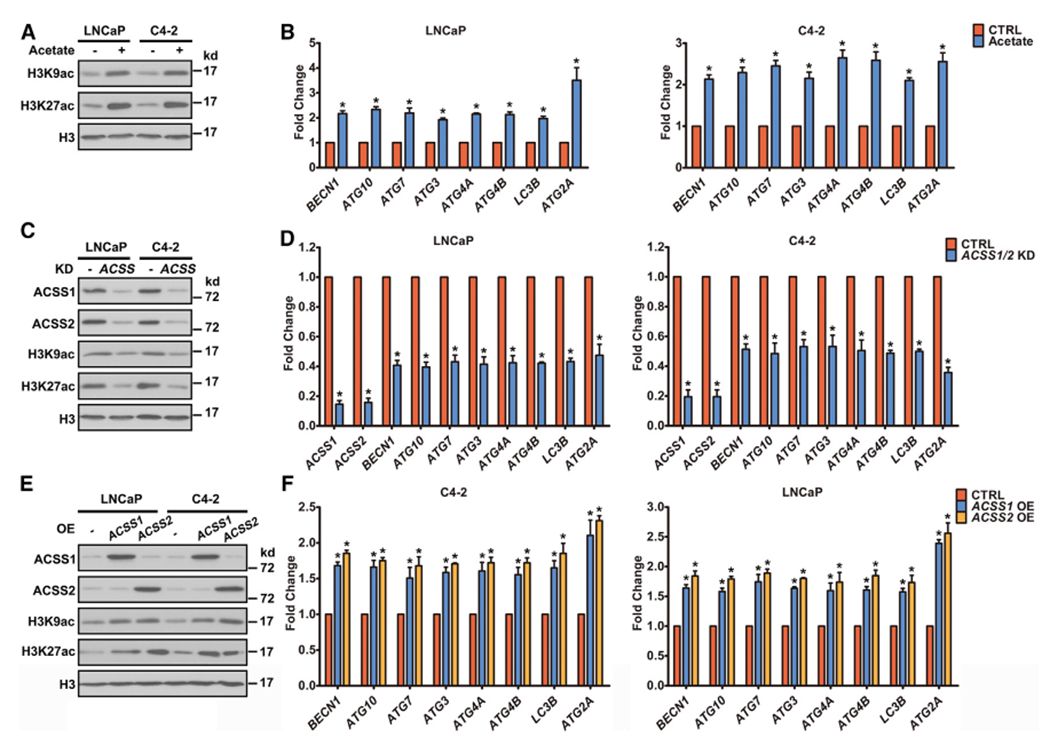
Progression of prostate cancer depends on androgen receptor, which is usually activated by androgens. Therefore, a mainstay treatment is androgen deprivation therapy. Unfortunately, despite initial treatment response, resistance nearly always develops, and disease progresses to castration-resistant prostate cancer (CRPC), which remains driven by non-gonadal androgens synthesized in prostate cancer tissues. 3β-Hydroxysteroid dehydrogenase/Δ5-->4 isomerase 1 (3βHSD1) catalyzes the rate-limiting step in androgen synthesis. However, how 3βHSD1, especially the "adrenal-permissive" 3βHSD1(367T) that permits tumor synthesis of androgen from dehydroepiandrosterone (DHEA), is regulated at the protein level is not well understood. Here, we investigate how hypoxia regulates 3βHSD1(367T) protein levels. Our results show that, in vitro, hypoxia stabilizes 3βHSD1 protein by suppressing autophagy. Autophagy inhibition promotes 3βHSD1-dependent tumor progression. Hypoxia represses transcription of autophagy-related (ATG) genes by decreasing histone acetylation. Inhibiting deacetylase (HDAC) restores ATG gene transcription under hypoxia. Therefore, HDAC inhibition may be a therapeutic target for hypoxic tumor cells.

Keywords: 3βHSD1; CP: Cancer; CP: Molecular biology; androgen synthesis; autophagy; enzyme; germline; hypoxia; metabolism; prostate cancer; protein; steroid.


Conflict of interest statement

Declaration of interests N.S. reports grants from BMS and grants from Astellas outside the submitted work; in addition, N.S. has a patent for HSD3B1 in prostate cancer issued.

Figures

Figure 1.
Figure 1.. Chronic hypoxia stabilizes 3βHSD1(367T)
(A) The conversion from DHEA to AD. (B and C) The stability of endogenous 3βHSD1 (B) and overexpressed C-terminal HA-tagged 3βHSD1 (C) in HS cells under normoxia and HR cells under hypoxia was determined using a cycloheximide chase stability assay and western blot. Time 0 represents the point of cycloheximide (50 μM) addition. β-Actin was a loading control. All experiments were performed three times with equivalent results. The immunoblot images here are the representatives of the three assays, and the graphs are the quantification of these representatives. Western blot data were quantified by digital image analysis using ImageJ. HS, hypoxia sensitive; HR, hypoxia (chronic) resistant.
Figure 2.
Figure 2.. 3βHSD1(367T) is degraded via autophagy
(A) HS cells were treated with either a lysosome inhibitor, bafilomycin A1 (BA; 100 nM) or chloroquine diphosphate salt (CH; 50 μM) or a proteasome inhibitor, MG132 (MG; 10 μM). (B) HS cells were treated with one of three different autophagy inhibitors: PIK-III (PI; 5 μM), MRT68921 (MR; 1 μM), or ULK-101 (UL; 5 μM). The graphs are the quantification of the ratio of LC3-I/LC3-II in immunoblot images here by using ImageJ. (C) HS cells were treated with autophagy activators tat-beclin 1 (TA; 5 μM) or rapamycin (RA; 500 nM) or with serum starvation (ST) for 48 h. (D) BECN1 or ATG5 was stably knocked down by short hairpin RNA (shRNA) in HS cells. ATG5, Beclin 1, P62, LC3B, 3βHSD1, and β-actin proteins were determined by western blot. (E) DHEA and AD were quantified by mass spectrometry in LNCaP and C4-2 cells with BECN1 stable knockdown and in the control cells shown in (D). Time 0 represents the point of DHEA addition. (F) AR-regulated transcripts were determined by qPCR in cells with BECN1 or ATG5 stable knockdown and in the control cells used in (D), with or without 8 h DHEA (50 nM) treatment. β-Actin was the loading control. *p < 0.05 using a one sample two-tailed t test. Error bars represent mean ± SEM.
Figure 3.
Figure 3.. In vivo analysis of tumors with BECN1 knockdown
(A) 3βHSD1 and Beclin 1 protein expression in HSD3B1 knockout (KO) and control C4-2 cells with and without shRNA-mediated BECN1 stable knockdown was determined by western blot. β-Actin was the loading control. (B) The proliferation of the cells in (A)was measured by luciferase assay. The cells were treated with DHEA (50 nM) from time 0. The proliferation was compared using an unpaired two-tailed t test on day 5. (C–E) The cells in (A) were used in a xenograft study with DHEA treatment after castration. Castration and DHEA pellet implantation were performed when the tumor volume reached 100 mm3. The number of mice in the control (CTRL)/CTRL, CTRL/BECN1 knockdown (KD), HSD3B1 KO/CTRL, and HSD3B1 KO/BECN1 KD groups were 9, 10, 11, and 10, respectively, in (C) and (D) but 9, 8, 11, and 10 in (E), in which two outliers were excluded from the CTRL/BECN1 KD group. (C) Change in tumor volume was measured, and the tumor volume on day 37 was compared using an unpaired two-tailed t test. (D) Progression-free survival was assessed as time from cell injection to tumor volume of 500 mm3 and compared using a log rank (Mantel-Cox) test. (E) T, DHT, and DHEA were measured in xenograft tumor samples from (C) using mass spectrometry, and the ratio of (T+DHT)/DHEA is shown for each xenograft group. Error bars represent mean ± SEM. The Mann-Whitney test was used to calculate a two-tailed p value, p = 0.0434.
Figure 4.
Figure 4.. Autophagy level is reduced in HR cells under chronic hypoxia
(A) Both HS and HR cells that stably expressed OFPSpark-LC3 were treated with either normal media (CTRL) or starved with serum-free media (SFM) from 48 h. Representative microscopy images of LC3 staining are shown. The images were taken at 40×, and the scale bars represent 62.2 μm. The bar chart shows the percentages of autophagic cells, which were calculated as the number of cells with more than 10 OFPSpark-LC3 puncta divided by the total number of OFPSpark-positive cells in the same field. Quantification was performed from 3 independent experiments with >25 cells using ImageJ quantification. (B and C) Protein (B) and mRNA (C) were determined by western blot and qPCR, respectively, for the indicated autophagy regulators and β-actin in HS cells under normoxia and HR cells under hypoxia. β-Actin was the loading control. *p < 0.05 using a one sample two-tailed t test. Error bars represent mean ± SEM. (D) Summary of results in (B) and (C).
Figure 5.
Figure 5.. Decreased histone acetylation downregulates autophagy regulator mRNA
(A and B) Both HR LNCaP and C4-2 cells were treated with an HDAC inhibitor, either vorinostat (Vor; 10 μM) or sodium butyrate (NaBu; 5 mM) for 36 h under hypoxia. (A) H3K9ac, H3K27ac, and H3 proteins were determined by western blot. H3 was the loading control. (B) mRNA level was determined by qPCR for the indicated autophagy regulators. (C and D) HDAC1 was stably knocked down by shRNA in HS cells. (C) HDAC1, H3K9ac, H3K27ac, and H3 proteins were determined by western blot. H3 was the loading control. (D) HDAC1, BECN1, ATG10, ATG7, ATG3, ATG4A, ATG4B, LC3B, and ATG2A mRNA was determined by qPCR. ACTB was the loading control. *p < 0.05 using a one sample two-tailed t test. (E) HR cells were treated with either DMSO (CTRL), Vor (20 μM), panobinostat (Pan; 1 μM), or belinostat (Bel; 5 μM) for 48 h under hypoxia. Cell viability was measured using a luciferase assay (Promega). *p < 0.05 using an unpaired two-tailed t test. Error bars represent mean ± SEM.
Figure 6.
Figure 6.. Acetate metabolism regulates histone-acetylation-mediated transcription of autophagy regulators
(A and B) HR LNCaP and C4-2 cells were treated with acetate (5 mM) for 24 h under hypoxia. (A) H3K9ac, H3K27ac, and H3 proteins were determined by western blot. H3 was the loading control. (B) BECN1, ATG10, ATG7, ATG3, ATG4A, ATG4B, LC3B, and ATG2A mRNA was determined by qPCR. ACTB was the loading control. (C and D) Both ACSS1 and ACSS2 were stably knocked down by shRNA in HR cells. (C) ACSS1, ACSS2, H3K9ac, H3K27ac, and H3 proteins were determined by Western blot. H3 was the loading control. (D) ACSS1, ACSS2, BECN1, ATG10, ATG7, ATG3, ATG4A, ATG4B, LC3B, and ATG2A mRNA was determined by qPCR. (E and F) ACSS1 or ACSS2 was overexpressed in HR cells. (E) ACSS1, ACSS2, H3K9ac, H3K27ac, and H3 proteins were determined by western blot. H3 was the loading control. (F) BECN1, ATG10, ATG7, ATG3, ATG4A, ATG4B, LC3B, and ATG2A mRNA was determined by qPCR. ACTB was the loading control. *p < 0.05 using a one sample two-tailed t test. Error bars represent mean ± SEM.

Similar articles

Cited by

References

    1. Siegel RL, Miller KD, Wagle NS, and Jemal A (2023). Cancer statistics, 2023. CA A Cancer J. Clin 73, 17–48. - PubMed
    1. Attard G, Parker C, Eeles RA, Schröder F, Tomlins SA, Tannock I, Drake CG, and de Bono JS (2016). Prostate cancer. Lancet (London, England) 387, 70–82. - PubMed
    1. Desai K, McManus JM, and Sharifi N (2021). Hormonal Therapy for Prostate Cancer. Endocr. Rev 42, 354–373. - PMC - PubMed
    1. Dai C, Dehm SM, and Sharifi N (2023). Targeting the Androgen Signaling Axis in Prostate Cancer. J. Clin Oncol 41, 4267–4278. - PMC - PubMed
    1. Wang G, Zhao D, Spring DJ, and DePinho RA (2018). Genetics and biology of prostate cancer. Genes Dev. 32, 1105–1140. - PMC - PubMed

Publication types

MeSH terms