. 2024 Feb 12;42(2):283-300.e8.
doi: 10.1016/j.ccell.2023.12.008. Epub 2024 Jan 4.

Integrative analysis of neuroblastoma by single-cell RNA sequencing identifies the NECTIN2-TIGIT axis as a target for immunotherapy

Affiliations

Integrative analysis of neuroblastoma by single-cell RNA sequencing identifies the NECTIN2-TIGIT axis as a target for immunotherapy

Judith Wienke et al. Cancer Cell. .

Abstract

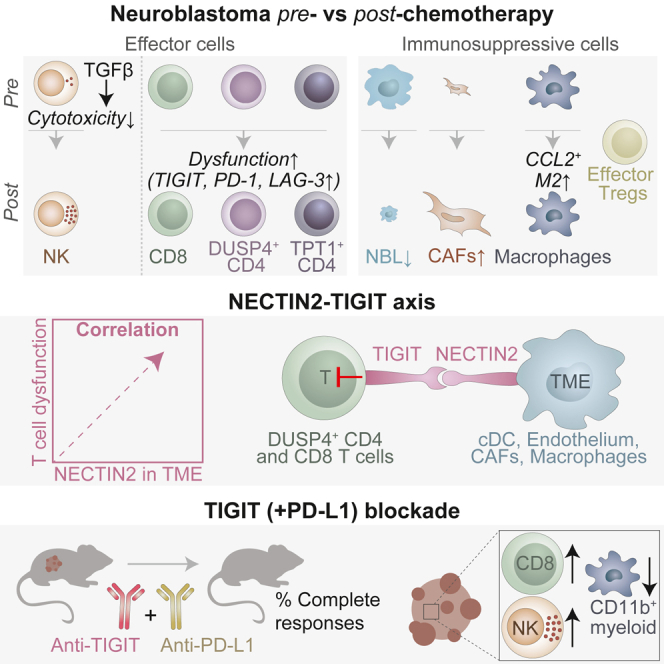
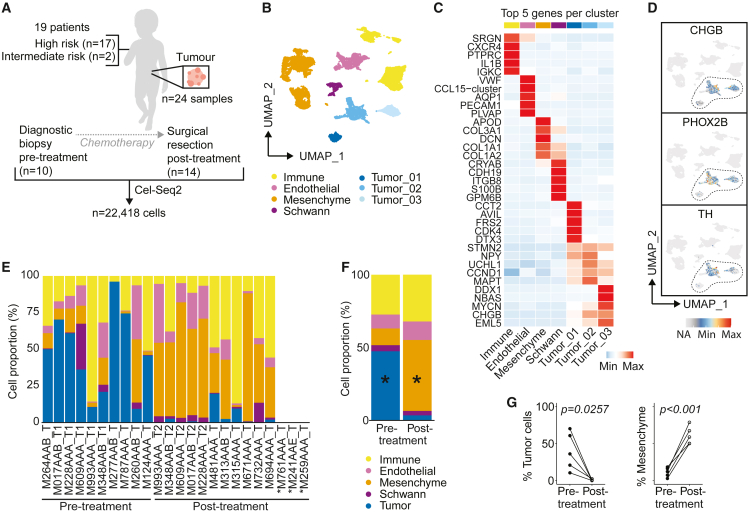
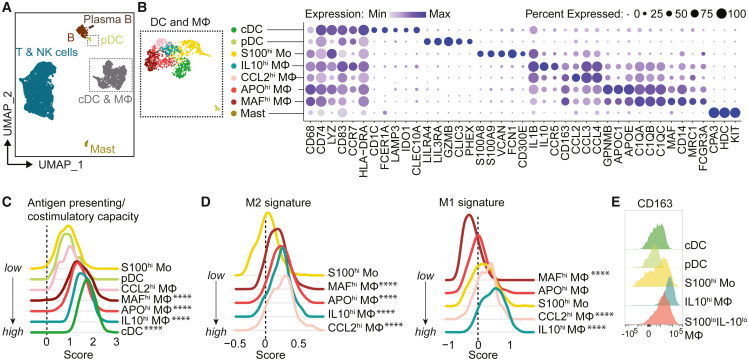
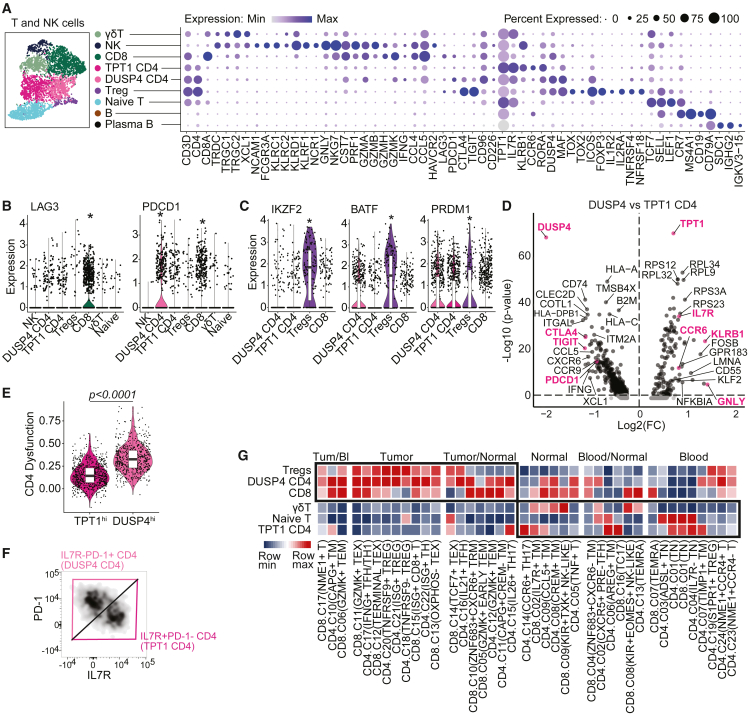
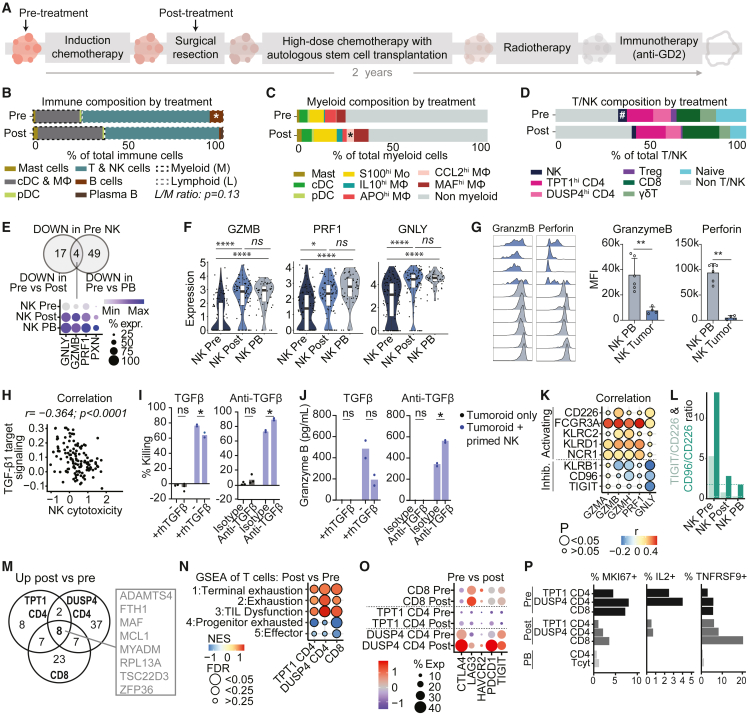
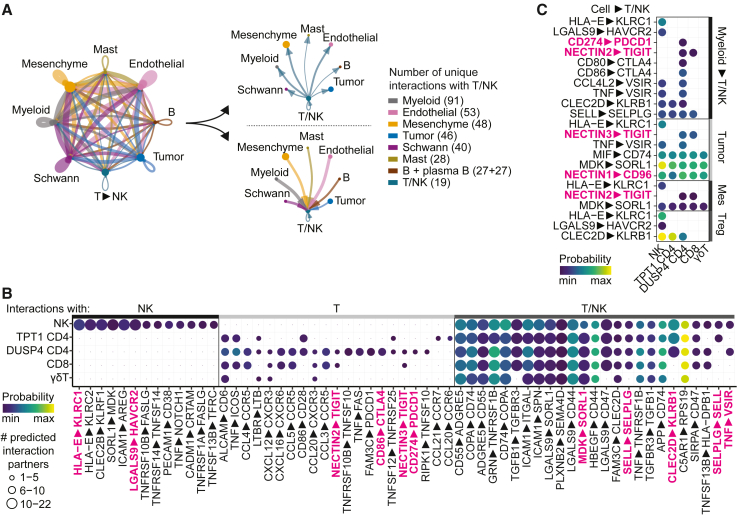
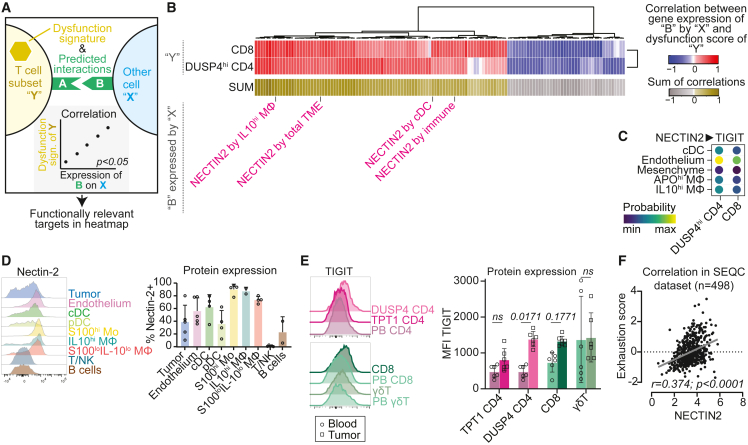
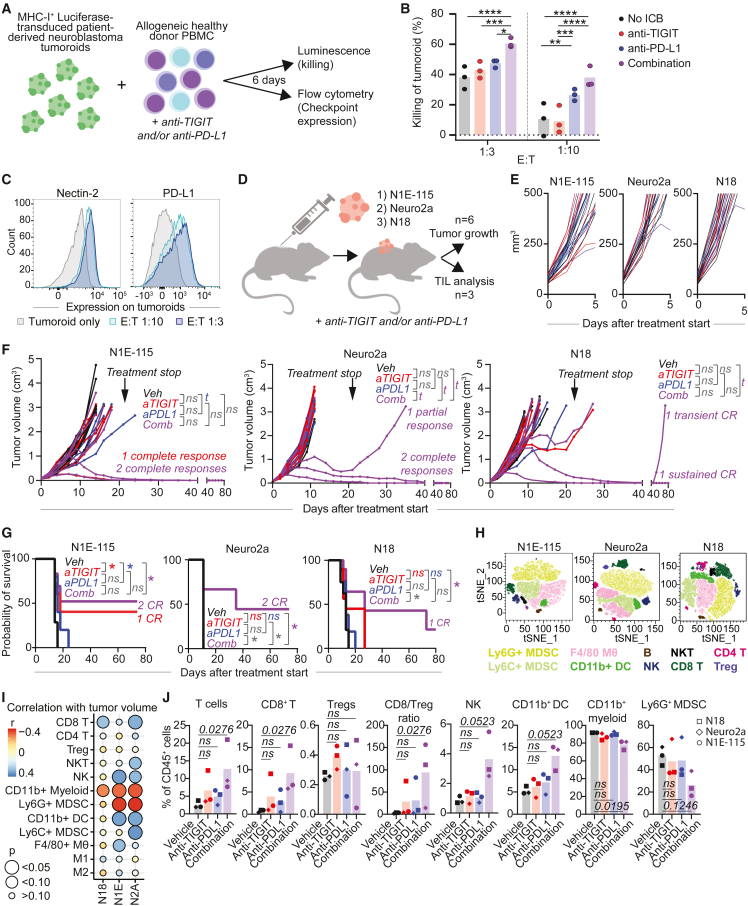
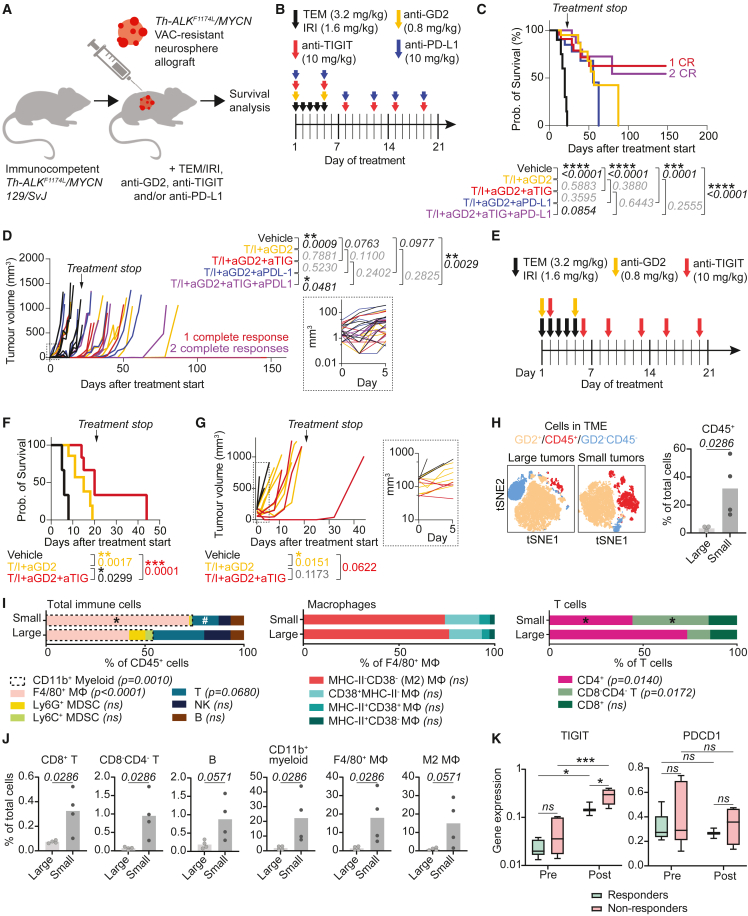
Pediatric patients with high-risk neuroblastoma have poor survival rates and urgently need more effective treatment options with less side effects. Since novel and improved immunotherapies may fill this need, we dissect the immunoregulatory interactions in neuroblastoma by single-cell RNA-sequencing of 24 tumors (10 pre- and 14 post-chemotherapy, including 5 pairs) to identify strategies for optimizing immunotherapy efficacy. Neuroblastomas are infiltrated by natural killer (NK), T and B cells, and immunosuppressive myeloid populations. NK cells show reduced cytotoxicity and T cells have a dysfunctional profile. Interaction analysis reveals a vast immunoregulatory network and identifies NECTIN2-TIGIT as a crucial immune checkpoint. Combined blockade of TIGIT and PD-L1 significantly reduces neuroblastoma growth, with complete responses (CR) in vivo. Moreover, addition of TIGIT+PD-L1 blockade to standard relapse treatment in a chemotherapy-resistant Th-ALKF1174L/MYCN 129/SvJ syngeneic model induces CR. In conclusion, our integrative analysis provides promising targets and a rationale for immunotherapeutic combination strategies.

Keywords: Immune checkpoint inhibition; NECTIN2; Neuroblastoma; PD-1; PD-L1; Pediatric oncology; TIGIT; immune evasion; immunotherapy; tumor microenvironment.


Conflict of interest statement

Declaration of interests H.C., A.R., and R.B. are employed at Hoffman-La Roche. R.B. also is an employee of Genentech, a member of the Roche Group. J.A. has founder shares in Autolus Ltd. J.A. and L.C. have received research funding from Roche for in vivo work. J.M. has received research funding from Roche for in vitro work. J.C.G is a member of a DMC for trials sponsored by YmAbs Therapeutics and University of Birmingham, and has had consulting roles for EUSA Pharma, YmAbs Therapeutics, Celgene, Servier and Norgine.

Figures

None
Graphical abstract
Figure 1
Figure 1
The single-cell landscape of neuroblastoma (A) Overview of patients and samples. (B) UMAP of main cell types. (C) Heatmap of top 5 differentially expressed genes per main cell type. (D) UMAP showing expression of neuroblastoma-associated genes. (E) Proportion of different cell types per sample. Only cells which were sorted with an unbiased FACS sorting strategy were included, which led to exclusion of M761AAA_T, M241AAE_T, and M259AAA_T. “T1” and “T2” refer to paired samples before and after treatment, respectively. (F) Average cellular composition of samples before and after induction chemotherapy. Mixed-effects analysis with Sidak’s multiple comparisons test. p < 0.005. (G) Proportion of mesenchymal and tumor cells in five paired pre- and post-treatment samples. Mann-Whitney U-test. Also see Figure S1.
Figure 2
Figure 2
Neuroblastoma is populated by immunosuppressive macrophages (A) UMAP of immune cells. (B) UMAP and dotplot of myeloid compartment with conventional dendritic cell (cDC), plasmacytoid dendritic cell (pDC), undifferentiated monocyte (Mo), and differentiated macrophage (Mφ) populations showing a selection of their marker genes. (C) Antigen presenting/co-stimulatory capacity score as constructed with genes in Figure S2F. (D) M1-like and M2-like macrophage signature score in monocytes and macrophages.∗∗∗∗p < 0.0001 versus S100hiMo, Kruskal Wallis with Dunn’s. (E) Flow cytometry of CD163 in myeloid populations. Also see Figure S2.
Figure 3
Figure 3
Neuroblastomas are characterized by lymphoid populations with differing degrees of dysfunctionality (A) UMAP and dotplot of T and natural killer (NK) cell subclusters with a selection of their marker genes. (B) Expression of LAG3 and PDCD1 in T/NK cell clusters. padj < 0.0001 in FindAllMarkers analysis among lymphocytes. (C) Transcription factors associated with effector Treg profile. padj < 0.0001 in FindAllMarkers analysis among lymphocytes. (D) Volcano plot of differentially expressed genes between the two CD4 T cell populations. (E) Expression of a previously published signature for CD4 T cell dysfunction in melanoma. Mann-Whitney U test. (F) Flow cytometric identification of two CD4 T cell populations by expression of PD-1 and IL-7R. (G) GSEA comparing neuroblastoma immune cell clusters (in rows) to previously published gene signatures which identify T cell clusters isolated from either blood, healthy tissues (“normal”) or tumors (in columns). The color scale indicates for each neuroblastoma cluster the degree of similarity (NES) with published signatures. Also see Figure S3.
Figure 4
Figure 4
The immune cell composition and functional profile before and after induction chemotherapy (A) Schematic illustration of the high-risk neuroblastoma treatment plan. Arrows indicate sampling timepoints for single-cell RNA sequencing. (B–D) Average immune (B), myeloid (C), and lymphoid (D) cell composition before and after induction chemotherapy. #0.05< p < 0.1 pre versus post; p < 0.05 pre versus post; Mann-Whitney U test. (E) Downregulated genes in NK cells in pre-treatment tumors compared to either NK cells post-treatment or reference peripheral blood (PB) NK cells (padj < 0.05). (F) Expression of cytotoxic genes by NK cells in tumors and peripheral blood (PB). ∗∗∗∗padj < 0.0001, padj < 0.05. (G) Flow cytometric analysis of granzyme B and perforin expression in neuroblastoma-infiltrating NK cells compared to reference blood NK cells (PB). ∗∗p < 0.01; Mann-Whitney U-test, mean ± SD. (H) Pearson correlation of TGF-β1 downstream signaling and tumor-infiltrating NK cell cytotoxicity (modulescore of GZMA, GZMB, PRF1, GNLY, NKG7, CST7, CCL5, and IFNG). (I and J) 24-h killing assay of luciferase-transduced neuroblastoma tumoroid AMC691B by IL-2/IL-15 primed healthy donor blood-derived NK cells with or without rhTGFβ or anti-TGFβ antibody. Two-way ANOVA, p < 0.05. (I) %Killing = 100-normalized luciferase signal (normalized to tumoroid only). (J) Multiplex immunoassay on supernatant. (K) Pearson correlation of cytotoxic gene expression with expression of activating and inhibitory receptors in tumor-infiltrating NK cells. (L) TIGIT/CD226 and CD96/CD226 gene expression ratios in NK cells from pre-/post-treatment tumors and from reference blood (PB). Dashed lines indicate ratios in NK PB. (M) Venn diagram of shared upregulated genes (padj < 0.05) in CD4 and CD8 T cells post-treatment versus pre-treatment. (N) GSEA of exhaustion and effector signatures (1 + 4: GSE84105, 2 + 5, 333) in CD4 and CD8 T cells pre-/post-treatment. NES = normalized enrichment score. (O) Dotplot of immune checkpoint receptor genes in CD4 and CD8 T cells. (P) Fraction of cells expressing proliferation marker MKI67 (Ki-67), cytokine IL2 (IL-2) and antigen-stimulated T cell marker TNFRSF9 (4-1BB). Also see Figures S4 and S5.
Figure 5
Figure 5
Immunoregulatory interactions in neuroblastoma (A) Interaction network of main cell types in neuroblastoma constructed with CellChat. (B) Bubbleplot of most frequent predicted interactions between T/NK subsets and all other cells in the TME. Interactions with >5 partners for NK cells, >2 partners for T cells, and >5 partners for T/NK cells (in at least one subset) are shown. The highest probability per interaction per T/NK cluster is indicated. Interactions shown in Figure 5C are highlighted. (C) Bubbleplot of selected, predicted immunosuppressive interactions with T/NK subsets. Interactions with each specific myeloid subset were evaluated and subsequently merged, with the highest probability of each interaction pair depicted in the plot. Also see Figure S6.
Figure 6
Figure 6
Targetable immunoregulatory interactions in neuroblastoma (A) Graphical representation of analysis strategy for Figure 6B: selection of genes (“B”) expressed by population “X” which are involved in a significant ligand-receptor interaction between population “X” and T cell subset “Y”, of which the expression by population “X” also significantly correlates with the dysfunction score of T cell subset “Y”. Genes with at least one significant correlation, with either DUSP4hi CD4 or CD8 T, were included. (B) Heatmap showing Pearson correlation of expression of genes “B” by populations “X” with dysfunction score of T cell subsets “Y”. (C) All predicted NECTIN2-TIGIT interactions with DUSP4hi CD4 and CD8 T cells in neuroblastoma. (D) Flow cytometric validation of nectin-2 protein expression on neuroblastoma tumor samples. Mean ± SD. (E) Flow cytometric validation of TIGIT protein expression on T cell populations infiltrating neuroblastoma, compared to reference T cells from blood (PB). TPT1hi CD4 were gated as IL-7RhiPD-1lo CD4+ cells and DUSP4hi CD4 were gated as IL-7RloPD-1hi CD4+ cells, as shown in Figure 3F. Two-way ANOVA with Sidak’s post-hoc test. Mean ± SD. (F) Correlation of NECTIN2 gene expression with dysfunction score in bulk-RNAseq dataset of SEQC cohort consisting of 498 neuroblastomas (r2.amc.nl; Tumor Neuroblastoma–SEQC–498–RPM–seqcnb1; GSE49710). Also see Figure S7.
Figure 7
Figure 7
Combined TIGIT/PD-L1 blockade enhances immune responses against neuroblastoma (A) In vitro killing assay with luciferase-transduced neuroblastoma tumoroids (AMC691T) and healthy donor PBMC. Tumor cells and PBMC were cocultured for 6 days ± anti-TIGIT and/or anti-PD-L1. (B) Percentage of tumoroid killing (=100-normalized luminescence; normalized against tumoroid only) by healthy donor PBMC. n = 3 donors. Two-way ANOVA with Tukey.p < 0.05; ∗∗p < 0.01, ∗∗∗p < 0.001, ∗∗∗∗p < 0.0001. (C) Flow cytometric analysis of Nectin-2 and PD-L1 expression on tumoroids cultured with PBMC at different E:T ratios. Gating strategy in Figure S8D. (D) Graphic representation of in vivo study. TIL = tumor-infiltrating leukocytes. (E and F) Tumor volumes in N1E-115, Neuro2a and N18 mouse models (n = 6 per group) treated with anti-TIGIT and/or anti-PD-L1 from day 0–5 (E) and up to day 80 of follow-up (F). Treatment was discontinued after 3 weeks. Linear Mixed-Effects Models. t = trend (0.05 < p < 0.1). (G) Survival analysis of N1E-115, Neuro2a and N18 models (n = 6 per group) treated with anti-TIGIT and/or anti-PD-L1. Matched log rank (Mantel-Cox) test. p < 0.05. (H–J) Flow cytometric analysis of the TME in vivo in n = 3 mice per treatment condition, treated with anti-TIGIT and/or anti-PD-L1 for 7 days (H) TSNE of CD45+ cells in the three models, all treatment conditions combined. (I) Pearson correlations between tumor volumes and fraction of each immune cell population (of CD45+ cells). (J) Fraction of each immune cell population (of CD45+ cells) and CD8/Treg ratio. Data were combined for each treatment condition; the mean value of n = 3 mice from each model is shown. Kruskal-Wallis with Dunn’s. Also see Figure S8.
Figure 8
Figure 8
TIGIT blockade improves survival in a chemotherapy-resistant neuroblastoma model (A) Graphic representation of study setup, adding anti-TIGIT and/or PD-L1 to the standard relapse backbone treatment (Temozolomide/Irinotecan (TEM/IRI) + anti-GD2) in a chemotherapy-resistant, immunologically cold model. (B) Treatment schedule for mice with small tumors. (C) Survival analysis in mice with small tumors. T/I = TEM/IRI, aGD2 = anti-GD2, aTIG = anti-TIGIT, aPD-L1 = anti-PD-L1. N = 7 mice per group. Matched analysis, log rank (Mantel-Cox) test. (D) Tumor volume measured over time in mice with small tumors. N = 7 mice per group. Linear Mixed-Effects Models. Right panel: detailed view of tumor volumes on days 0–5. (E) Treatment schedule for mice with large tumors. (F) Survival analysis in mice with large tumors treated with vehicle (n = 3), TEM/IRI + anti-GD2 (n = 6) or TEM/IRI + anti-GD2 + anti-TIGIT (n = 4). Matched analysis, log rank (Mantel-Cox) test. (G) Tumor volume measured over time in mice with large tumors treated with vehicle (n = 3), TEM/IRI + anti-GD2 (n = 6) or TEM/IRI + anti-GD2 + anti-TIGIT (n = 4). Linear Mixed-Effects Models. Right panel: detailed view of tumor volumes on days 0–5. (H–J) Flow cytometric analysis of TME in small and large tumors (vehicle condition). N = 4 animals per condition. (H-J) High-dimensional flow cytometry comparing immune environment in large and small tumors. (H) TNSE representation of TME and percentage of CD45+ cells. Mann Whitney U test. (I) Detailed immune cell, macrophage, and T cell composition in small and large tumors. p < 0.05 between small and large,#0.05<p < 0.1 between small and large. Two-way ANOVA. (J) Immune cell populations as percentage of total live cells (vehicle condition). Mann Whitney U test. (K) TIGIT and PDCD1 expression in single-cell RNA sequencing data (extracted from R2 (r2.amc.nl; Metelitsa–124509–Seurat_cp10k–GSE223071), of isolated CAR-NKT cells (infusion products) pre- and post-infusion into neuroblastoma patients, in responding and non-responding patients. Two-way ANOVA. ∗∗∗p < 0.001, p < 0.05. Boxplot represents mean, min, and max. Also see Figure S9.

Comment in

References

    1. Korman A.J., Garrett-Thomson S.C., Lonberg N. The foundations of immune checkpoint blockade and the ipilimumab approval decennial. Nat. Rev. Drug Discov. 2021;21:509–528. - PubMed
    1. Yu A.L., Gilman A.L., Ozkaynak M.F., London W.B., Kreissman S.G., Chen H.X., Smith M., Anderson B., Villablanca J.G., Matthay K.K., et al. Anti-GD2 antibody with GM-CSF, interleukin-2, and isotretinoin for neuroblastoma. N. Engl. J. Med. 2010;363:1324–1334. - PMC - PubMed
    1. Ladenstein R., Pötschger U., Valteau-Couanet D., Luksch R., Castel V., Ash S., Laureys G., Brock P., Michon J.M., Owens C., et al. Investigation of the Role of Dinutuximab Beta-Based Immunotherapy in the SIOPEN High-Risk Neuroblastoma 1 Trial (HR-NBL1) Cancers. 2020;12 - PMC - PubMed
    1. Smith M.A., Seibel N.L., Altekruse S.F., Ries L.A.G., Melbert D.L., O’Leary M., Smith F.O., Reaman G.H. Outcomes for children and adolescents with cancer: challenges for the twenty-first century. J. Clin. Oncol. 2010;28:2625–2634. - PMC - PubMed
    1. Irwin M.S., Naranjo A., Zhang F.F., Cohn S.L., London W.B., Gastier-Foster J.M., Ramirez N.C., Pfau R., Reshmi S., Wagner E., et al. Revised Neuroblastoma Risk Classification System: A Report From the Children’s Oncology Group. J. Clin. Oncol. 2021;39:3229–3241. - PMC - PubMed

Publication types