. 2024 Feb 12;42(2):253-265.e12.
doi: 10.1016/j.ccell.2023.12.005. Epub 2024 Jan 4.

Interferon-stimulated neutrophils as a predictor of immunotherapy response

Affiliations

Interferon-stimulated neutrophils as a predictor of immunotherapy response

Madeleine Benguigui et al. Cancer Cell. .

Abstract

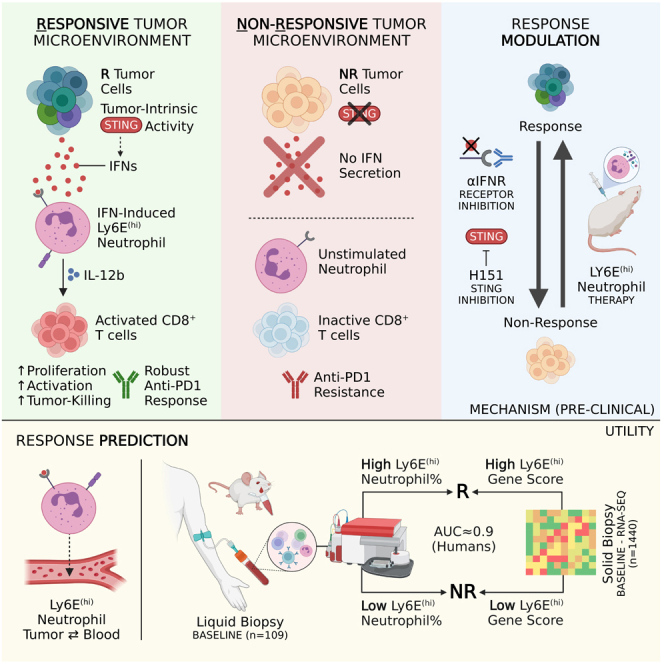
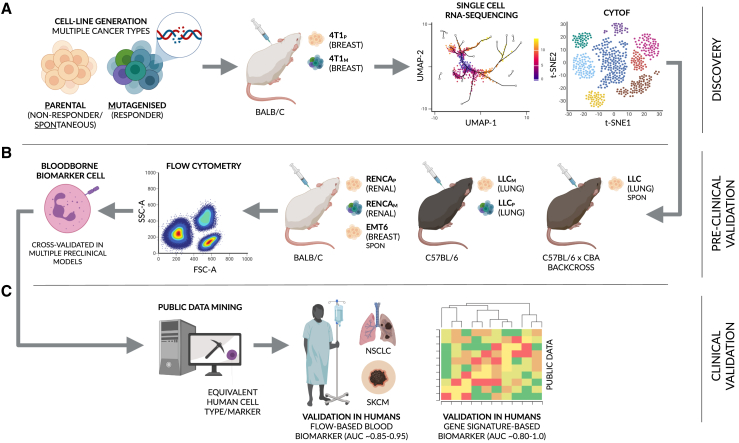
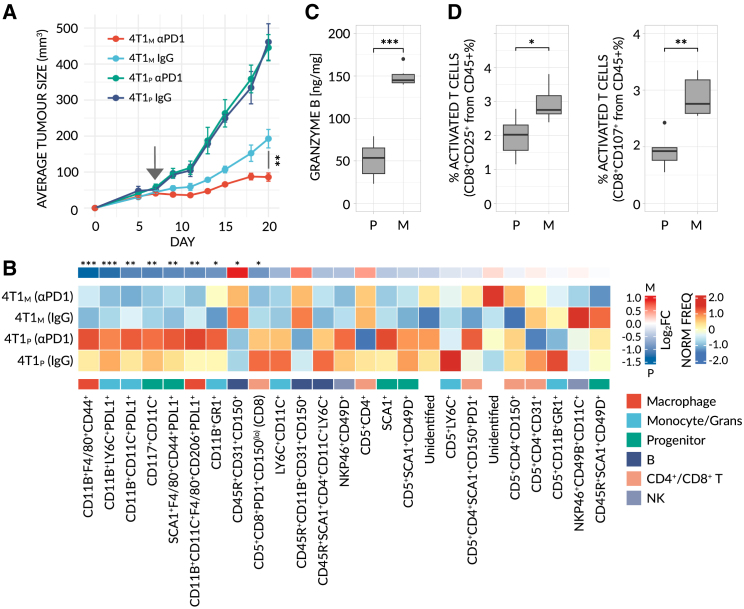
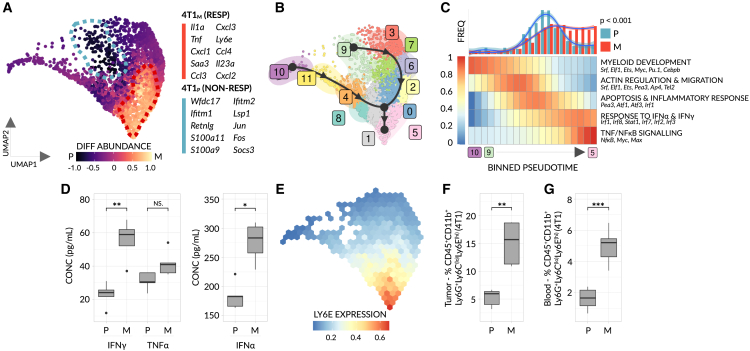
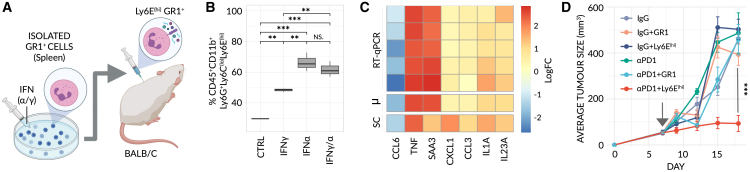
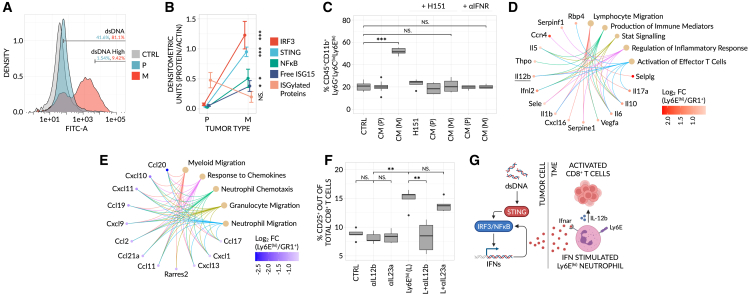
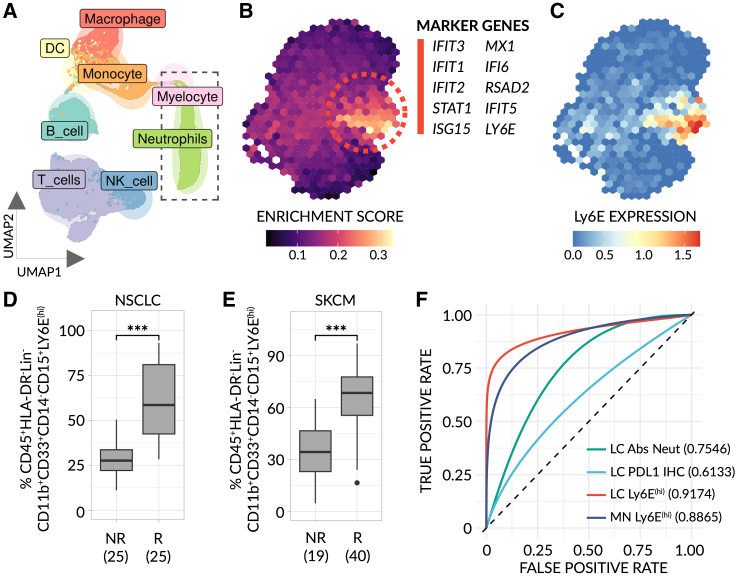
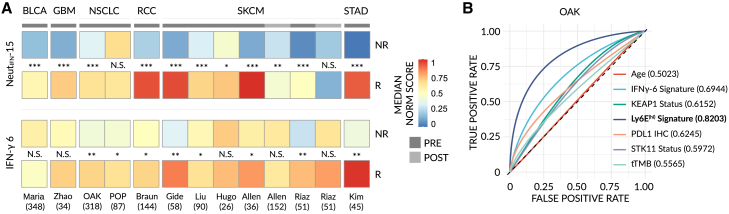
Despite the remarkable success of anti-cancer immunotherapy, its effectiveness remains confined to a subset of patients-emphasizing the importance of predictive biomarkers in clinical decision-making and further mechanistic understanding of treatment response. Current biomarkers, however, lack the power required to accurately stratify patients. Here, we identify interferon-stimulated, Ly6Ehi neutrophils as a blood-borne biomarker of anti-PD1 response in mice at baseline. Ly6Ehi neutrophils are induced by tumor-intrinsic activation of the STING (stimulator of interferon genes) signaling pathway and possess the ability to directly sensitize otherwise non-responsive tumors to anti-PD1 therapy, in part through IL12b-dependent activation of cytotoxic T cells. By translating our pre-clinical findings to a cohort of patients with non-small cell lung cancer and melanoma (n = 109), and to public data (n = 1440), we demonstrate the ability of Ly6Ehi neutrophils to predict immunotherapy response in humans with high accuracy (average AUC ≈ 0.9). Overall, our study identifies a functionally active biomarker for use in both mice and humans.

Keywords: Biomarker; STING; immunotherapy; interferon; melanoma; neutrophils; non-small cell lung cancer; response.


Conflict of interest statement

Declaration of interests M.B., T.J.C., and Y.S. declare that they hold a pending patent on the use of Ly6E(hi) neutrophils as a predictive biomarker for immunotherapy. P.C. serves on the advisory board to AstraZeneca, Boehringer Ingelheim, Chugai, Pfizer, Novartis, MSD, Takeda and Roche; receives research funds from AstraZeneca, Amgen, Boehringer Ingelheim, Novartis, Roche, and Takeda, receives speaker honoraria from AstraZeneca, Janssen, Novartis, Roche, Pfizer, Thermo Fisher, Takeda. J.B. serves as a consultant to AbbVie, Amgen, AstraZeneca, Bayer, MSD, Merck-Serono, Roche, Takeda, BMS, Medison, Pfizer, and received research funds from Immunai, OncoHost. M.S. holds equity in Actym, Adaptive Biotechnologies, Amphivena, Asher, Evolveimmune, Intensity, Nextcure, Normunity, Oncohost, Johnson and Johnson, Glaxo-Smith Kline; serves as a consultant to Adagene, Adaptimmune, Agenus, Alkermes, Alligator, Anaptys, Asher, Astra Zeneca, Biond, Biontech, Boston Pharmaceuticals, Bristol-Myers, Dragonfly, Evaxion, Evolveimmune, Genentech-Roche, Gilead, Glaxo Smith Kline, Ichnos, Idera, Immunocore, Incyte, Innate pharma, Iovance, iTEOS, Jazz Pharmaceuticals, Kadmon-Sanofi, Kanaph, Merck, Molecular Partners, Nextcure, Nimbus, Normunity, Numab, Ocellaris-Lilly, Oncohost, Ontario Institute for Cancer Research, Partner Therapeutics, Pfizer, Pierre-Fabre, PIO Therapeutics, Pliant, Regeneron, Rootpath, Rubius, Sapience, Simcha, Stcube, Sumitomo, Targovax, Teva, Turnstone, Verastem, Xilio. S.S.O. holds equity in CytoReason and serves as a consultant. Y.S. is a co-founder of OncoHost and RemedyCell, holds equity in these company and also serves as a consultant to both companies.

Figures

None
Graphical abstract
Figure 1
Figure 1
A multi-model approach to identify a clinically relevant biomarker for immunotherapy response A schematic overview of the paper. (A and B) In brief, several mouse strains in combination with multiple cancer cell lines and clones were used to initially screen for and subsequently cross-validate a biomarker for immunotherapy response in mouse. (C) To clinically translate our findings, public data and data from a cohort of patients with non-small cell lung cancer (NSCLC) and skin cutaneous melanoma (SKCM) were used to assess the accuracy and utility of the identified biomarker in humans (see STAR Methods and introduction for additional, step-by-step details). Mouse strains: BALB/c, C57BL/6, and a C57BL/6 x CBA backcross. Cancer cell lines: 4T1 breast cancer, Lewis lung carcinoma (LLC), renal cell carcinoma (RENCA), and EMT6 breast cancer. P = parental cell line, M = mutagenized clone.
Figure 2
Figure 2
A mutagenized 4T1 breast cancer model displays an immunogenic phenotype (A) Averaged tumor growth profile for BALB/c mice implanted with parental (non-responsive) or mutagenized (responsive) 4T1 breast cancer (4T1P - (P) and 4T1M - (M), respectively), and treated with αPD1 or control IgG antibodies (n = 5 mice/group). Raw data are available in Figure S1A. Significance was assessed by means of two-sample KS-test (∗∗, p < 0.001). (B) CD45+ cells from the tumor microenvironment (TME) of 4T1P (205,678 cells) and 4T1M (236,251 cells) tumors were segregated into 25 distinct, unsupervised clusters. A heatmap of normalized, scaled cluster frequencies per-sample is shown. Cluster genotypes and parental cell-types were annotated based on the expression of all markers, inspected in parallel (see Figure S1B). Generalized linear models (GLMs) were fit to detect differentially abundant (4T1P vs. 4T1M, combined treatments) clusters. Treatment was initiated at a tumor size of ∼50 mm3 (arrow). Significance was assessed by means of FDR-corrected, Bayesian-moderated t tests (, FDR < 0.01; ∗∗, FDR < 0.001; ∗∗∗, FDR < 0.0001). (C) Granzyme B concentrations in untreated tumor lysates, as measured by ELISA (n = 6 mice/group). (D) Frequency of activated (CD25+ or CD107+) cytotoxic T cells, as determined by flow cytometry, in 4T1 tumors (n = 6 mice/group). All CyTOF samples, tumors and lysates were taken at endpoint (tumor size of ∼200–500 mm3). In (C and D), significance was assessed by means of a one-way Mann-Whitney test (, p < 0.01; ∗∗, p < 0.001; ∗∗∗, p < 0.0001).
Figure 3
Figure 3
IFN-stimulated, Ly6E(hi) neutrophils mark response to αPD1 in 4T1 breast cancer 10X scRNA-seq was performed on GR1+ cells obtained from parental (4T1P) (non-responsive) and mutagenized (4T1M) (responsive) 4T1 breast cancer tumors (n = 3 mice pooled/group). (A) UMAP plot of 2886 filtered, GR1+ neutrophils (4T1P = 681 cells, 4T1M = 2185 cells), with cells colored based on differential abundance score. Two significantly enriched, cellular neighborhoods (dotted lines) are highlighted (see also Figure S2C). The top 10, most significant marker genes of each neighborhood are listed (FDR < 0.001, log2 fold-change > 1.5). Monocytic cells (not shown) were discarded from the analysis (see: Figure S2). (B) Trajectory analysis for 12 distinct, GR1+ granulocytic clusters. Solid black line = trajectory lineages, which form the basis of the pseudotemporal ordering as inferred by partition-graph based abstraction (PAGA). Black arrows = simplified RNA-velocity (for raw data, see Figure S2D). (C) Top: A histogram of binned cell frequencies as a function of aligned pseudotime. Smoothed distributions, generated by loess regression, are overlaid. Significance was assessed by means of two-sample KS-test. Bottom: A heatmap of normalized, binned enrichment scores for all gene modules that display a significant association with pseudotime (FDR < 0.01). Only gene-modules common to both lineages are shown. (D) Boxplots showing the concentration of IFNγ, TNFα and IFNα within untreated 4T1 tumor lysates (n = 4-5 mice/group). (E) Binned, normalized expression of Ly6E. Data were imputed for visual clarity. (F and G) Frequencies of Ly6E(hi) neutrophils, as determined by flow cytometry (n = 5-10 mice/group), in 4T1 tumors (F); and the blood of 4T1 bearing mice (G); For the gating strategy see Figure S3A. In (D, F, and G), significance was assessed by means of a one-way Mann-Whitney test (NS, p > 0.01; , p < 0.01; ∗∗, p < 0.001, ∗∗∗, p < 0.0001).
Figure 4
Figure 4
Ly6E(hi) neutrophils sensitize non-responding 4T1 tumors to αPD1 treatment (A) Schematic of adoptive transfer. Isolated GR1+ cells are treated in vitro with IFNγ/α, inducing a Ly6E(hi)-like state, characterized by secretion of effector molecules, and injected into BALB/c mice bearing parental, non-responsive 4T1 breast tumors. (B) Frequency of Ly6E(hi) neutrophils following exposure of GR1+ cells to IFNγ, IFNα or both, as determined by flow cytometry (n = 3 mice/group). Significance was assessed by means of a one-way ANOVA and Tukey’s post-hoc HSD test (NS, p > 0.01; ∗∗, p < 0.001; ∗∗∗, p < 0.0001). (C) A heatmap comparing normalized, log2-fold changes from RT-qPCR (treated [+IFNγ/α] vs. untreated control GR1+ cells) and scRNA-seq (Ly6E(hi) neutrophils vs. all remaining neutrophils) (n = 7 biological repeats/group). SC = scRNA-seq. μm = averaged RT-qPCR values. (D) Averaged tumor growth profiles for mice bearing parental, non-responsive 4T1 breast tumors treated with either a monotherapy (control IgG or αPD1) or a combined therapy, with GR1+ or Ly6E(hi) neutrophils, as specified (n = 6 mice/group). A time-course of the adoptive transfer is depicted in (Figure S4A). Raw data are available in (Figure S4B). Treatment was initiated at a tumor size of ∼50 mm3 (arrow). Significance was assessed by means of two-sample KS-test (∗∗∗, p < 0.0001).
Figure 5
Figure 5
Tumor-intrinsic STING activity induces the Ly6E(hi) phenotype and in-turn supports activation of effector T cells (A) Density plots of dsDNA levels in cultured 4T1P and 4T1M cell-lines, as determined by α-dsDNA staining and flow cytometry. dsDNA levels were quantified relative to an unstained, IgG2a isotype control (CTRL) (n = 5 biological repeats/group). (B) Densitometry quantification of western blots (see Figure S5A) for STING-pathway related proteins in 4T1P and 4T1M tumor lysates (n = 3–4 biological repeats/group). Each protein was normalized relative to an actin control. (C) Isolated GR1+ cells were cultured in vitro with conditioned media generated from 4T1P (P) or 4T1M (M) tumors in the presence or absence of the STING-inhibitor H151 or αIFNR-α/γ, and the frequencies of Ly6E(hi) neutrophils were determined by flow cytometry (n = 6 biological repeats/group). CTRL = GR1+ cells only. (D and E) Conditioned media was generated from GR1+ cells or IFNαγ-induced Ly6E(hi) neutrophils, and subsequently assayed on a cytokine array (n= 3 mice pooled/group). Hyper-geometric, over-representation tests and the Gene Ontology (GO) database were used to determine enriched pathways for Ly6E(hi) neutrophils (D); and GR1+ cells (E). Only differentially expressed proteins with a log2FC > 0.35 were included and only significant pathways (FDR < 0.01) are shown. (F) Isolated CD8+ T cells were cultured in vitro with α-IL-12b or α-IL23a neutralizing antibodies, with or without conditioned media from IFNα/γ-induced Ly6E(hi) neutrophils (L), and the levels of activated CD25+CD8+ T cells were determined by flow cytometry (n = 5 mice/group). CTRL = CD8+ T cells only. In (B, C, and F), significance was assessed by means of a one-way ANOVA and Tukey’s post-hoc HSD test (NS, p > 0.01; , p < 0.01; ∗∗, p < 0.001; ∗∗∗, p < 0.0001). (G) Schematic of the proposed mechanism. Tumor-intrinsic STING activity, as induced by cytosolic dsDNA as a result of hypoxia, genomic instability and/or cell stress, transcriptionally activates an IFN response. Tumor-secreted IFNα, for example, subsequently binds to Ifnar-expressing Neutrophils in the TME, inducing the Ly6E(hi) phenotype and in-turn activation and proliferation of CD8+ T cells through IL-12b. Collectively, this supports immunotherapy response and anti-tumor activity. It is important to note that this mechanism is STING-specific, but that Type II IFNs (e.g., IFNγ)—derived from other sources or mechanisms—are also able to elicit equivalent effects, as shown in our work.
Figure 6
Figure 6
Ly6E(hi) neutrophils serve as a predictive biomarker for immunotherapy response in humans (A) UMAP plot of 11702 filtered, CD45+ cells taken from publicly available non-small cell lung cancer (NSCLC) scRNA-seq data (patient blood samples at baseline, n = 8), with cells colored by cell type. (B) Binned UMAP plot of isolated neutrophils (dotted box in (A)), with cells colored by the extent of their enrichment for a Ly6E(hi) functional signature. The top 10, most significant marker genes of the enriched cluster (dotted lines) are listed (FDR < 0.001, log2 fold-change > 1.5). (C) Binned, normalized expression of Ly6E. Data were imputed for visual clarity. (D and E) Frequency of Ly6E(hi) neutrophils in the blood of an independent cohort of patients with NSCLC (n = 50) (D) and skin cutaneous melanoma (SKCM) (n = 59) (E), as determined by flow cytometry. For the gating strategy see Figure S3B. Data are stratified by RECIST categories at 3 and/or 6 months (NR = progressive disease (PD) and R = stable disease (SD), partial or complete response (P/CR)). Sample sizes are denoted for each individual group. Significance was assessed by means of a one-way Mann-Whitney test (∗∗∗, p < 0.0001). (F) Smoothed area under the curve (AUC)-receiver operating characteristics (ROC) plots for Ly6E(hi) neutrophils (95% CIs: 0.855–0.9705 (NSCLC - LC), 0.7913–0.9606 (Melanoma - MN)), absolute neutrophil count (Abs Neut) (95% CIs: 0.534–0.9328 (in NSCLC)) and tumor PDL1 IHC (95% CIs: 0.3554–0.9338 (in NSCLC)) in our cohort of patients (NR vs. R). Confidence intervals were determined using 1,000 stratified, bootstrap replicates.
Figure 7
Figure 7
A Ly6E(hi) neutrophil-derived gene signature outperforms pre-existing biomarkers in the prediction of immunotherapy response (A) Bulk RNA-seq expression profiles were obtained from 1,440 publicly available samples from 11 datasets across 6 cancer types,,, (see STAR Methods) and scored for a 15-gene Ly6E(hi)-signature (NeutIFN-15) (top) or a previously published 6-gene IFNγ-signature (bottom). A heatmap of median, normalized enrichment scores for each dataset is shown and significant differences between groups were tested (NR vs. R). Samples were taken either pre-treatment (PRE) or post-treatment (POST). Raw data are available in Figure S10. BLCA = urothelial bladder cancer; GBM = glioblastoma multiforme; NSCLC = non-small cell lung cancer; RCC = renal cell carcinoma; SKCM = skin cutaneous melanoma; STAD = stomach adenocarcinoma. Significance was assessed by means of a one-way Mann-Whitney test (NS, p > 0.01; , p < 0.01; ∗∗, p < 0.001, ∗∗∗, p < 0.0001). (B) Smoothed area under the curve (AUC)-receiver operating characteristics (ROC) plots for total tumor mutation burden (tTMB) (95% CIs: 0.4865-0.6722), Age (95% CIs: 0.4374-0.5766), PDL1 immunohistochemistry (IHC) (95% CIs: 0.5534-0.7172), STK11 mutational status (95% CIs: 0.5246-0.6874), KEAP1 mutational status (95% CIs: 0.5334-0.7085), IFNγ-6 signature scores (95% CIs: 0.6253-0.7561) and Ly6E(hi) NeutIFN-15 signature scores (95% CIs: 0.7714-0.9105) in data from the OAK NSCLC study (NR vs. R). Confidence intervals were determined using 1,000 stratified, bootstrap replicates.

References

    1. Schwaederle M., Zhao M., Lee J.J., Lazar V., Leyland-Jones B., Schilsky R.L., Mendelsohn J., Kurzrock R. Association of Biomarker-Based Treatment Strategies With Response Rates and Progression-Free Survival in Refractory Malignant Neoplasms: A Meta-analysis. JAMA Oncol. 2016;2:1452–1459. - PubMed
    1. Robert C. A decade of immune-checkpoint inhibitors in cancer therapy. Nat. Commun. 2020;11:3801. - PMC - PubMed
    1. Valero C., Lee M., Hoen D., Zehir A., Berger M.F., Seshan V.E., Chan T.A., Morris L.G.T. Response Rates to Anti-PD-1 Immunotherapy in Microsatellite-Stable Solid Tumors With 10 or More Mutations per Megabase. JAMA Oncol. 2021;7:739–743. - PMC - PubMed
    1. Lu S., Stein J.E., Rimm D.L., Wang D.W., Bell J.M., Johnson D.B., Sosman J.A., Schalper K.A., Anders R.A., Wang H., et al. Comparison of Biomarker Modalities for Predicting Response to PD-1/PD-L1 Checkpoint Blockade: A Systematic Review and Meta-analysis. JAMA Oncol. 2019;5:1195–1204. - PMC - PubMed
    1. Rieth J., Subramanian S. Mechanisms of Intrinsic Tumor Resistance to Immunotherapy. Int. J. Mol. Sci. 2018;19 - PMC - PubMed

Publication types