

Adverse Metabolic Phenotypes in Parenterally Fed Neonatal Pigs Do Not Persist into Adolescence
- PMID: 38181968
- PMCID: PMC10900187
- DOI: 10.1016/j.tjnut.2023.12.048
Adverse Metabolic Phenotypes in Parenterally Fed Neonatal Pigs Do Not Persist into Adolescence
Abstract
Background: Nutrition during fetal and neonatal life is an important determinant for the risk of adult-onset diseases, especially type 2 diabetes and obesity.
Objectives: We aimed to determine whether total parenteral nutrition (TPN) compared with enteral formula feeding [enteral nutrition (EN)] in term piglets during the first 2 wk after birth would increase the long-term (5-mo) development of metabolic syndrome phenotypes with adverse glucose homeostasis, fatty liver disease, and obesity.
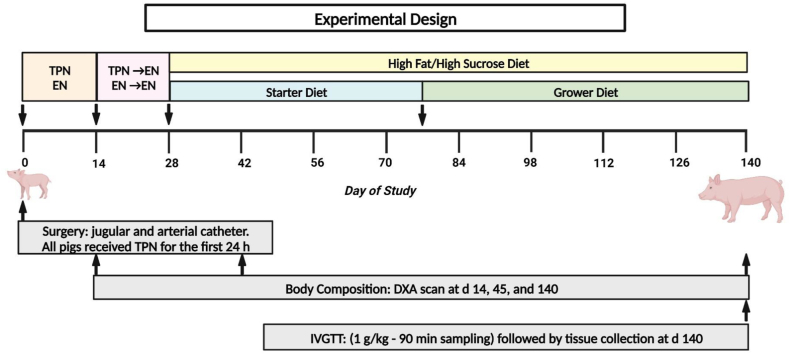
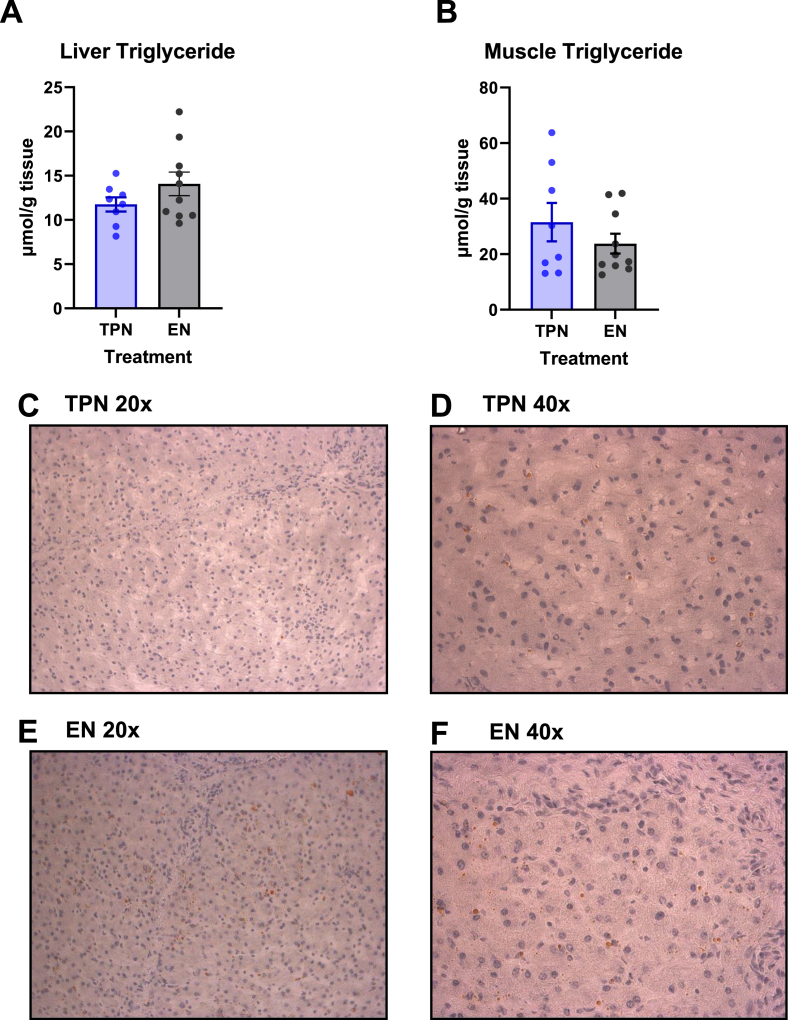
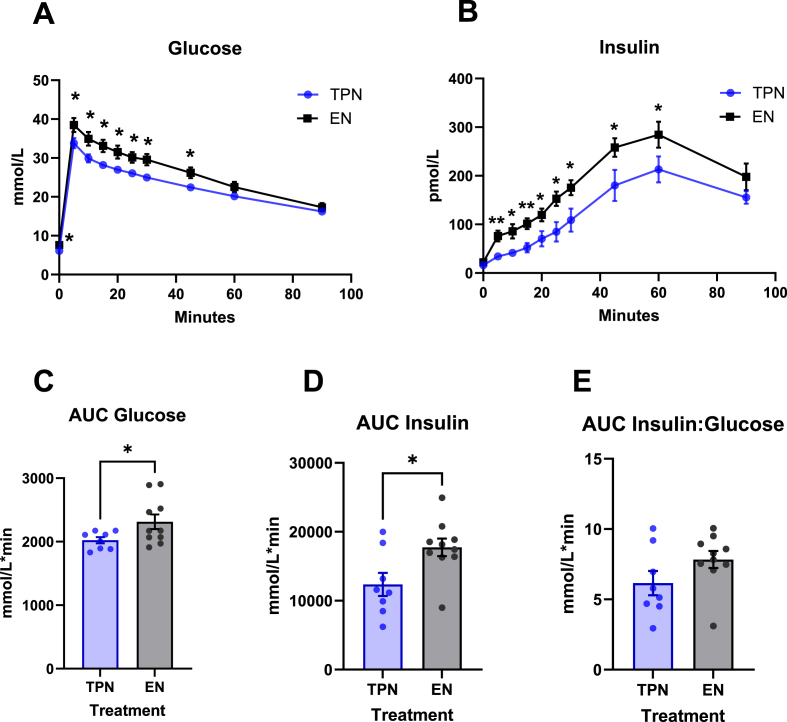
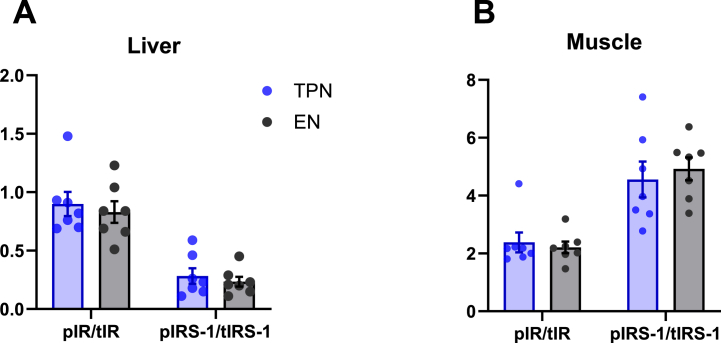
Methods: Neonatal female pigs were administered TPN (n = 12) or fed enterally with a liquid enteral milk-replacer formula (EN, n = 12) for 14 d. After transitioning TPN pigs to enteral feeding of liquid formula (days 15-26), both groups were adapted to a solid high-fat diet (30% of the total diet) and sucrose (20% of the total diet) diet (days 27-33), which was fed until the end of the study (140 d). Body composition was measured by dual-energy X-ray absorptiometry at 14, 45, and 140 d. Serum biochemistry and glucose-insulin values (after a fasting intravenous glucose tolerance test) were obtained at 140 d. Liver and muscle were analyzed for insulin receptor signaling and triglycerides.
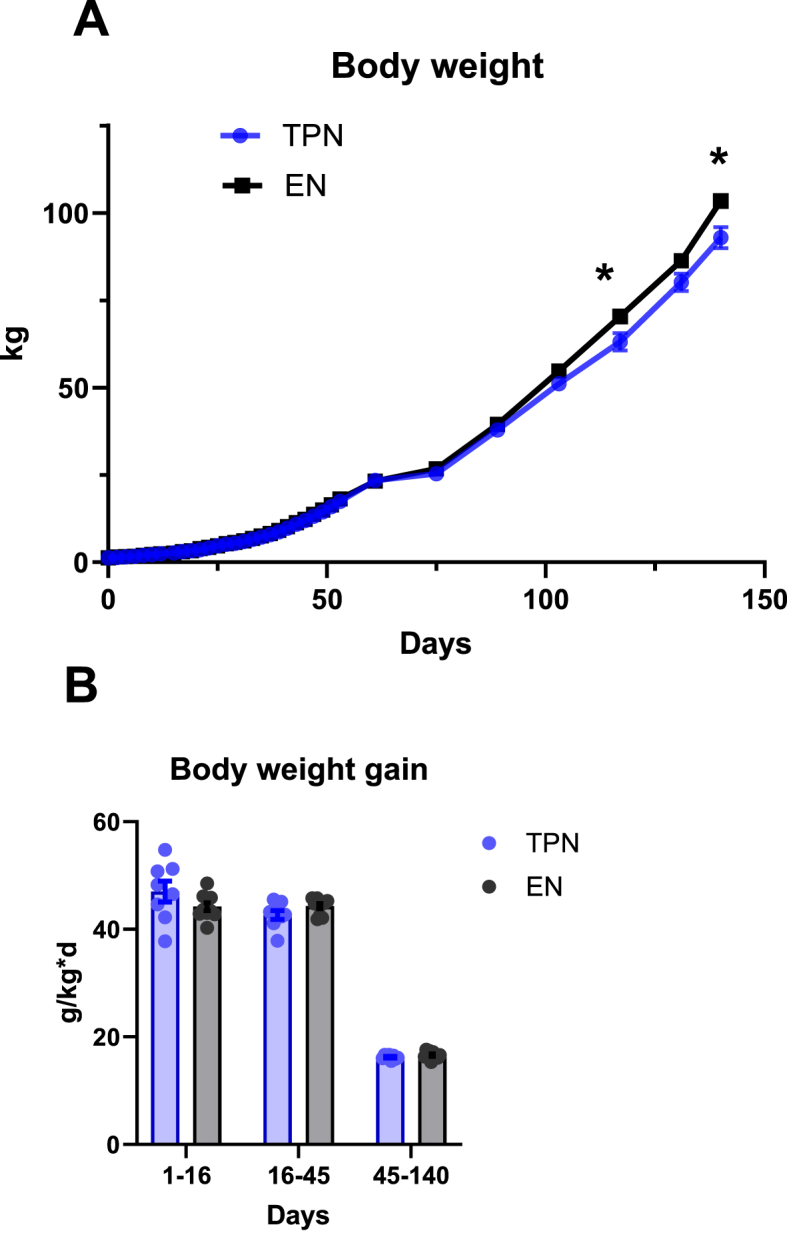
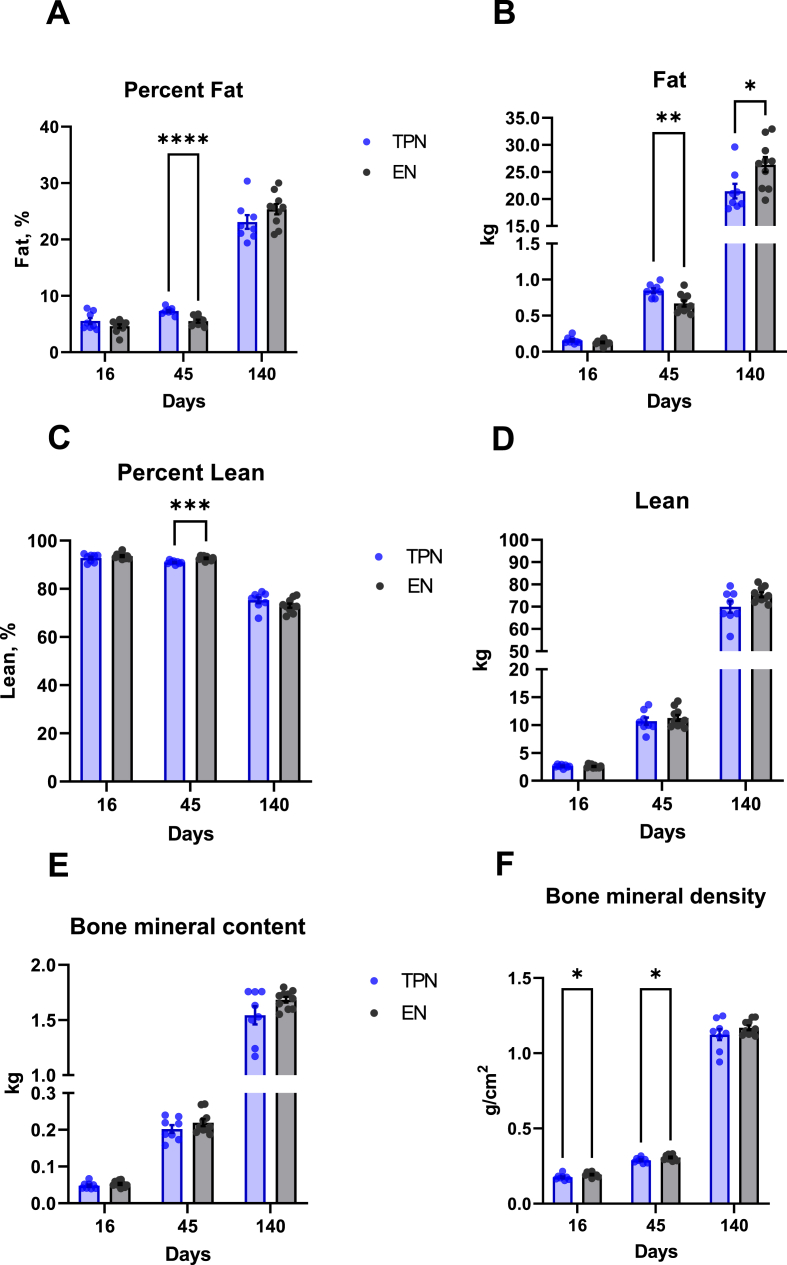
Results: Body weight was similar, but percent fat was higher, whereas percent lean and bone mineral density were lower in TPN than in EN pigs (P < 0.01) at 45 d of age but not at 140 d. At 140 d, there were no differences in serum markers of liver injury or lipidemia. Intravenous glucose tolerance test at 140 d showed a lower (P < 0.05) AUC for both glucose and insulin in TPN than in EN pigs, but the ratio of AUCs of insulin and glucose was not different between groups.
Conclusions: Administration of TPN during the neonatal period increased adipose deposition that transiently persisted in early adolescence when challenged with a high-fat diet but was not sustained or manifested as glucose intolerance.
Keywords: insulin resistance; neonatal programming; obesity; pig; total parenteral nutrition.
Published by Elsevier Inc.
Figures
Similar articles
-
Chronic parenteral nutrition induces hepatic inflammation, steatosis, and insulin resistance in neonatal pigs.J Nutr. 2010 Dec;140(12):2193-200. doi: 10.3945/jn.110.125799. Epub 2010 Oct 27. J Nutr. 2010. PMID: 20980637 Free PMC article.
-
Continuous parenteral and enteral nutrition induces metabolic dysfunction in neonatal pigs.JPEN J Parenter Enteral Nutr. 2012 Sep;36(5):538-50. doi: 10.1177/0148607112444756. Epub 2012 May 1. JPEN J Parenter Enteral Nutr. 2012. PMID: 22549765 Free PMC article.
-
Feeding Parenteral Nutrition in the Neonatal Period Programs Dyslipidemia in Adulthood in Yucatan Miniature Pigs.J Nutr. 2024 Nov;154(11):3353-3364. doi: 10.1016/j.tjnut.2024.08.031. Epub 2024 Sep 11. J Nutr. 2024. PMID: 39270853 Free PMC article.
-
Enteral feeding induces diet-dependent mucosal dysfunction, bacterial proliferation, and necrotizing enterocolitis in preterm pigs on parenteral nutrition.Am J Physiol Gastrointest Liver Physiol. 2008 Nov;295(5):G1092-103. doi: 10.1152/ajpgi.00414.2007. Epub 2008 Sep 25. Am J Physiol Gastrointest Liver Physiol. 2008. PMID: 18818317
-
Effects of artificial nutrition on the nutritional status of cancer patients.JPEN J Parenter Enteral Nutr. 1989 Jul-Aug;13(4):406-20. doi: 10.1177/0148607189013004406. JPEN J Parenter Enteral Nutr. 1989. PMID: 2506378 Review.
Cited by
-
AI-guided precision parenteral nutrition for neonatal intensive care units.Nat Med. 2025 Jun;31(6):1882-1894. doi: 10.1038/s41591-025-03601-1. Epub 2025 Mar 25. Nat Med. 2025. PMID: 40133525 Free PMC article.
References
-
- Groh-Wargo S., Barr S.M. Parenteral nutrition. Clin. Perinatol. 2022;49(2):355–379. - PubMed
-
- Ehrenkranz R.A., Dusick A.M., Vohr B.R., Wright L.L., Wrage L.A., Poole W.K. Growth in the neonatal intensive care unit influences neurodevelopmental and growth outcomes of extremely low birth weight infants. Pediatrics. 2006;117(4):1253–1261. - PubMed
-
- Ziegler E.E., Thureen P.J., Carlson S.J. Aggressive nutrition of the very low birthweight infant. Clin. Perinatol. 2002;29(2):225–244. - PubMed
Publication types
MeSH terms
Substances
Grants and funding
LinkOut - more resources
Full Text Sources
Medical
Research Materials
