

A viral insulin-like peptide inhibits IGF-1 receptor phosphorylation and regulates IGF1R gene expression
- PMID: 38182007
- PMCID: PMC10831276
- DOI: 10.1016/j.molmet.2023.101863
A viral insulin-like peptide inhibits IGF-1 receptor phosphorylation and regulates IGF1R gene expression
Abstract
Objective: The insulin/IGF superfamily is conserved across vertebrates and invertebrates. Our team has identified five viruses containing genes encoding viral insulin/IGF-1 like peptides (VILPs) closely resembling human insulin and IGF-1. This study aims to characterize the impact of Mandarin fish ranavirus (MFRV) and Lymphocystis disease virus-Sa (LCDV-Sa) VILPs on the insulin/IGF system for the first time.
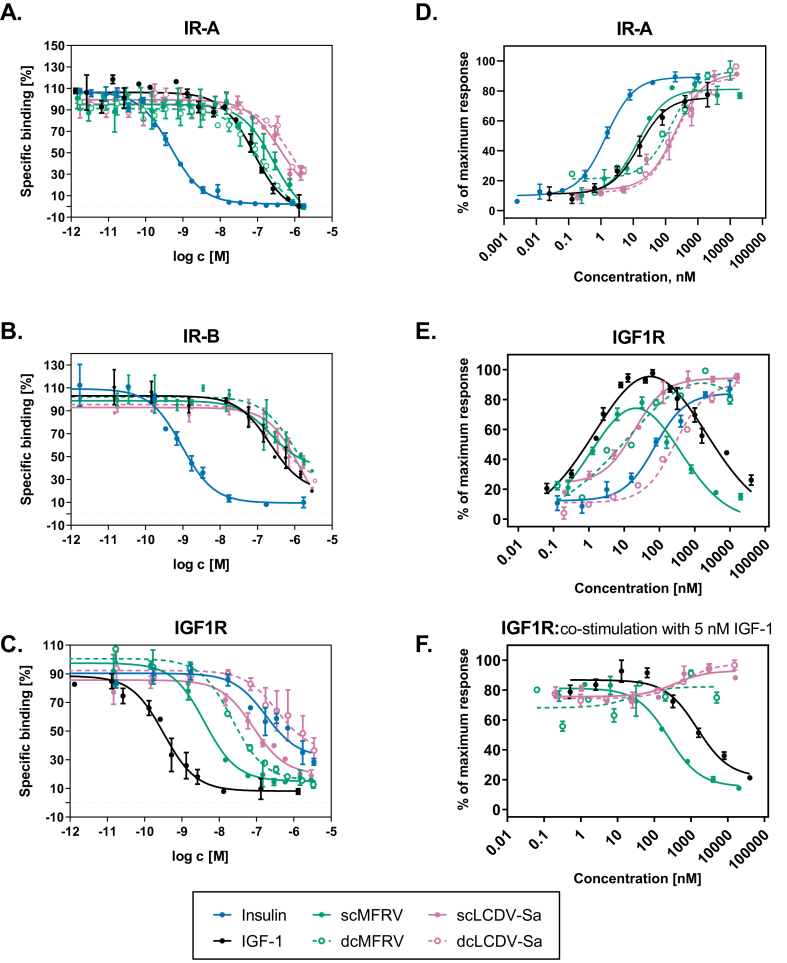
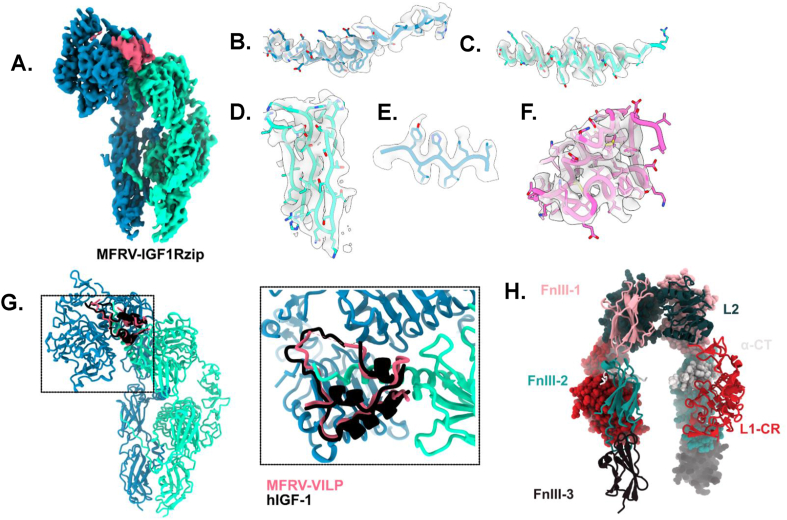
Methods: We chemically synthesized single chain (sc, IGF-1 like) and double chain (dc, insulin like) forms of MFRV and LCDV-Sa VILPs. Using cell lines overexpressing either human insulin receptor isoform A (IR-A), isoform B (IR-B) or IGF-1 receptor (IGF1R), and AML12 murine hepatocytes, we characterized receptor binding, insulin/IGF signaling. We further characterized the VILPs' effects of proliferation and IGF1R and IR gene expression, and compared them to native ligands. Additionally, we performed insulin tolerance test in CB57BL/6 J mice to examine in vivo effects of VILPs on blood glucose levels. Finally, we employed cryo-electron microscopy (cryoEM) to analyze the structure of scMFRV-VILP in complex with the IGF1R ectodomain.
Results: VILPs can bind to human IR and IGF1R, stimulate receptor autophosphorylation and downstream signaling pathways. Notably, scMFRV-VILP exhibited a particularly strong affinity for IGF1R, with a mere 10-fold decrease compared to human IGF-1. At high concentrations, scMFRV-VILP selectively reduced IGF-1 stimulated IGF1R autophosphorylation and Erk phosphorylation (Ras/MAPK pathway), while leaving Akt phosphorylation (PI3K/Akt pathway) unaffected, indicating a potential biased inhibitory function. Prolonged exposure to MFRV-VILP led to a significant decrease in IGF1R gene expression in IGF1R overexpressing cells and AML12 hepatocytes. Furthermore, insulin tolerance test revealed scMFRV-VILP's sustained glucose-lowering effect compared to insulin and IGF-1. Finally, cryo-EM analysis revealed that scMFRV-VILP engages with IGF1R in a manner closely resembling IGF-1 binding, resulting in a highly analogous structure.
Conclusions: This study introduces MFRV and LCDV-Sa VILPs as novel members of the insulin/IGF superfamily. Particularly, scMFRV-VILP exhibits a biased inhibitory effect on IGF1R signaling at high concentrations, selectively inhibiting IGF-1 stimulated IGF1R autophosphorylation and Erk phosphorylation, without affecting Akt phosphorylation. In addition, MFRV-VILP specifically regulates IGF-1R gene expression and IGF1R protein levels without affecting IR. CryoEM analysis confirms that scMFRV-VILP' binding to IGF1R is mirroring the interaction pattern observed with IGF-1. These findings offer valuable insights into IGF1R action and inhibition, suggesting potential applications in development of IGF1R specific inhibitors and advancing long-lasting insulins.
Keywords: Biased signaling; IGF-1; IGF1 receptor; IGF1 receptor inhibition; Insulin; Iridoviridae; Viral insulin/IGF-1 like peptides (VILPs).
Copyright © 2024 The Authors. Published by Elsevier GmbH.. All rights reserved.
Conflict of interest statement
Declaration of competing interest VG and RM are or were employees at Novo Nordisk. The other authors have no conflicts of interest to disclose related to this project.
Figures


Similar articles
-
Characterization of viral insulins reveals white adipose tissue-specific effects in mice.Mol Metab. 2021 Feb;44:101121. doi: 10.1016/j.molmet.2020.101121. Epub 2020 Nov 19. Mol Metab. 2021. PMID: 33220491 Free PMC article.
-
Interaction of a viral insulin-like peptide with the IGF-1 receptor produces a natural antagonist.Nat Commun. 2022 Nov 5;13(1):6700. doi: 10.1038/s41467-022-34391-6. Nat Commun. 2022. PMID: 36335114 Free PMC article.
-
Viral insulin/IGF-like peptides inhibit IGF-1 receptor signaling to enhance viral replication.Cell Rep. 2025 Aug 26;44(8):116149. doi: 10.1016/j.celrep.2025.116149. Epub 2025 Aug 18. Cell Rep. 2025. PMID: 40829596
-
The IGF-1 Signaling Pathway in Viral Infections.Viruses. 2021 Jul 29;13(8):1488. doi: 10.3390/v13081488. Viruses. 2021. PMID: 34452353 Free PMC article. Review.
-
The signaling landscape of insulin-like growth factor 1.J Biol Chem. 2025 Jan;301(1):108047. doi: 10.1016/j.jbc.2024.108047. Epub 2024 Dec 3. J Biol Chem. 2025. PMID: 39638246 Free PMC article. Review.
Cited by
-
Developmentally cascading structures do not lose evolutionary potential, but compound developmental instability in rat molars.bioRxiv [Preprint]. 2025 Jun 6:2025.01.13.632740. doi: 10.1101/2025.01.13.632740. bioRxiv. 2025. PMID: 39868330 Free PMC article. Preprint.
-
Exploration of the shared gene signatures and molecular mechanisms between Alzheimer's disease and intracranial aneurysm.Sci Rep. 2024 Oct 19;14(1):24628. doi: 10.1038/s41598-024-75694-6. Sci Rep. 2024. PMID: 39427050 Free PMC article.
-
Emerging Mechanisms and Biomarkers Associated with T-Cells and B-Cells in Autoimmune Disorders.Clin Rev Allergy Immunol. 2025 Feb 11;68(1):14. doi: 10.1007/s12016-025-09022-9. Clin Rev Allergy Immunol. 2025. PMID: 39932617 Review.
-
Identification of functional rare coding variants in IGF-1 gene in humans with exceptional longevity.bioRxiv [Preprint]. 2024 Oct 13:2024.10.11.617885. doi: 10.1101/2024.10.11.617885. bioRxiv. 2024. Update in: Sci Rep. 2025 Mar 25;15(1):10199. doi: 10.1038/s41598-025-94094-y. PMID: 39416202 Free PMC article. Updated. Preprint.
References
-
- Annunziata M., Granata R., Ghigo E. The IGF system. Acta Diabetol. 2011;48(1):1–9. - PubMed
-
- Denley A., Cosgrove L.J., Booker G.W., Wallace J.C., Forbes B.E. Molecular interactions of the IGF system. Cytokine Growth Factor Rev. 2005;16(4–5):421–439. - PubMed
-
- Mayer J.P., Zhang F., DiMarchi R.D. Insulin structure and function. Biopolymers. 2007;88(5):687–713. - PubMed
MeSH terms
Substances
Grants and funding
LinkOut - more resources
Full Text Sources
Miscellaneous
