. 2024 Feb 21;44(8):e1011232023.
doi: 10.1523/JNEUROSCI.1011-23.2023.

Low-Intensity Focused Ultrasound to the Human Dorsal Anterior Cingulate Attenuates Acute Pain Perception and Autonomic Responses

Affiliations

Low-Intensity Focused Ultrasound to the Human Dorsal Anterior Cingulate Attenuates Acute Pain Perception and Autonomic Responses

Andrew Strohman et al. J Neurosci. .

Abstract

The dorsal anterior cingulate cortex (dACC) is a critical brain area for pain and autonomic processing, making it a promising noninvasive therapeutic target. We leverage the high spatial resolution and deep focal lengths of low-intensity focused ultrasound (LIFU) to noninvasively modulate the dACC for effects on behavioral and cardiac autonomic responses using transient heat pain stimuli. A N = 16 healthy human volunteers (6 M/10 F) received transient contact heat pain during either LIFU to the dACC or Sham stimulation. Continuous electroencephalogram (EEG), electrocardiogram (ECG), and electrodermal response (EDR) were recorded. Outcome measures included pain ratings, heart rate variability, EDR response, blood pressure, and the amplitude of the contact heat-evoked potential (CHEP).LIFU reduced pain ratings by 1.09 ± 0.20 points relative to Sham. LIFU increased heart rate variability indexed by the standard deviation of normal sinus beats (SDNN), low-frequency (LF) power, and the low-frequency/high-frequency (LF/HF) ratio. There were no effects on the blood pressure or EDR. LIFU resulted in a 38.1% reduction in the P2 CHEP amplitude. Results demonstrate LIFU to the dACC reduces pain and alters autonomic responses to acute heat pain stimuli. This has implications for the causal understanding of human pain and autonomic processing in the dACC and potential future therapeutic options for pain relief and modulation of homeostatic signals.

Keywords: anterior cingulate; autonomic; contact heat; focused ultrasound; heart rate variability; pain.


Conflict of interest statement

The authors declare no competing financial interests.

Figures

Figure 1.
Figure 1.
Outline of acute contact heat pain testing. A, Participants completed two arms on separate days: inactive Sham and low-intensity focused ultrasound (LIFU) to the dorsal anterior cingulate cortex (dACC). For each session, data collection was divided into three time windows: A 5 min baseline, 10 min of acute contact heat testing, and a 5 min rest period. Contact heat pain testing consisted of 40 stimuli (see B) delivered to the dorsum of the right hand with a random inter-stimulus interval (ISI) of 10–20 s. Continuous electroencephalogram (EEG), electrocardiogram (ECG), and electrodermal response (EDR) were recorded throughout all time windows. Auditory masking was delivered continuously over the contact heat testing period for both conditions. B, Blow-up of orange bar in A showing details of contact heat stimulus and timing and parameters of low-intensity focused ultrasound (LIFU). The contact heat stimulus lasted 300 msec and was titrated to a 5/9 on a numerical pain rating scale. One second of LIFU was time locked to the contact heat stimulus, beginning 200 milliseconds (ms) prior to contact heat (0 ms) and ending 800 ms after. LIFU was delivered with a fundamental frequency of 500 kHz, a pulse repetition frequency (PRF) of 1 kHz, a duty cycle (DC) of 36%, and a total burst duration of 1 s. Refer to Figure 9 for individual subject results of the Auditory Masking Questionnaire (AMQ). Refer to Figure 10 for the Report of Symptoms questionnaire that illustrates reported adverse events for both LIFU and Sham conditions.
Figure 2.
Figure 2.
Transducer characteristics and acoustic modeling. A, Pseudo-color free water XY lateral beam pressure at Z maximum of the 500 kHz single-element transducer measured in kilopascals (kPa). B, Pseudo-color free water YZ axial beam pressure. The transducer face is at Z = 0 mm. C, Full-width half maximum (FWHM) overlay of the empirically measured YZ axial beam in acoustic test tank (blue) and the modeled beam (red) used for acoustic modeling. D, Acoustic modeling results using individual MRI and CT scans from a single representative subject. From left to right: Coronal view depicting left (L) and right (R) directions. Sagittal view depicting posterior (P) and anterior (A) directions. Transverse cross-section taken from the white line in the coronal and sagittal views.
Figure 3.
Figure 3.
Targeting error. A, (Top) Mean ± standard deviation (SD) targeting error distance of the transducer on the scalp in millimeters (mm) for each subject in the Sham condition. Subject 8 in the Sham condition shows high variability due to loss of data. (Bottom) Mean ± SD targeting error distance in millimeters (mm) for each subject in the low-intensity focused ultrasound (LIFU) to the dorsal anterior cingulate (dACC) condition. B, Group (N = 16) histogram of the absolute targeting error (mm) for both Sham (blue) and LIFU to dACC (red) conditions. The x-axis is targeting error in 0.5 mm bins.
Figure 4.
Figure 4.
Effect of LIFU to dACC on pain ratings. A, Group (N = 16) mean ± SEM pain ratings (0–9 scale). Red lines are individual subject data. Asterisk indicates significant difference between conditions at p < 0.0001. B, Group (N = 16) mean ± SEM pain ratings across 40 trials for Sham (blue) and low-intensity focused ultrasound (LIFU) to the dorsal anterior cingulate (dACC) (red). Thin lines and shaded regions are the mean ± SEM for individual trials. Thick lines represent five-trial averages.
Figure 5.
Figure 5.
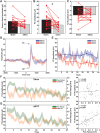
Effect of LIFU to the dACC on time domain autonomic responses. The y-axes for each normalized metric (A–E) are the respective metrics during contact heat-evoked potential (CHEP) testing normalized to values during the 5 min baseline period. Horizontal dashed black lines represent the pre-task baseline. A, Group (N = 16) mean ± SEM normalized standard deviation of normal sinus beats (SDNN). Red lines represent individual subject data. Asterisk indicates significant differences between conditions at p < 0.01. B, Group (N = 16) mean ± SEM normalized CV. Red lines represent individual subject data. C, Group (N = 16) mean ± SEM normalized mean normal sinus difference (MNN). D, Group (N = 16) mean ± SEM normalized root mean square of successive differences (RMSSD). E, Group (N = 16) mean ± SEM normalized proportion of normal sinus differences greater than 50 ms (pNN50). F, Group (N = 16) mean ± SEM electrodermal response (EDR). Y-axis is amplitude in microsiemens (μS).
Figure 6.
Figure 6.
Effect of LIFU to the dACC on frequency-domain autonomic responses. The y-axes for each normalized metric are the respective powers during contact heat-evoked potential (CHEP) testing normalized to powers during the 5 min baseline period. Horizontal dashed black lines represent the pre-task baseline. A, Group (N = 16) mean ± SEM normalized low-frequency (LF) power. Red lines represent individual subject data. Asterisk indicates significant differences between conditions at p < 0.001. B, Group (N = 16) mean ± SEM normalized high-frequency (HF) power. C, Group (N = 16) mean ± SEM normalized low-frequency/high-frequency (LF/HF) ratio. Red lines represent individual subject data. Asterisk indicates significant differences between conditions at p < 0.01. D, Group (N = 16) mean ± SEM normalized heart rate variability (HRV) power. X-axis is frequency in hertz (Hz) and y-axis is normalized power. Lines and shaded regions represent the mean ± SEM for Sham (blue) and low-intensity focused ultrasound (LIFU) to the dorsal anterior cingulate (dACC) (red) conditions. Black vertical bars represent significant differences between conditions at p < 0.05. Dashed vertical black line at 0.15 on the x-axis delineates LF (0.04–0.15) and HF (0.15–0.4) power.
Figure 7.
Figure 7.
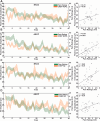
Effect of LIFU to the dACC on CHEP amplitudes. A, Group (N = 16) mean ± SEM N2-P2 peak-to-peak contact heat-evoked potential (CHEP) amplitude. Red lines are individual subject data. B, Group (N = 16) mean ± SEM P2 CHEP amplitude. Red lines are individual subject data. Asterisk denotes a significant difference between groups at p < 0.05. C, Group (N = 16) mean ± SEM N2 CHEP amplitude. Red lines are individual subject data. D, Group (N = 16) mean ± SEM CHEP trace for Sham (blue) and low-intensity focused ultrasound (LIFU) to the dorsal anterior cingulate (dACC) (red) conditions. Amplitude is in microvolts (μV). Time 0 ms represents delivery of contact heat stimulus to the dorsum of the right hand. Arrows point to N2 and P2 peaks. E, Group (N = 16) mean ± SEM P2 CHEP amplitude across the 40 trials for Sham (blue) and LIFU to dACC (red). Thin lines and shaded regions are the mean ± SEM amplitudes for each of the 40 trials. Thick lines and dots represent five-trial averages. F, (Left) Group (N = 16) mean ± SEM P2 amplitudes in orange and pain ratings in green across the 40 trials for the Sham condition. (Right) Group (N = 16) scatter plot depicting the correlation between the P2 amplitude and pain ratings across trials for the Sham condition. r = correlation coefficient, p = p-value, black line = least-squares line. G, (Left) Group (N = 16) mean ± SEM P2 amplitudes in orange and pain ratings in green across the 40 trials for the LIFU to dACC condition. (Right) Group (N = 16) scatter plot depicting the correlation between the P2 amplitude and pain ratings across trials for the LIFU to dACC condition. r = correlation coefficient, p = p-value, black line = least-squares line.
Figure 8.
Figure 8.
Correlation of CHEP amplitudes and pain ratings. A, (left) Group (N = 16) mean ± SEM N2-P2 peak-to-peak contact heat-evoked potential (CHEP) amplitudes (orange) and pain ratings (green) across the 40 trials for the Sham condition. (Right) Group (N = 16) scatter plot depicting the correlation between the N2-P2 peak-to-peak CHEP amplitude and pain ratings across trials for the Sham condition. r = correlation coefficient, p = p-value, black line = least-squares line. B, (left) Group (N = 16) mean ± SEM N2-P2 peak-to-peak amplitudes (orange) and pain ratings (green) across the 40 trials for the low-intensity focused ultrasound (LIFU) to the dorsal anterior cingulate (dACC) condition. (right) Group (N = 16) scatter plot depicting the correlation between the N2-P2 peak-to-peak CHEP amplitude and pain ratings across trials for the LIFU to dACC condition. r = correlation coefficient, p = p-value, black line = least-squares line. C, (left) Group (N = 16) mean ± SEM N2 amplitude (orange) and pain ratings (green) across the 40 trials for the Sham condition. (right) Group (N = 16) scatter plot depicting the correlation between the N2 amplitude and pain ratings across trials for the Sham condition. r = correlation coefficient, p = p-value, black line = least-squares line. D, (left) Group (N = 16) mean ± SEM N2 amplitude (orange) and pain ratings (green) across the 40 trials for the LIFU to dACC condition. (right) Group (N = 16) scatter plot depicting the correlation between the N2 amplitude and pain ratings across trials for the LIFU to dACC condition. r = correlation coefficient, p = p-value, black line = least-squares line.
Figure 9.
Figure 9.
Individual subject auditory query results. A, Individual subject results between Sham (blue) and low-intensity focused ultrasound (LIFU) to the dorsal anterior cingulate (dACC) (red) conditions for the question “I could hear the LIFU stimulation.” B, Individual subject results between Sham (black) and LIFU to dACC (gray) conditions for the question “I believe I experienced LIFU stimulation.” C, Individual subject results between Sham (black) and LIFU to dACC (gray) conditions for the question “I could feel the LIFU stimulation.” The participants on the x-axis are in the same order for all three questions.
Figure 10.
Figure 10.
Report of symptoms questionnaire results. Report of symptoms was administered before and after contact heat testing for both conditions. The presence of symptoms for each participant after contact heat testing were adjusted for the presence of symptoms prior to contact heat testing by taking the pre-post difference. Each bar represents the total count for the presence of each symptom and severity across all participants (N = 16). No change or improvement in symptoms is represented as absent. A, Presence of symptoms in the Sham condition. B, Presence of symptoms in the low-intensity focused ultrasound (LIFU) to the dorsal anterior cingulate (dACC) condition.

Similar articles

Cited by

References

    1. Apkarian AV, Hodge CJ (1989) Primate spinothalamic pathways: III. Thalamic terminations of the dorsolateral and ventral spinothalamic pathways. J Comp Neurol 288:493–511. 10.1002/cne.902880309 - DOI - PubMed
    1. Aubry J-F, Tanter M, Pernot M, Thomas J-L, Fink M (2003) Experimental demonstration of noninvasive transskull adaptive focusing based on prior computed tomography scans. J Acoust Soc Am 113:84–93. 10.1121/1.1529663 - DOI - PubMed
    1. Auvichayapat P, Keeratitanont K, Janyachareon T, Auvichayapat N (2018) The effects of transcranial direct current stimulation on metabolite changes at the anterior cingulate cortex in neuropathic pain: a pilot study. J Pain Res 11:2301–2309. 10.2147/JPR.S172920 - DOI - PMC - PubMed
    1. Bantick SJ, Wise RG, Ploghaus A, Clare S, Smith SM, Tracey I (2002) Imaging how attention modulates pain in humans using functional MRI. Brain 125:310–319. 10.1093/brain/awf022 - DOI - PubMed
    1. Bastuji H, Frot M, Perchet C, Magnin M, Garcia-Larrea L (2016) Pain networks from the inside: spatiotemporal analysis of brain responses leading from nociception to conscious perception. Hum Brain Mapp 37:4301–4315. 10.1002/hbm.23310 - DOI - PMC - PubMed

Publication types

LinkOut - more resources