

Coexpressed δ-, μ-, and κ-Opioid Receptors Modulate Voltage-Gated Ca2+ Channels in Gastric-Projecting Vagal Afferent Neurons
- PMID: 38182431
- PMCID: PMC10877734
- DOI: 10.1124/molpharm.123.000774
Coexpressed δ-, μ-, and κ-Opioid Receptors Modulate Voltage-Gated Ca2+ Channels in Gastric-Projecting Vagal Afferent Neurons
Abstract
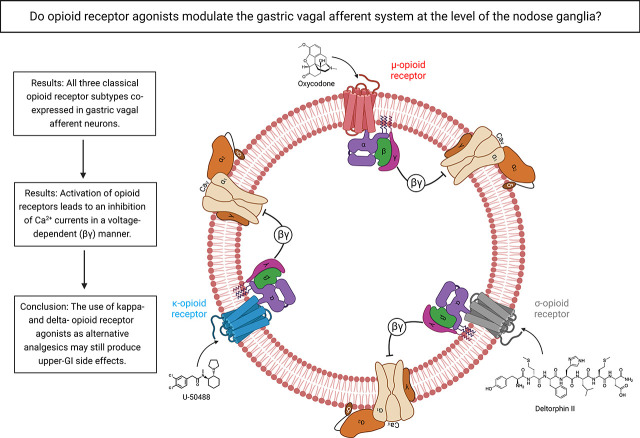
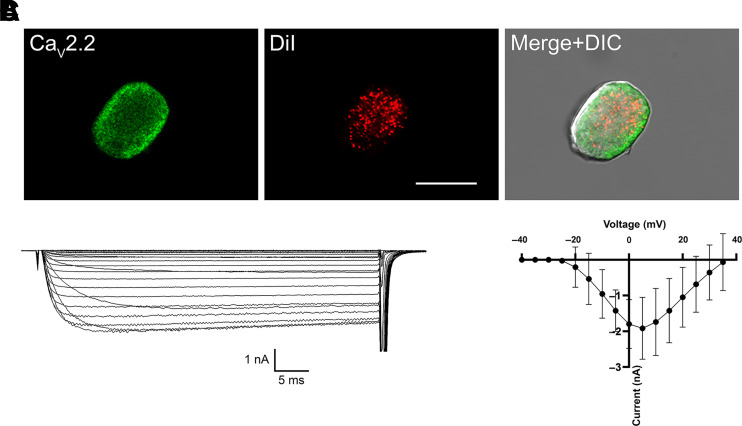
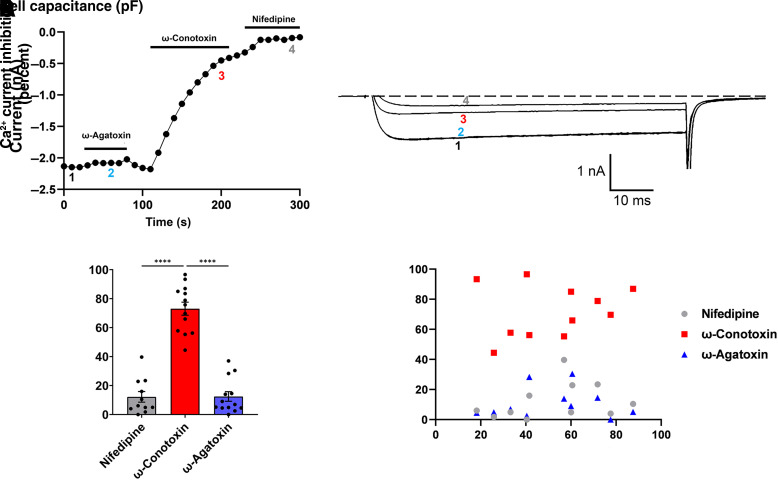
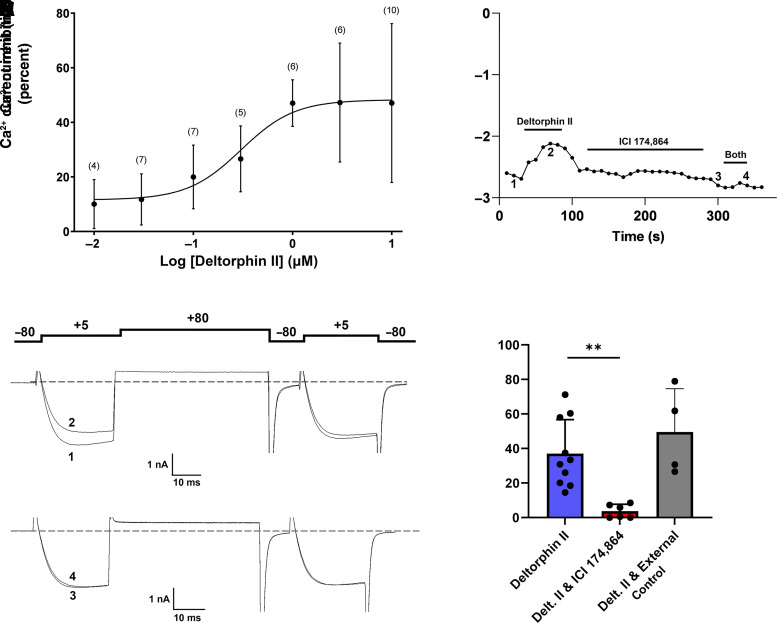
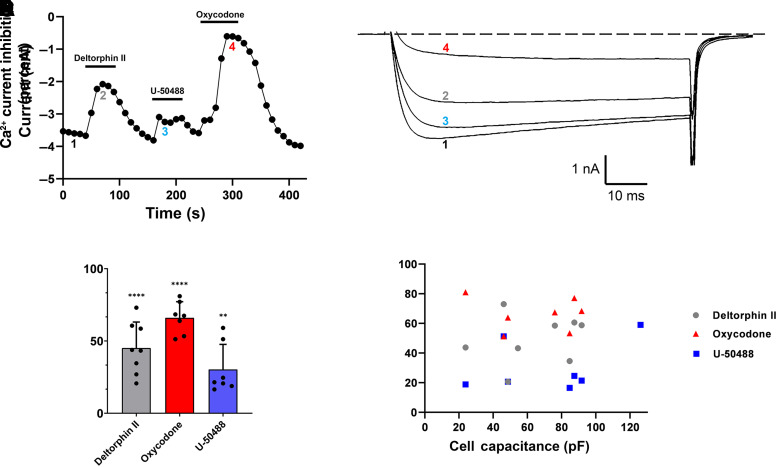
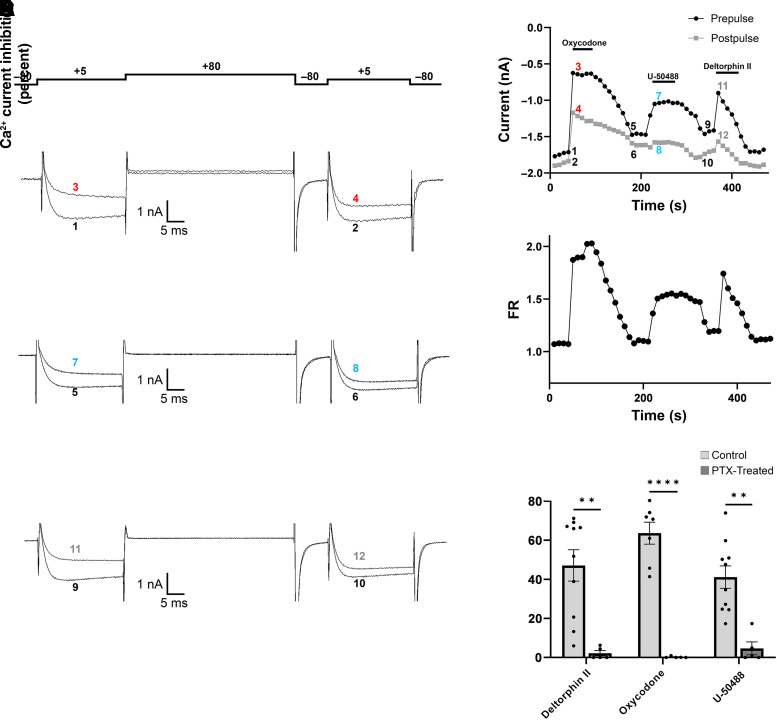
Opioid analgesics are frequently associated with gastrointestinal side effects, including constipation, nausea, dysphagia, and reduced gastric motility. Though it has been shown that stimulation of opioid receptors expressed in enteric motor neurons contributes to opioid-induced constipation, it remains unclear whether activation of opioid receptors in gastric-projecting nodose ganglia neurons contributes to the reduction in gastric motility and emptying associated with opioid use. In the present study, whole-cell patch-clamp recordings were performed to determine the mechanism underlying opioid receptor-mediated modulation of Ca2+ currents in acutely isolated gastric vagal afferent neurons. Our results demonstrate that CaV2.2 channels provide the majority (71% ± 16%) of Ca2+ currents in gastric vagal afferent neurons. Furthermore, we found that application of oxycodone, U-50488, or deltorphin II on gastric nodose ganglia neurons inhibited Ca2+ currents through a voltage-dependent mechanism by coupling to the Gα i/o family of heterotrimeric G-proteins. Because previous studies have demonstrated that the nodose ganglia expresses low levels of δ-opioid receptors, we also determined the deltorphin II concentration-response relationship and assessed deltorphin-mediated Ca2+ current inhibition following exposure to the δ-opioid receptor antagonist ICI 174,864 (0.3 µM). The peak mean Ca2+ current inhibition following deltorphin II application was 47% ± 24% (EC50 = 302.6 nM), and exposure to ICI 174,864 blocked deltorphin II-mediated Ca2+ current inhibition (4% ± 4% versus 37% ± 20%). Together, our results suggest that analgesics targeting any opioid receptor subtype can modulate gastric vagal circuits. SIGNIFICANCE STATEMENT: This study demonstrated that in gastric nodose ganglia neurons, agonists targeting all three classical opioid receptor subtypes (μ, δ, and κ) inhibit voltage-gated Ca2+ channels in a voltage-dependent mechanism by coupling to Gαi/o. These findings suggest that analgesics targeting any opioid receptor subtype would modulate gastric vagal circuits responsible for regulating gastric reflexes.
Copyright © 2024 by The American Society for Pharmacology and Experimental Therapeutics.
Figures
Similar articles
-
Voltage-Gated R-Type Calcium Channel Inhibition via Human μ-, δ-, and κ-opioid Receptors Is Voltage-Independently Mediated by Gβγ Protein Subunits.Mol Pharmacol. 2016 Jan;89(1):187-96. doi: 10.1124/mol.115.101154. Epub 2015 Oct 21. Mol Pharmacol. 2016. PMID: 26490245
-
Mu- and kappa-opioid receptors selectively reduce the same transient components of high-threshold calcium current in rat dorsal root ganglion sensory neurons.J Neurosci. 1994 Oct;14(10):5903-16. doi: 10.1523/JNEUROSCI.14-10-05903.1994. J Neurosci. 1994. PMID: 7931552 Free PMC article.
-
Distinct inhibition of voltage-activated Ca2+ channels by delta-opioid agonists in dorsal root ganglion neurons devoid of functional T-type Ca2+ currents.Neuroscience. 2008 Jun 2;153(4):1256-67. doi: 10.1016/j.neuroscience.2008.03.031. Epub 2008 Mar 22. Neuroscience. 2008. PMID: 18434033
-
Insights into the Role of Opioid Receptors in the GI Tract: Experimental Evidence and Therapeutic Relevance.Handb Exp Pharmacol. 2017;239:363-378. doi: 10.1007/164_2016_116. Handb Exp Pharmacol. 2017. PMID: 28204957 Free PMC article. Review.
-
Cough sensors. III. Opioid and cannabinoid receptors on vagal sensory nerves.Handb Exp Pharmacol. 2009;(187):63-76. doi: 10.1007/978-3-540-79842-2_4. Handb Exp Pharmacol. 2009. PMID: 18825336 Review.
Cited by
-
Oxycodone vs the Combination of Fentanyl and Remifentanil for General Anesthesia in Laparoscopic Uterine Myomas Surgery: A Prospective, Randomized, Controlled Study.Drug Des Devel Ther. 2025 Jun 9;19:4979-4990. doi: 10.2147/DDDT.S524102. eCollection 2025. Drug Des Devel Ther. 2025. PMID: 40521011 Free PMC article. Clinical Trial.
-
The interplay between the microbiota and opioid in the treatment of neuropathic pain.Front Microbiol. 2024 Jun 10;15:1390046. doi: 10.3389/fmicb.2024.1390046. eCollection 2024. Front Microbiol. 2024. PMID: 38919504 Free PMC article. Review.
-
Ghrelin Modulates Voltage-Gated Ca2+ Channels through Voltage-Dependent and Voltage-Independent Pathways in Rat Gastric Vagal Afferent Neurons.Mol Pharmacol. 2024 Oct 17;106(5):253-263. doi: 10.1124/molpharm.124.000957. Mol Pharmacol. 2024. PMID: 39187389
-
Gut sensory neurons as regulators of neuro-immune-microbial interactions: from molecular mechanisms to precision therapy for IBD/IBS.J Neuroinflammation. 2025 Jul 2;22(1):172. doi: 10.1186/s12974-025-03500-9. J Neuroinflammation. 2025. PMID: 40605050 Free PMC article. Review.
References
-
- Algera MH, Kamp J, van der Schrier R, van Velzen M, Niesters M, Aarts L, Dahan A, Olofsen E (2019) Opioid-induced respiratory depression in humans: a review of pharmacokinetic-pharmacodynamic modelling of reversal. Br J Anaesth 122:e168–e179. - PubMed
-
- Bauer AJ, Sarr MG, Szurszewski JH (1991) Opioids inhibit neuromuscular transmission in circular muscle of human and baboon jejunum. Gastroenterology 101:970–976. - PubMed
-
- Bell TJ, Panchal SJ, Miaskowski C, Bolge SC, Milanova T, Williamson R (2009) The prevalence, severity, and impact of opioid-induced bowel dysfunction: results of a US and European Patient Survey (PROBE 1). Pain Med 10:35–42. - PubMed
-
- Bhandari P, Bingham S, Andrews PL (1992) The neuropharmacology of loperamide-induced emesis in the ferret: the role of the area postrema, vagus, opiate and 5-HT3 receptors. Neuropharmacology 31:735–742. - PubMed
MeSH terms
Substances
Grants and funding
LinkOut - more resources
Full Text Sources
Research Materials
Miscellaneous