

Do current pregnancy weight gain guidelines balance risks of adverse maternal and child health in a United States cohort?
- PMID: 38182445
- PMCID: PMC10884606
- DOI: 10.1016/j.ajcnut.2023.10.015
Do current pregnancy weight gain guidelines balance risks of adverse maternal and child health in a United States cohort?
Abstract
Background: The Institute of Medicine pregnancy weight gain guidelines were developed without evidence linking high weight gain to maternal cardiometabolic disease and child obesity. The upper limit of current recommendations may be too high for the health of the pregnant individual and child.
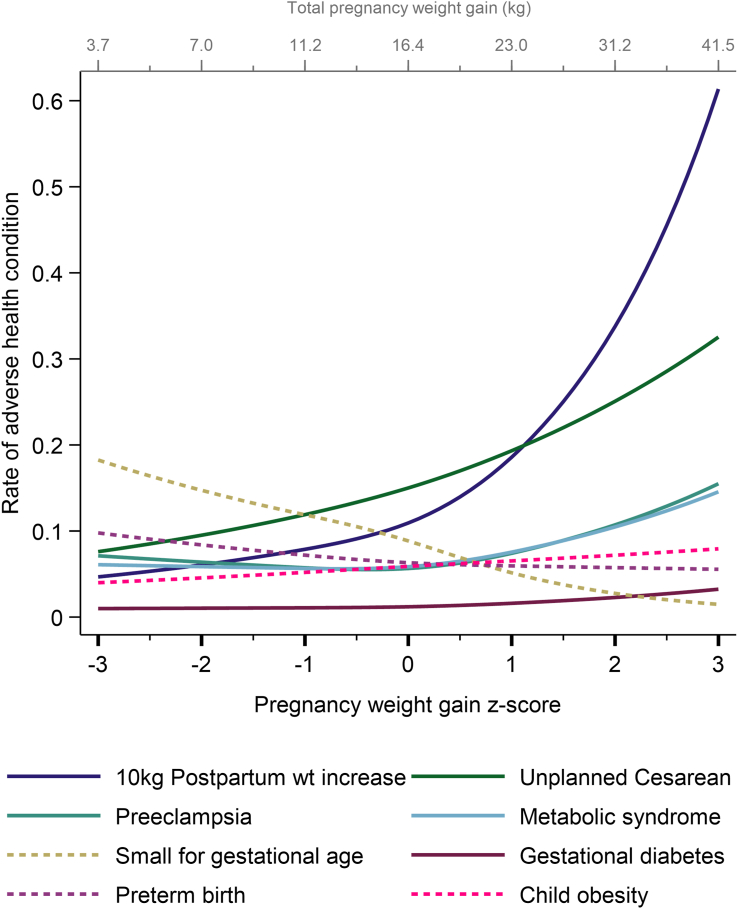
Objectives: The aim of this study was to identify the range of pregnancy weight gain for pregnancies within a normal body mass index (BMI) range that balances the risks of high and low weight gain by simultaneously considering 10 different health conditions.
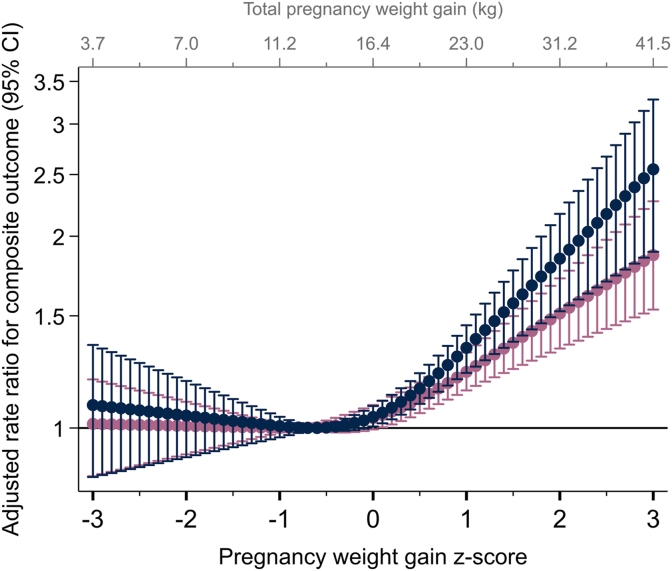
Methods: We used data from an United States prospective cohort study of nulliparae followed until 2 to 7 y postpartum (N = 2344 participants with a normal BMI). Pregnancy weight gain z-score was the main exposure. The outcome was a composite consisting of the occurrence of ≥1 of 10 adverse health conditions that were weighted for their seriousness. We used multivariable Poisson regression to relate weight gain z-scores with the weighted composite outcome.
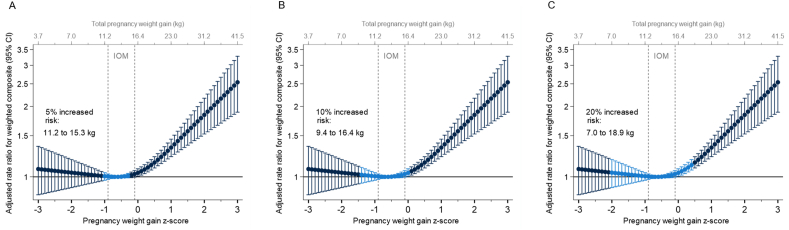
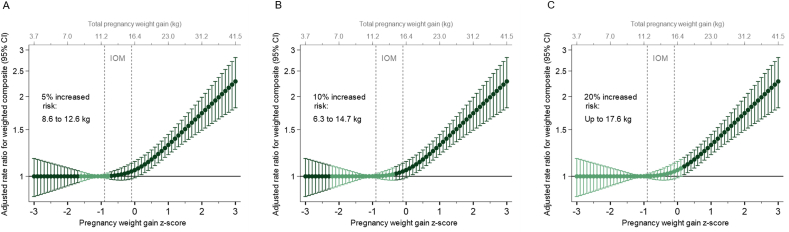
Results: The lowest risk of the composite outcome was at a pregnancy weight gain z-score of -0.6 SD (standard deviation) (equivalent to 13.1 kg at 40 wk). The weight gain ranges associated with no more than 5%, 10%, and 20% increase in risks were -1.0 to -0.2 SD (11.2-15.3 kg), -1.4 to 0 SD (9.4-16.4 kg), and -2.0 to 0.4 SD (7.0-18.9 kg). When we used a lower threshold to define postpartum weight increase in the composite outcome (>5 kg compared with >10 kg), the ranges were 1.6 to -0.7 SD (8.9-12.6 kg), -2.2 to -0.3 SD (6.3-14.7 kg), and ≤0.2 SD (≤17.6 kg). Compared with the ranges of the current weight gain guidelines (-0.9 to -0.1 SD, 11.5-16 kg), the lower limits from our data tended to be lower while upper limits were similar or lower.
Conclusions: If replicated, our results suggest that policy makers should revisit the recommended pregnancy weight gain range for individuals within a normal BMI range.
Keywords: child health; guidelines; maternal health; obesity; obstetrics; pregnancy; public health recommendations.
Copyright © 2023 American Society for Nutrition. Published by Elsevier Inc. All rights reserved.
Figures
Comment in
-
Gestational weight gain and global health standards: insights, challenges, and future directions.Am J Clin Nutr. 2024 Feb;119(2):246-247. doi: 10.1016/j.ajcnut.2023.11.022. Epub 2023 Dec 29. Am J Clin Nutr. 2024. PMID: 38309823 No abstract available.
Similar articles
-
Safety of low weight gain or weight loss in pregnancies with class 1, 2, and 3 obesity: a population-based cohort study.Lancet. 2024 Apr 13;403(10435):1472-1481. doi: 10.1016/S0140-6736(24)00255-1. Epub 2024 Mar 28. Lancet. 2024. PMID: 38555927 Free PMC article.
-
Pregnancy weight gain in twin gestations and maternal and child health outcomes at 5 years.Int J Obes (Lond). 2021 Jul;45(7):1382-1391. doi: 10.1038/s41366-021-00792-8. Epub 2021 Mar 3. Int J Obes (Lond). 2021. PMID: 33658683 Free PMC article.
-
Association of Optimal Gestational Weight Gain Ranges With Perinatal Outcomes Across Body Mass Index Categories in Twin Pregnancies.JAMA Netw Open. 2022 Jul 1;5(7):e2222537. doi: 10.1001/jamanetworkopen.2022.22537. JAMA Netw Open. 2022. PMID: 35852802 Free PMC article.
-
Gestational weight gain during the second and third trimesters and adverse pregnancy outcomes, results from a prospective pregnancy cohort in urban Tanzania.Reprod Health. 2022 Jun 16;19(1):140. doi: 10.1186/s12978-022-01441-7. Reprod Health. 2022. PMID: 35710384 Free PMC article. Clinical Trial.
-
Weight gain during pregnancy: A narrative review on the recent evidences.Diabetes Res Clin Pract. 2022 Jun;188:109913. doi: 10.1016/j.diabres.2022.109913. Epub 2022 May 11. Diabetes Res Clin Pract. 2022. PMID: 35568262 Review.
Cited by
-
Safety of low weight gain or weight loss in pregnancies with class 1, 2, and 3 obesity: a population-based cohort study.Lancet. 2024 Apr 13;403(10435):1472-1481. doi: 10.1016/S0140-6736(24)00255-1. Epub 2024 Mar 28. Lancet. 2024. PMID: 38555927 Free PMC article.
-
Gestational weight gain below recommendations and adverse maternal and child health outcomes for pregnancies with overweight or obesity: a United States cohort study.Am J Clin Nutr. 2024 Sep;120(3):638-647. doi: 10.1016/j.ajcnut.2024.06.011. Epub 2024 Jun 26. Am J Clin Nutr. 2024. PMID: 38942117 Free PMC article.
-
Association between gestational age-specific weight gain in pregnancy and risk of adverse perinatal outcomes: a secondary analysis of the INTERBIO-21st Fetal Study.Am J Clin Nutr. 2025 Jun;121(6):1304-1314. doi: 10.1016/j.ajcnut.2025.04.012. Epub 2025 Apr 16. Am J Clin Nutr. 2025. PMID: 40250762 Free PMC article.
-
Relationship between gestational body mass index, blood pressure variability, and postpartum depression in pregnant women with pre-eclampsia.World J Psychiatry. 2024 Dec 19;14(12):1868-1875. doi: 10.5498/wjp.v14.i12.1868. eCollection 2024 Dec 19. World J Psychiatry. 2024. PMID: 39704358 Free PMC article.
-
Estimating energy requirements from Dietary Reference Intakes for pregnant people with obesity using wearables.Obesity (Silver Spring). 2025 May;33(5):870-878. doi: 10.1002/oby.24256. Epub 2025 Mar 12. Obesity (Silver Spring). 2025. PMID: 40074993
References
-
- Institute of Medicine . National Academies Press; Washington, DC: 2009. Weight Gain During Pregnancy: Reexamining the Guidelines. - PubMed
-
- Hutcheon J.A., Stephansson O., Cnattingius S., Bodnar L.M., Wikström A.K., Johansson K. Pregnancy weight gain before diagnosis and risk of preeclampsia: a population-based cohort study in nulliparous women. Hypertension. 2018;72(2):433–441. doi: 10.1161/HYPERTENSIONAHA.118.10999. - DOI - PMC - PubMed
-
- Fraser A., Tilling K., Macdonald-Wallis C., Hughes R., Sattar N., Nelson S.M., et al. Associations of gestational weight gain with maternal body mass index, waist circumference, and blood pressure measured 16 y after pregnancy: the Avon Longitudinal Study of Parents and Children (ALSPAC) Am. J. Clin. Nutr. 2011;93(6):1285–1292. doi: 10.3945/ajcn.110.008326. - DOI - PMC - PubMed
Publication types
MeSH terms
Grants and funding
- U10 HL119990/HL/NHLBI NIH HHS/United States
- U10 HL119991/HL/NHLBI NIH HHS/United States
- U10 HL120006/HL/NHLBI NIH HHS/United States
- U10 HD063041/HD/NICHD NIH HHS/United States
- U10 HD063046/HD/NICHD NIH HHS/United States
- U10 HD063020/HD/NICHD NIH HHS/United States
- U10 HD063053/HD/NICHD NIH HHS/United States
- UL1 TR001108/TR/NCATS NIH HHS/United States
- UL1 TR000153/TR/NCATS NIH HHS/United States
- U10 HD063072/HD/NICHD NIH HHS/United States
- U10 HL120018/HL/NHLBI NIH HHS/United States
- U10 HD063048/HD/NICHD NIH HHS/United States
- U10 HD063047/HD/NICHD NIH HHS/United States
- UL1 TR000439/TR/NCATS NIH HHS/United States
- UL1 TR000124/TR/NCATS NIH HHS/United States
- U10 HD063037/HD/NICHD NIH HHS/United States
- U10 HD063036/HD/NICHD NIH HHS/United States
- UG1 HD087192/HD/NICHD NIH HHS/United States
- R01 HD094777/HD/NICHD NIH HHS/United States
- U10 HL119993/HL/NHLBI NIH HHS/United States
- U10 HL120034/HL/NHLBI NIH HHS/United States
- UL1 TR001881/TR/NCATS NIH HHS/United States
- U10 HL119989/HL/NHLBI NIH HHS/United States
- U10 HL120019/HL/NHLBI NIH HHS/United States
- U10 HL119992/HL/NHLBI NIH HHS/United States
LinkOut - more resources
Full Text Sources
Medical
