. 2024 Jan 5;10(1):5.
doi: 10.1038/s41420-023-01768-5.

BRCA1 mutation promotes sprouting angiogenesis in inflammatory cancer-associated fibroblast of triple-negative breast cancer

Affiliations

BRCA1 mutation promotes sprouting angiogenesis in inflammatory cancer-associated fibroblast of triple-negative breast cancer

Chae Min Lee et al. Cell Death Discov. .

Abstract

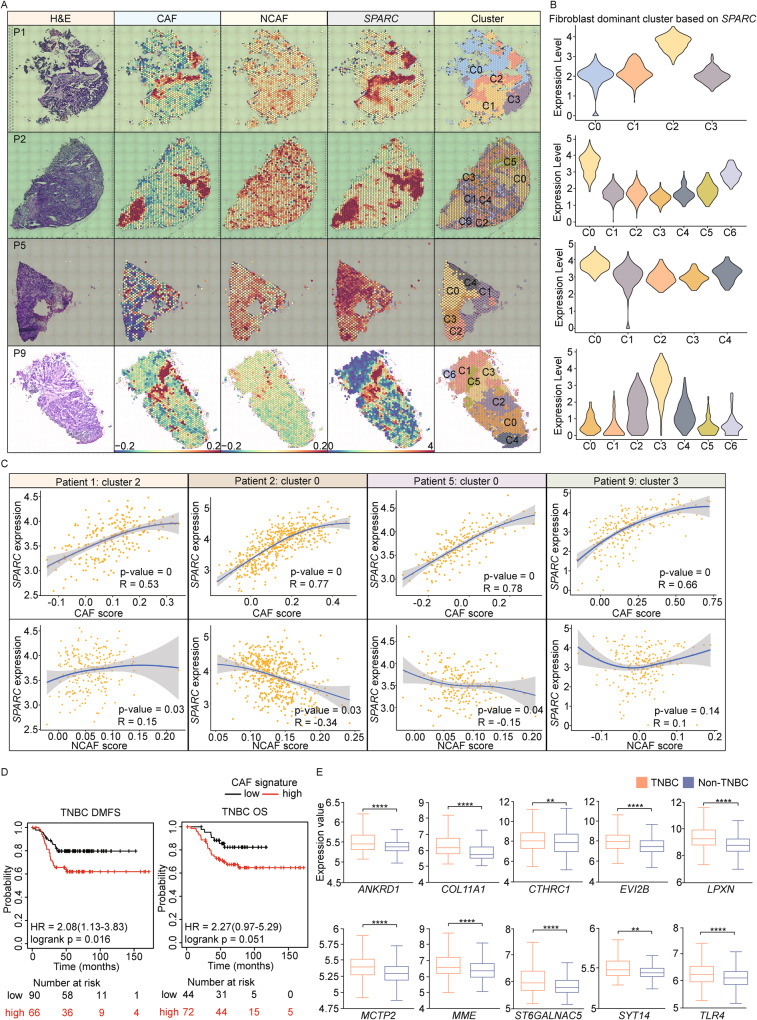
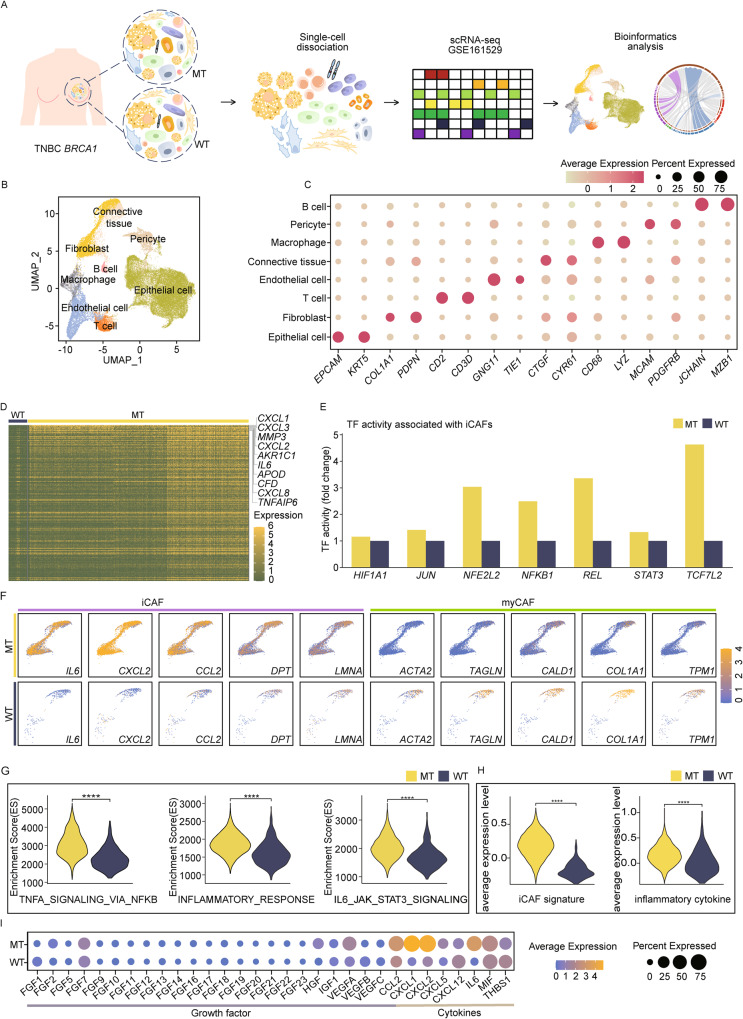
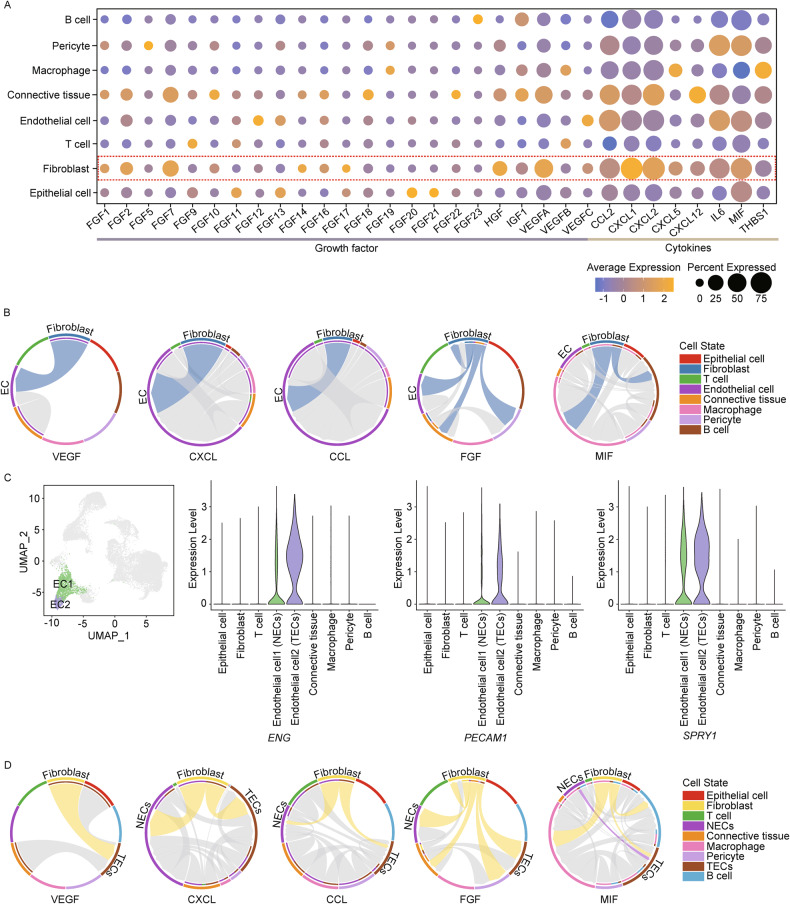
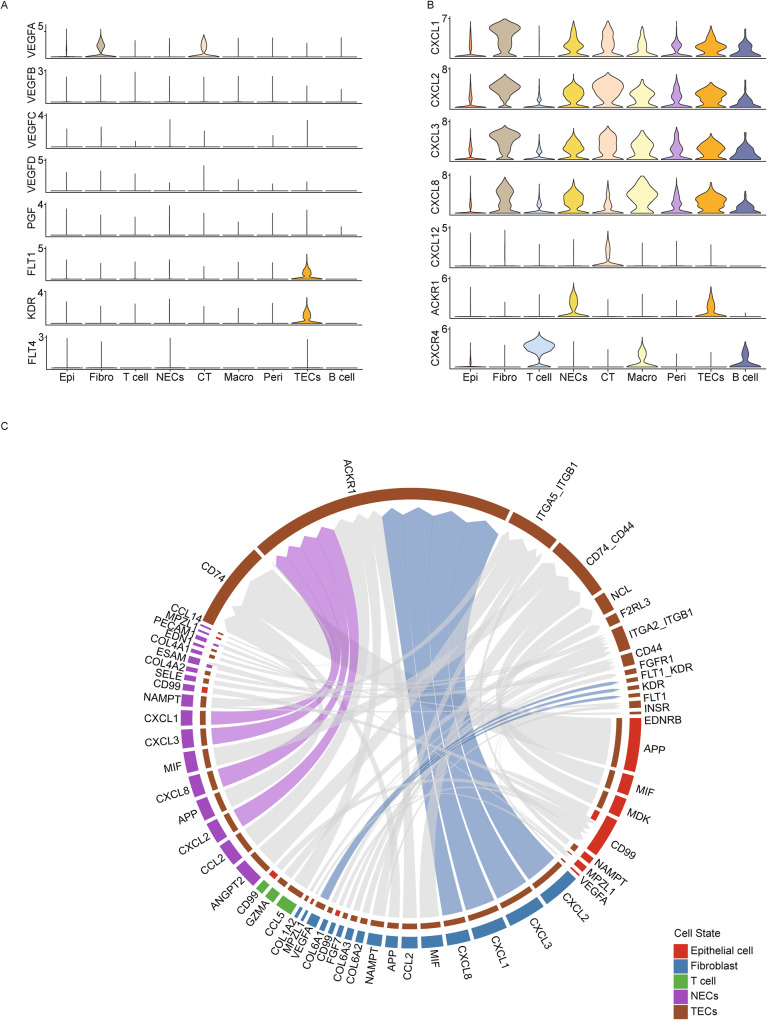
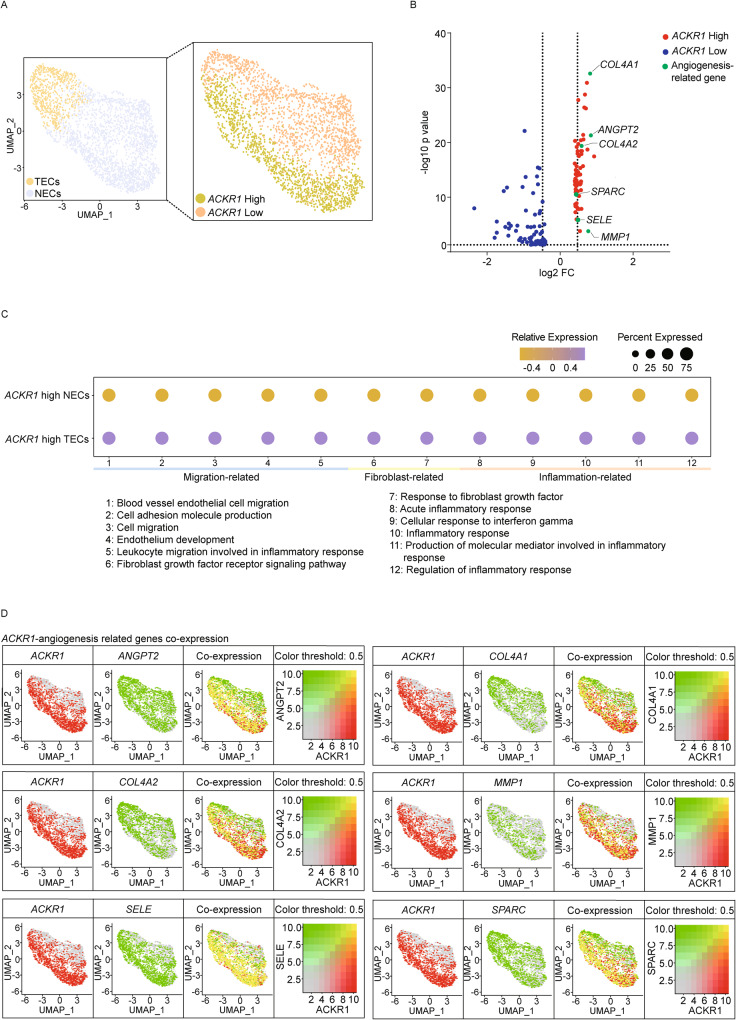
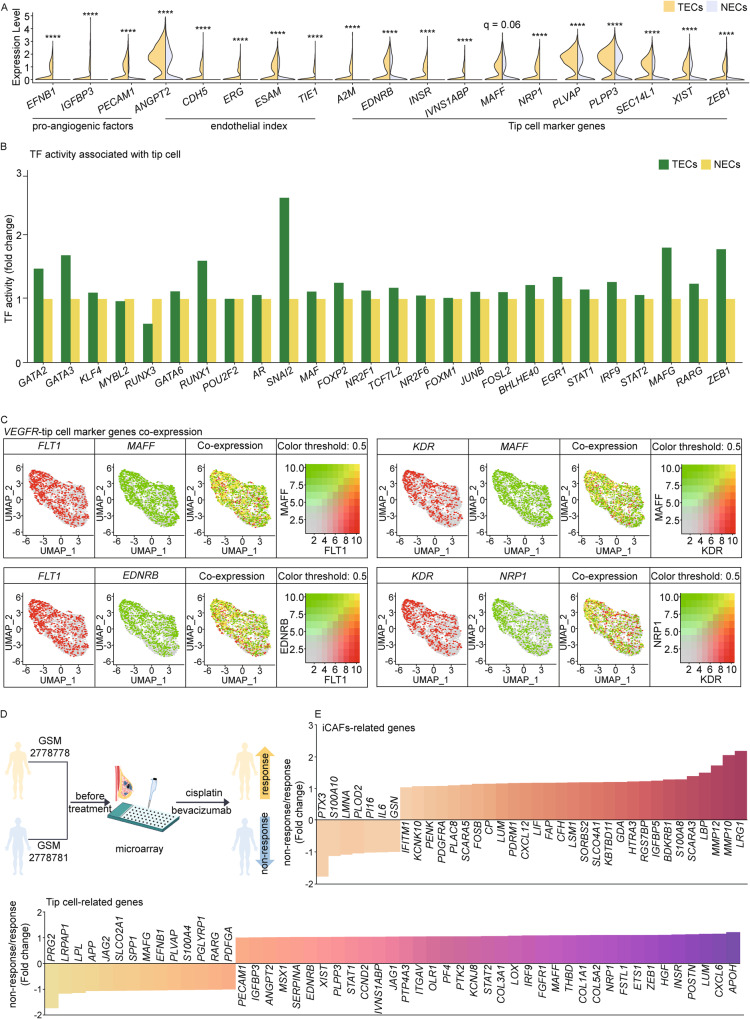
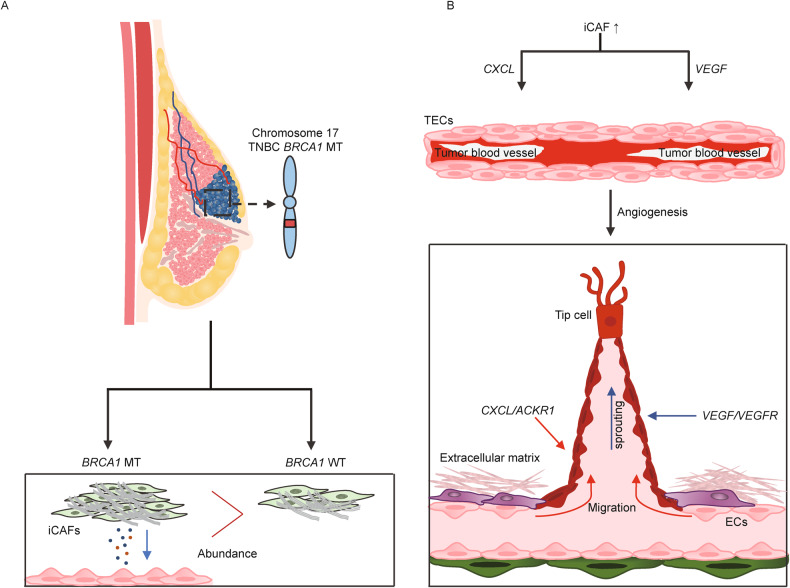
Triple-negative breast cancer (TNBC) is an aggressive breast cancer subtype with inferior outcomes owing to its low treatment response and high invasiveness. Based on abundant cancer-associated fibroblasts (CAFs) and frequent mutation of breast cancer-associated 1 (BRCA1) in TNBC, the characteristics of CAFs in TNBC patients with BRCA1 mutation compared to wild-type were investigated using single-cell analysis. Intriguingly, we observed that characteristics of inflammatory CAFs (iCAFs) were enriched in patients with BRCA1 mutation compared to the wild-type. iCAFs in patients with BRCA1 mutation exhibited outgoing signals to endothelial cells (ECs) clusters, including chemokine (C-X-C motif) ligand (CXCL) and vascular endothelial growth factor (VEGF). During CXCL signaling, the atypical chemokine receptor 1 (ACKR1) mainly interacts with CXCL family members in tumor endothelial cells (TECs). ACKR1-high TECs also showed high expression levels of angiogenesis-related genes, such as ANGPT2, MMP1, and SELE, which might lead to EC migration. Furthermore, iCAFs showed VEGF signals for FLT1 and KDR in TECs, which showed high co-expression with tip cell marker genes, including ZEB1 and MAFF, involved in sprouting angiogenesis. Moreover, BRCA1 mutation patients with relatively abundant iCAFs and tip cell gene expression exhibited a limited response to neoadjuvant chemotherapy, including cisplatin and bevacizumab. Importantly, our study observed the intricate link between iCAFs-mediated angiogenesis and chemoresistance in TNBC with BRCA1 mutation.


Conflict of interest statement

The authors declare no competing interests.

Figures

Fig. 1
Fig. 1. CAFs prominently reside in TNBC patients.
A Visium spatial gene expression data shows that the expression of CAF and NCAF signature in the fibroblast dominant area based on the marker gene SPARC. The GEO dataset was acquired from GSE210616. B Violin plots show the fibroblast dominant clusters based on SPARC expression in each patient. The highest clusters (C2 in P1, C0 in P2, C0 in P5, and C3 in P9) are highlighted in yellow. C Scatter plots illustrate the correlation between CAF or NCAF signature and SPARC in the fibroblast dominant cluster identified in (B). Four patients who represented the highest difference between CAF and NCAF signatures were named 1, 2, 5, and 9 (P1, P2, P5, P9) among 22 TNBC patients. R-values were calculated using the ‘FeatureScatter’ function in R, while p-values were calculated using the Social Science Statistics website (https://www.socscistatistics.com/pvalues/pearsondistribution.aspx). D The Kaplan–Meier curves show that TNBC patients with higher expression levels of CAF genes show poor prognosis in the DMFS (left) and OS (right). HR values and log-rank p-values were calculated using the KM Plotter database. E Box plots demonstrate that TNBC patients (n = 1980) have higher expression levels of CAF genes compared to other types of non-TNBC groups (n = 144). p-values were computed on the BCIP website (**p < 0.01, ****p < 0.0001).
Fig. 2
Fig. 2. TNBC BRCA1 MT significantly displays iCAFs phenotype.
A Experimental design shows scRNA-seq analysis of integrated TNBC BRCA1 MT (n = 4) and WT (n = 4). The dataset was obtained from GSE161529. B UMAP plot exhibits eight integrated clusters. C Dot plot represents marker genes for annotating eight clusters in B. The scale and dot size mean the average gene expression and percent expression, respectively. D The heatmap shows the top 10 upregulated DEGs in TNBC BRCA1 MT fibroblast were associated with iCAFs. E Bar graphs represent the activity of iCAF-related transcription factors, which was higher in TNBC BRCA1 MT compared to WT. F Feature plots show that iCAFs and myCAFs-related genes are highly expressed in TNBC BRCA1 MT and WT fibroblast clusters, respectively. G Violin plots illustrate that diverse pathways associated with iCAFs, such as tumor necrosis factor-α signaling via nuclear factor kappa-β, inflammatory response, and IL-6/JAK/STAT3 signaling, are enriched in TNBC BRCA1 MT fibroblasts compared to WT fibroblasts. H Violin plots show that the expression level of iCAFs and inflammatory cytokine signature was higher in TNBC BRCA1 MT than in WT. The ‘p.adjust’ function in R was utilized to derive the q-values. I Dot plot displays the expression level of several growth factors and cytokines in TNBC BRCA1 MT and WT. The expression level of IL-6 and CXCL was significantly higher in the TNBC BRCA1 MT. q-values in G, H were obtained using the ‘p.adjust’ function in R (****q < 0.0001).
Fig. 3
Fig. 3. ECs are major incoming target cells from iCAFs in TNBC BRCA1 MT.
A Dot plot indicates the average and percent expression of growth factor and cytokines across the total 8 clusters in the TNBC BRCA1 MT. B Chord diagram illustrates that fibroblasts mainly exhibit outgoing signaling toward ECs, including five signals: VEGF, CXCL, CCL, FGF, and MIF. C UMAP and violin plots show that the EC2 cluster had high expression of TEC-related genes such as ENG, PECAM1, and SPRY1 compared to the EC1 cluster. D Chord diagrams show predicted interaction pathways between fibroblast clusters and two types of ECs mentioned in (B).
Fig. 4
Fig. 4. TECs participate in CXCL and VEGF signaling with iCAFs in TNBC BRCA1 MT.
A Violin plots indicate VEGFA is highly expressed in fibroblasts in the VEGF family, whereas the receptor FLT1 (VEGFR1) and KDR (VEGFR2) are only expressed in TECs. B Violin plots show diverse CXCL families, including CXCL 1, 2, 3, and 8, which are expressed in all clusters, including fibroblast. In contrast, the receptor ACKR1 is only expressed in two types of ECs. C Chord diagram displays that TECs (brown) present prolific interactions with fibroblast (blue) and NECs (purple) in terms of the CXCL family and VEGFA. Each gene targets the ACKR1, FLT1, and KDR in TECs.
Fig. 5
Fig. 5. ACKR1 high TECs induce angiogenesis via communicating with the CXCL family in BRCA1 MT TNBC.
A Feature plot shows ECs were categorized into TECs and NECs (left) and again segregated into four clusters based on ACKR1 expression level (right) in TNBC BRCA1 MT. B Volcano plot illustrates several angiogenic process-related genes were enriched in ACKR1-high TECs (|log2 FC| ≥ 0.4, p < 0.05). C Dot plot presents ACKR1-high TECs that exhibit higher expression levels related to migration, fibroblast, and inflammation compared to ACKR1-high NECs. D Combined feature plots represent high co-expression of ACKR1 and angiogenesis-related genes in the TECs cluster.
Fig. 6
Fig. 6. iCAFs-induced VEGF signaling elicits angiogenesis, leading to resistance to combination therapy of Cisplatin and Bevacizumab in TNBC BRCA1 MT.
A Violin plots illustrate that the expression levels of pro-angiogenic factors, endothelial indices, and tip cell marker genes between TECs and NECs. The expression level in TECs was mostly higher than in NECs. B Bar graphs display that the TF activity of tip cell markers in TECs was higher than in NECs. C Combined feature plots indicate high co-expression of VEGFR and tip cell marker genes, including MAFF or EDNRB, in the TECs cluster. D Schematic diagram shows two TNBC BRCA1 MT expression data prior to neoadjuvant therapy combined with cisplatin and bevacizumab (top). E Bar graphs represent the fold change of microarray value associated with iCAFs and tip cell genes (top and bottom, respectively). In non-response patients, iCAFs and tip cell genes were higher than in response patients. q-values in A were obtained using the ‘p.adjust’ function in R (****q < 0.0001).
Fig. 7
Fig. 7. Schematic diagram of sprouting angiogenesis through iCAFs in TNBC BRCA1 MT.
A TNBC BRCA1 MT germline mutation enriched the iCAF phenotype compared to WT. B iCAFs mainly secrete CXCL and VEGF to TECs, which interact with ACKR1, FLT1, and KDR, respectively. CXCL/ACKR1 axis drives vascular stalk formation and TECs migration by inducing diverse angiogenic effects, including blood vessel loosening ECM remodeling. Additionally, VEGFA/VEGFR axis triggers the differentiation of TECs into tip cells, leading to sprouting angiogenesis.

Similar articles

Cited by

References

    1. Sun H, Zou J, Chen L, Zu X, Wen G, Zhong J. Triple‑negative breast cancer and its association with obesity. Mol Clin Oncol. 2017;7:935–42. - PMC - PubMed
    1. Zagami P, Carey LA. Triple negative breast cancer: pitfalls and progress. NPJ Breast Cancer. 2022;8:95. doi: 10.1038/s41523-022-00468-0. - DOI - PMC - PubMed
    1. Wang X, Collet L, Rediti M, Debien V, De Caluwé A, Venet D, et al. Predictive biomarkers for response to immunotherapy in triple negative breast cancer: promises and challenges. J Clin Med. 2023;12:953. doi: 10.3390/jcm12030953. - DOI - PMC - PubMed
    1. Ma C, Zu X, Liu K, Bode AM, Dong Z, Liu Z, et al. Knockdown of pyruvate kinase M inhibits cell growth and migration by reducing NF-κB activity in triple-negative breast cancer cells. Mol Cells. 2019;42:628. - PMC - PubMed
    1. Yin L, Duan JJ, Bian XW, Yu SC. Triple-negative breast cancer molecular subtyping and treatment progress. Breast Cancer Res. 2020;22:1–13. doi: 10.1186/s13058-020-01296-5. - DOI - PMC - PubMed