. 2024 Jan 5;11(1):34.
doi: 10.1038/s41597-023-02863-z.

High-resolution climate projection dataset based on CMIP6 for Peru and Ecuador: BASD-CMIP6-PE

Affiliations

High-resolution climate projection dataset based on CMIP6 for Peru and Ecuador: BASD-CMIP6-PE

Carlos Antonio Fernandez-Palomino et al. Sci Data. .

Abstract

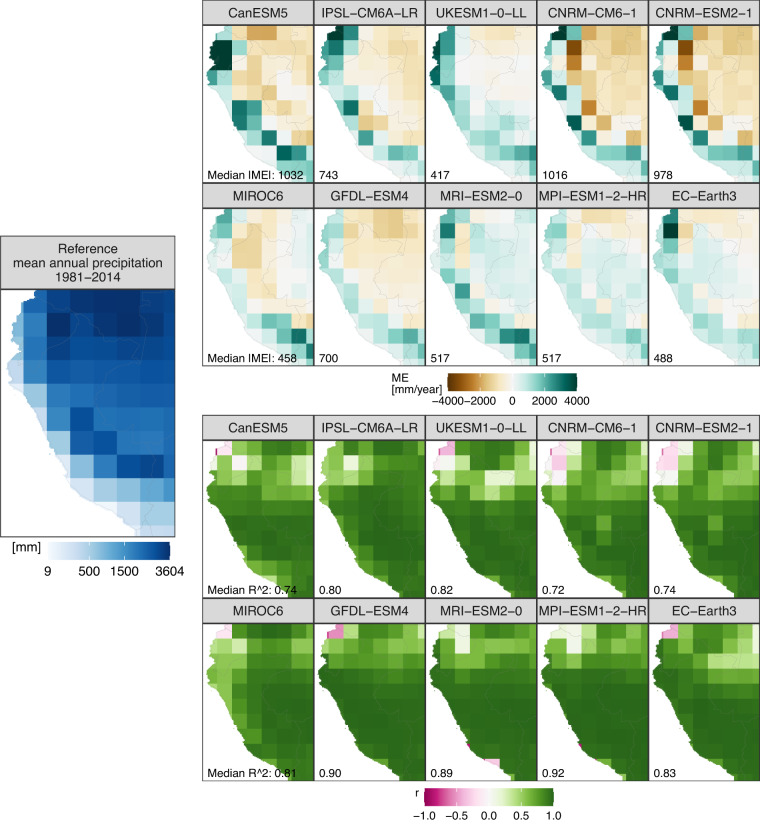
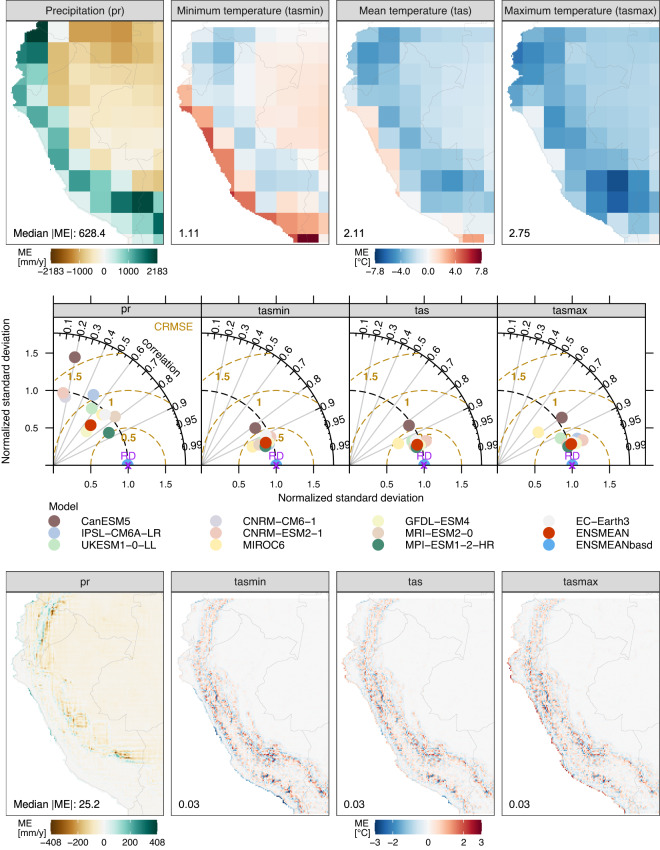
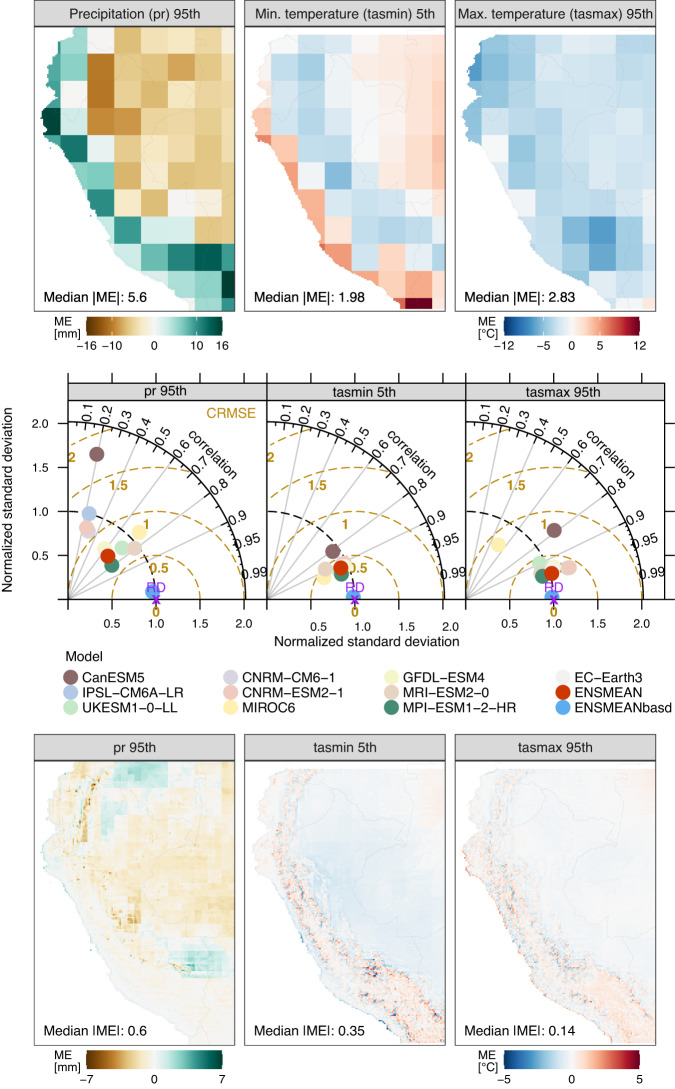
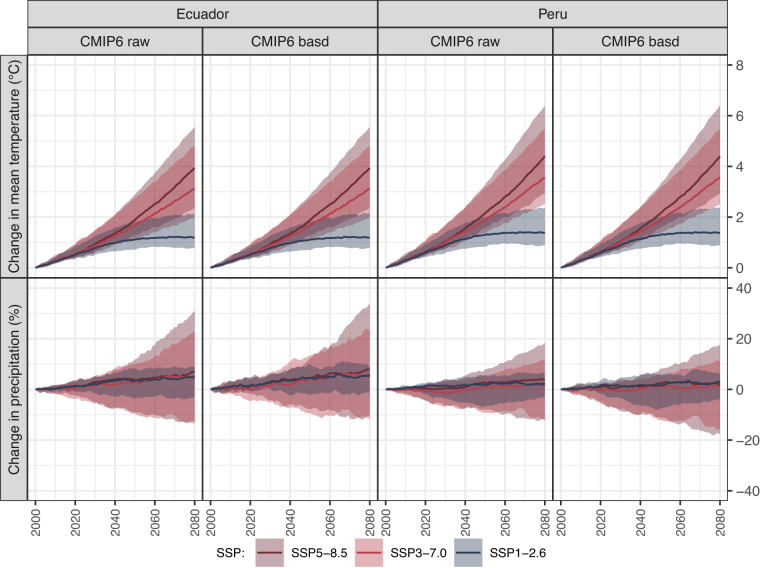
Here, we present BASD-CMIP6-PE, a high-resolution (1d, 10 km) climate dataset for Peru and Ecuador based on the bias-adjusted and statistically downscaled CMIP6 climate projections of 10 GCMs. This dataset includes both historical simulations (1850-2014) and future projections (2015-2100) for precipitation and minimum, mean, and maximum temperature under three Shared Socioeconomic Pathways (SSP1-2.6, SSP3-7.0, and SSP5-8.5). The BASD-CMIP6-PE climate data were generated using the trend-preserving Bias Adjustment and Statistical Downscaling (BASD) method. The BASD performance was evaluated using observational data and through hydrological modeling across Peruvian and Ecuadorian river basins in the historical period. Results demonstrated that BASD significantly reduced biases between CMIP6-GCM simulations and observational data, enhancing long-term statistical representations, including mean and extreme values, and seasonal patterns. Furthermore, the hydrological evaluation highlighted the appropriateness of adjusted GCM simulations for simulating streamflow, including mean, low, and high flows. These findings underscore the reliability of BASD-CMIP6-PE in assessing regional climate change impacts on agriculture, water resources, and hydrological extremes.


Conflict of interest statement

The authors declare no competing interests.

Figures

Fig. 1
Fig. 1
Flow chart for the BASD-CMIP6-PE dataset variables (pr, tasmin, tas, tasmax) for 10 GCMs. The bias adjustment was applied at: (a) 2° for CanESM5, IPSL-CM6A-LR, and UKESM1-0-LL; (b) 1° for CNRM-CM6-1, CNRM-ESM2-1, GFDL-ESM4, MIROC6, MPI-ESM1-2-HR, and MRI-ESM2-0; and (c) 0.5° for EC-Earth3. GCM (RD) is Global Climate Model (reference) data. Note that RD are aggregated observation data.
Fig. 2
Fig. 2
Performance of the unadjusted CMIP6 models in simulating mean temperature compared with reference temperature data from PISCO-temperature for the 1981–2014 period. ME is the mean error, r is Pearson’s correlation coefficient, and R2 is the coefficient of determination. r and R2 show the agreement between the simulated and observed mean annual temperature cycle.
Fig. 3
Fig. 3
Performance of the unadjusted CMIP6 models in simulating precipitation compared with reference precipitation data from RAIN4PE for the 1981–2014 period. ME is the mean error, r is Pearson’s correlation coefficient, and R2 is the coefficient of determination. r and R2 show the agreement between the simulated and observed mean annual precipitation cycle.
Fig. 4
Fig. 4
Mean Errors [ME] in (Top) unadjusted [ENSMEAN] and (Bottom) adjusted [ENSMEANbasd] CMIP6 multimodel ensemble means, and (Middle) Taylor diagrams, both comparing simulated and reference climate means for 1981–2014. Adjusted models were excluded from the Taylor diagrams as they closely match ENSMEANbasd and the reference data. The bottom panel displays ME in ENSMEANbasd, computed by comparing BASD-CMIP6-PE and observational data at a 0.1° spatial resolution.
Fig. 5
Fig. 5
Mean Errors [ME] in (Top) unadjusted [ENSMEAN] and (Bottom) adjusted [ENSMEANbasd] CMIP6 multimodel ensemble means, and (Middle) Taylor diagrams, both comparing simulated and reference climate extremes for 1981–2014. Adjusted models were excluded from the Taylor diagrams as they closely match ENSMEANbasd and the reference data. The bottom panel displays ME in ENSMEANbasd, computed by comparing BASD-CMIP6-PE and observational data at a 0.1° spatial resolution.
Fig. 6
Fig. 6
Comparison of simulated streamflow dynamics, including extreme events of both low flows (Slow) and high flows (Shigh), from raw GCM simulations (Qgcm) and reference climate-based simulated streamflow (Qref). (top) Statistical metrics and hydrological signatures and (bottom) daily values of climatological seasonal streamflow (Q) in the period 1984–2014 for representative river catchments draining into the Titicaca Lake (a,b), the Pacific Ocean (A:D), and the Amazon River (1:6). Note that observed seasonal streamflow was computed only using the days with available streamflow data.
Fig. 7
Fig. 7
Comparison of simulated streamflow dynamics, including extreme events of both low flows (Slow) and high flows (Shigh), from adjusted GCM simulations (Qbasd) and reference climate-based simulated streamflow (Qref). (top) Statistical metrics and hydrological signatures and (bottom) daily values of climatological seasonal streamflow (Q) in the period 1984–2014 for representative river catchments draining into the Titicaca Lake (a,b), the Pacific Ocean (A:D), and the Amazon River (1:6). Note that observed seasonal streamflow was computed only using the days with available streamflow data.
Fig. 8
Fig. 8
Comparison of projected multimodel median changes and spreads in precipitation and mean temperature for Ecuador and Peru using raw (CMIP6 raw) and adjusted (CMIP6 basd) GCM simulations.

References

    1. Funk C, et al. A global satellite-assisted precipitation climatology. Earth Syst. Sci. Data. 2015;7:275–287. doi: 10.5194/essd-7-275-2015. - DOI
    1. Funk C, et al. The climate hazards infrared precipitation with stations - A new environmental record for monitoring extremes. Sci. Data. 2015;2:1–21. doi: 10.1038/sdata.2015.66. - DOI - PMC - PubMed
    1. Beck HE, et al. MSWEP: 3-hourly 0.25° global gridded precipitation (1979–2015) by merging gauge, satellite, and reanalysis data. Hydrol. Earth Syst. Sci. 2017;21:589–615. doi: 10.5194/hess-21-589-2017. - DOI
    1. Beck HE, et al. MSWEP V2 Global 3-Hourly 0.1° Precipitation: Methodology and Quantitative Assessment. Bull. Am. Meteorol. Soc. 2019;100:473–500. doi: 10.1175/BAMS-D-17-0138.1. - DOI
    1. Huerta, A., Aybar, C. & Lavado-Casimiro, W. PISCO temperatura v.1.1. SENAMHI - DHI-2018, Lima-Perú. http://iridl.ldeo.columbia.edu/documentation/.pisco/.PISCOt_report.pdf (2018).