

Tuning of liver circadian transcriptome rhythms by thyroid hormone state in male mice
- PMID: 38182610
- PMCID: PMC10770409
- DOI: 10.1038/s41598-023-50374-z
Tuning of liver circadian transcriptome rhythms by thyroid hormone state in male mice
Abstract
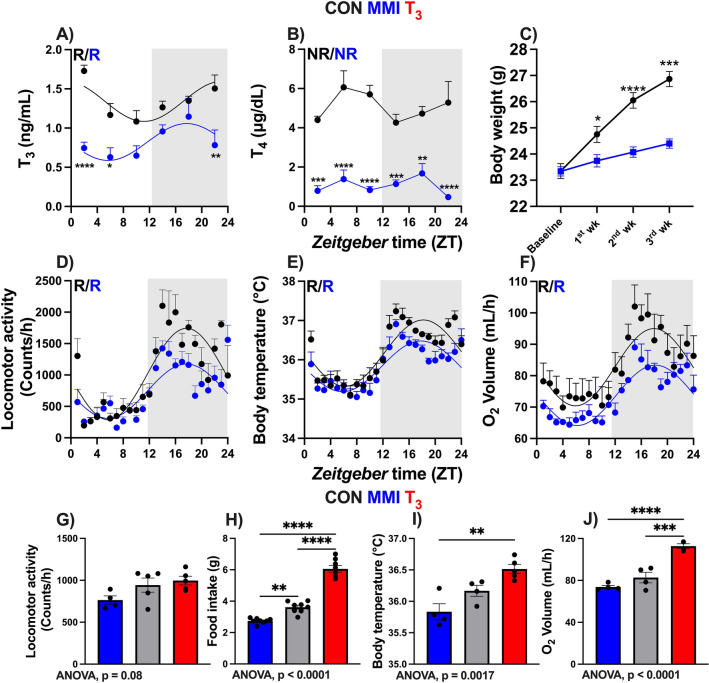
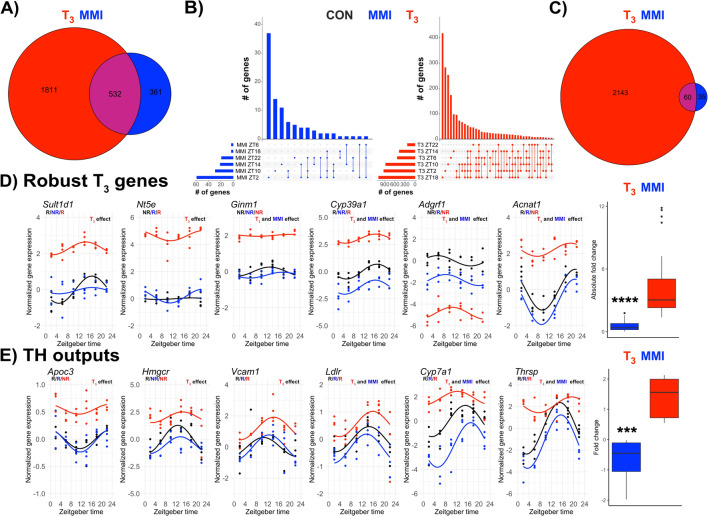
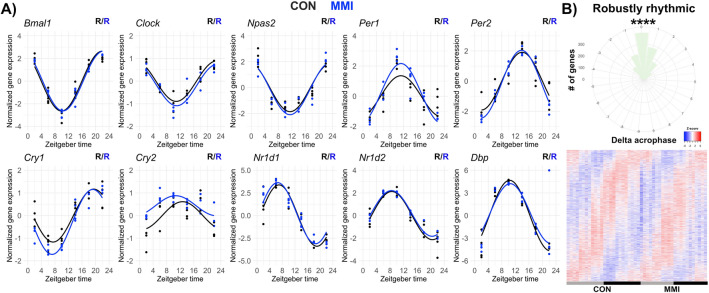
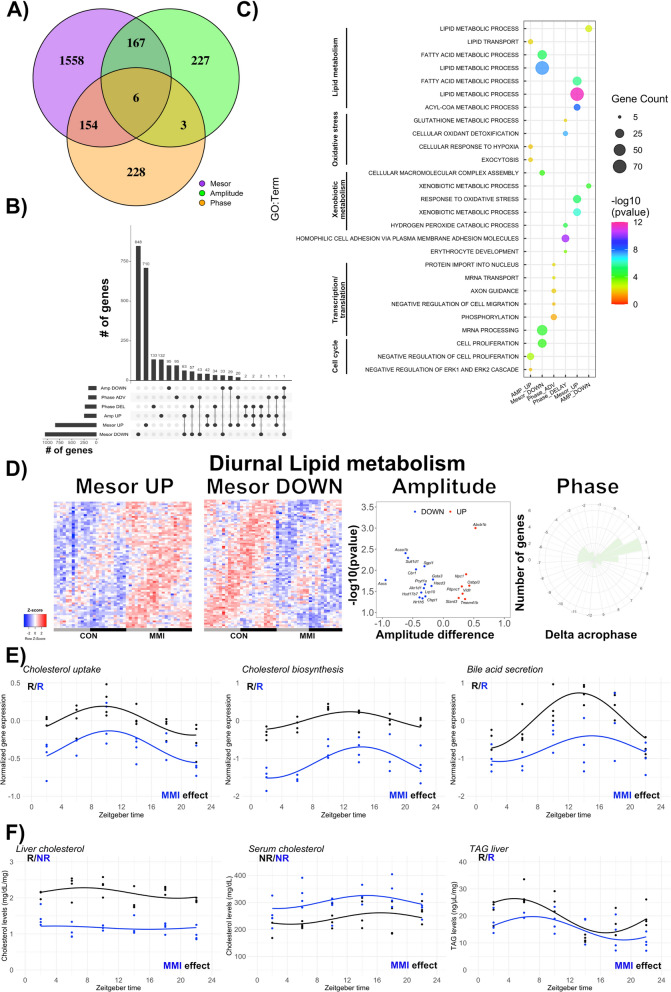
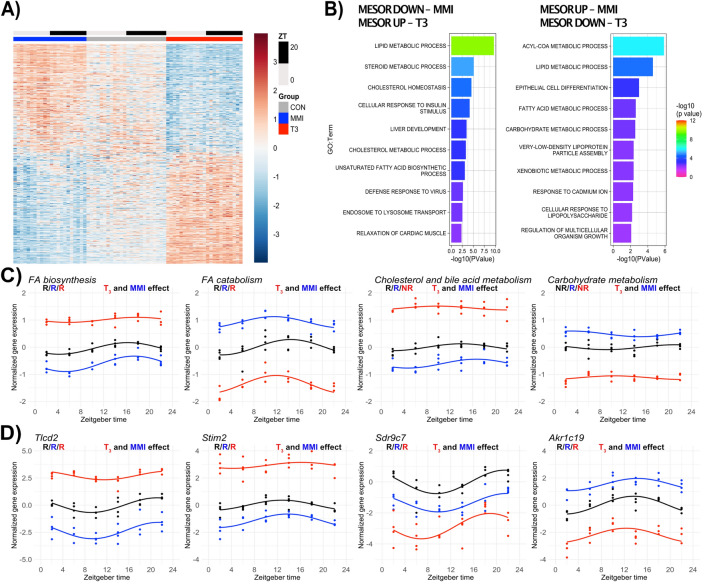
Thyroid hormones (THs) are important regulators of systemic energy metabolism. In the liver, they stimulate lipid and cholesterol turnover and increase systemic energy bioavailability. It is still unknown how the TH state interacts with the circadian clock, another important regulator of energy metabolism. We addressed this question using a mouse model of hypothyroidism and performed circadian analyses. Low TH levels decreased locomotor activity, food intake, and body temperature mostly in the active phase. Concurrently, liver transcriptome profiling showed only subtle effects compared to elevated TH conditions. Comparative circadian transcriptome profiling revealed alterations in mesor, amplitude, and phase of transcript levels in the livers of low-TH mice. Genes associated with cholesterol uptake, biosynthesis, and bile acid secretion showed reduced mesor. Increased and decreased cholesterol levels in the serum and liver were identified, respectively. Combining data from low- and high-TH conditions allowed the identification of 516 genes with mesor changes as molecular markers of the liver TH state. We explored these genes and created an expression panel that assesses liver TH state in a time-of-day dependent manner. Our findings suggest that the liver has a low TH action under physiological conditions. Circadian profiling reveals genes as potential markers of liver TH state.
© 2024. The Author(s).
Conflict of interest statement
The authors declare no competing interests.
Figures
Similar articles
-
Circadian Gating of Thyroid Hormone Action in Hepatocytes.Cells. 2024 Jun 14;13(12):1038. doi: 10.3390/cells13121038. Cells. 2024. PMID: 38920666 Free PMC article.
-
Rewiring of liver diurnal transcriptome rhythms by triiodothyronine (T3) supplementation.Elife. 2022 Jul 27;11:e79405. doi: 10.7554/eLife.79405. Elife. 2022. PMID: 35894384 Free PMC article.
-
Non-rhythmic modulators of the circadian system: A new class of circadian modulators.Int Rev Cell Mol Biol. 2025;393:141-162. doi: 10.1016/bs.ircmb.2024.04.003. Epub 2024 May 9. Int Rev Cell Mol Biol. 2025. PMID: 40390461 Review.
-
Disruption of the Pituitary Circadian Clock Induced by Hypothyroidism and Hyperthyroidism: Consequences on Daily Pituitary Hormone Expression Profiles.Thyroid. 2019 Apr;29(4):502-512. doi: 10.1089/thy.2018.0578. Epub 2019 Mar 13. Thyroid. 2019. PMID: 30747053
-
How sleep and wakefulness influence circadian rhythmicity: effects of insufficient and mistimed sleep on the animal and human transcriptome.J Sleep Res. 2015 Oct;24(5):476-93. doi: 10.1111/jsr.12307. Epub 2015 Jun 8. J Sleep Res. 2015. PMID: 26059855 Review.
Cited by
-
Transcriptomic landscape of hyperthyroidism in mice overexpressing thyroid-stimulating hormone.iScience. 2024 Dec 10;28(1):111565. doi: 10.1016/j.isci.2024.111565. eCollection 2025 Jan 17. iScience. 2024. PMID: 39811643 Free PMC article.
-
Thyroid hormone receptor beta (THRB) dependent regulation of diurnal hepatic lipid metabolism in adult male mice.NPJ Metab Health Dis. 2024 Aug 13;2(1):21. doi: 10.1038/s44324-024-00023-4. NPJ Metab Health Dis. 2024. PMID: 40603776 Free PMC article.
-
Actions of thyroid hormones and thyromimetics on the liver.Nat Rev Gastroenterol Hepatol. 2025 Jan;22(1):9-22. doi: 10.1038/s41575-024-00991-4. Epub 2024 Oct 17. Nat Rev Gastroenterol Hepatol. 2025. PMID: 39420154 Free PMC article. Review.
-
Hypothyroidism impairs the circadian rhythmicity of clock genes and proteins involved in gut nutrient absorption in female mice.Front Physiol. 2025 Jan 31;16:1515437. doi: 10.3389/fphys.2025.1515437. eCollection 2025. Front Physiol. 2025. PMID: 39958687 Free PMC article.
-
Circadian Gating of Thyroid Hormone Action in Hepatocytes.Cells. 2024 Jun 14;13(12):1038. doi: 10.3390/cells13121038. Cells. 2024. PMID: 38920666 Free PMC article.
References
MeSH terms
Substances
Grants and funding
LinkOut - more resources
Full Text Sources
