

Evaluation of deep learning-based quantitative computed tomography for opportunistic osteoporosis screening
- PMID: 38182616
- PMCID: PMC10770031
- DOI: 10.1038/s41598-023-45824-7
Evaluation of deep learning-based quantitative computed tomography for opportunistic osteoporosis screening
Abstract
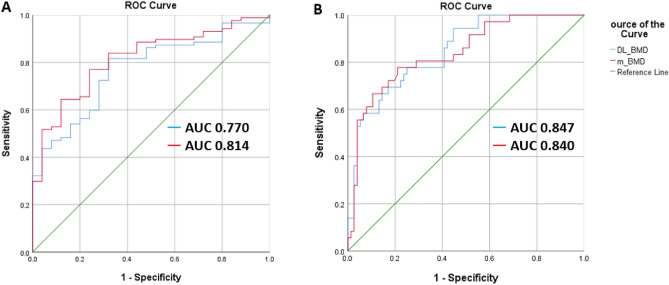
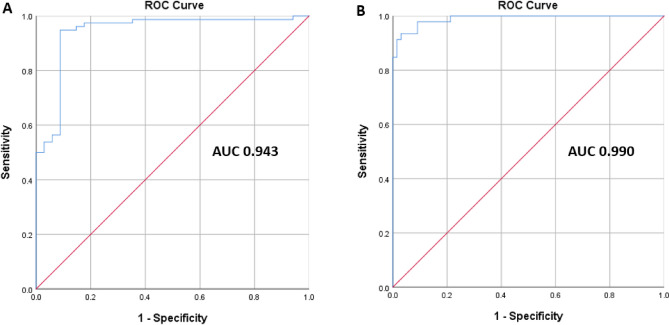
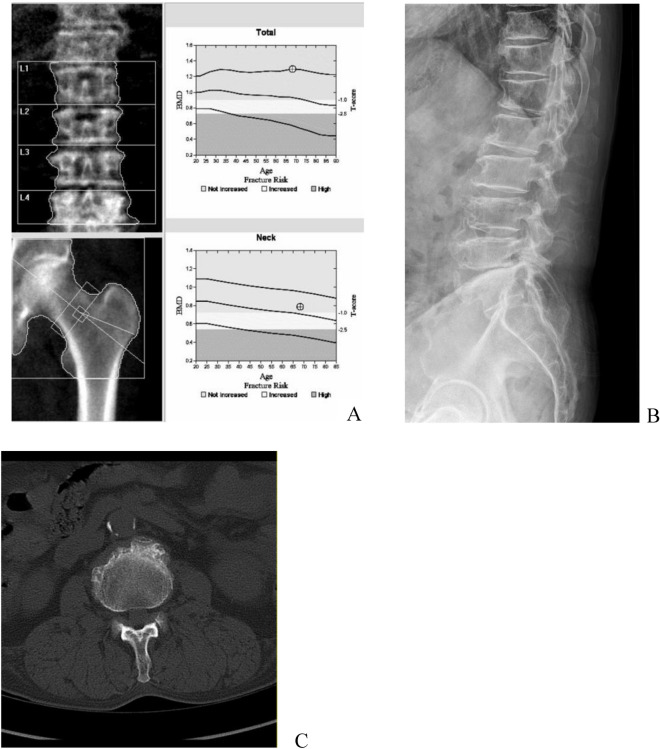
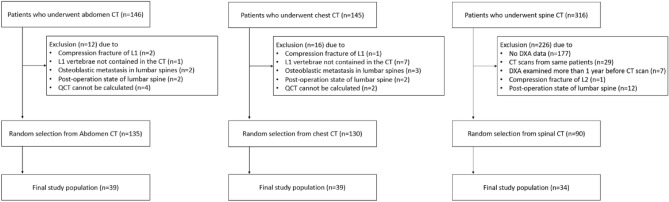
To evaluate diagnostic efficacy of deep learning (DL)-based automated bone mineral density (BMD) measurement for opportunistic screening of osteoporosis with routine computed tomography (CT) scans. A DL-based automated quantitative computed tomography (DL-QCT) solution was evaluated with 112 routine clinical CT scans from 84 patients who underwent either chest (N:39), lumbar spine (N:34), or abdominal CT (N:39) scan. The automated BMD measurements (DL-BMD) on L1 and L2 vertebral bodies from DL-QCT were validated with manual BMD (m-BMD) measurement from conventional asynchronous QCT using Pearson's correlation and intraclass correlation. Receiver operating characteristic curve (ROC) analysis identified the diagnostic ability of DL-BMD for low BMD and osteoporosis, determined by dual-energy X-ray absorptiometry (DXA) and m-BMD. Excellent concordance were seen between m-BMD and DL-BMD in total CT scans (r = 0.961/0.979). The ROC-derived AUC of DL-BMD compared to that of central DXA for the low-BMD and osteoporosis patients was 0.847 and 0.770 respectively. The sensitivity, specificity, and accuracy of DL-BMD compared to central DXA for low BMD were 75.0%, 75.0%, and 75.0%, respectively, and those for osteoporosis were 68.0%, 80.5%, and 77.7%. The AUC of DL-BMD compared to the m-BMD for low BMD and osteoporosis diagnosis were 0.990 and 0.943, respectively. The sensitivity, specificity, and accuracy of DL-BMD compared to m-BMD for low BMD were 95.5%, 93.5%, and 94.6%, and those for osteoporosis were 88.2%, 94.5%, and 92.9%, respectively. DL-BMD exhibited excellent agreement with m-BMD on L1 and L2 vertebrae in the various routine clinical CT scans and had comparable diagnostic performance for detecting the low-BMD and osteoporosis on conventional QCT.
© 2023. The Author(s).
Conflict of interest statement
The authors declare no competing interests.
Figures
Similar articles
-
Automated deep learning-based bone mineral density assessment for opportunistic osteoporosis screening using various CT protocols with multi-vendor scanners.Sci Rep. 2024 Oct 23;14(1):25014. doi: 10.1038/s41598-024-73709-w. Sci Rep. 2024. PMID: 39443535 Free PMC article.
-
Discordance in lumbar bone mineral density measurements by quantitative computed tomography and dual-energy X-ray absorptiometry in postmenopausal women: a prospective comparative study.Spine J. 2023 Feb;23(2):295-304. doi: 10.1016/j.spinee.2022.10.014. Epub 2022 Nov 4. Spine J. 2023. PMID: 36343911
-
Preoperative MRI-based vertebral bone quality (VBQ) score assessment in patients undergoing lumbar spinal fusion.Spine J. 2022 Aug;22(8):1301-1308. doi: 10.1016/j.spinee.2022.03.006. Epub 2022 Mar 24. Spine J. 2022. PMID: 35342015
-
Opportunistic Screening Techniques for Analysis of CT Scans.Curr Osteoporos Rep. 2023 Feb;21(1):65-76. doi: 10.1007/s11914-022-00764-5. Epub 2022 Nov 26. Curr Osteoporos Rep. 2023. PMID: 36435912 Free PMC article. Review.
-
Artificial intelligence-enhanced opportunistic screening of osteoporosis in CT scan: a scoping Review.Osteoporos Int. 2024 Oct;35(10):1681-1692. doi: 10.1007/s00198-024-07179-1. Epub 2024 Jul 10. Osteoporos Int. 2024. PMID: 38985200
Cited by
-
Estimating lumbar bone mineral density from conventional MRI and radiographs with deep learning in spine patients.Eur Spine J. 2024 Nov;33(11):4092-4103. doi: 10.1007/s00586-024-08463-8. Epub 2024 Aug 30. Eur Spine J. 2024. PMID: 39212711
-
Gastrointestinal health and serum proteins are associated with BMD in postmenopausal women: a cross-sectional study.Nutr Metab (Lond). 2024 Nov 6;21(1):86. doi: 10.1186/s12986-024-00865-1. Nutr Metab (Lond). 2024. PMID: 39506776 Free PMC article.
-
Associations of Serum Homocysteine with Bone Mineral Density and Osteoporosis Incidence in Chinese Middle-Aged and Older Adults: A Retrospective Cohort Study.Nutrients. 2025 Jan 6;17(1):192. doi: 10.3390/nu17010192. Nutrients. 2025. PMID: 39796626 Free PMC article.
-
Automated deep learning-based bone mineral density assessment for opportunistic osteoporosis screening using various CT protocols with multi-vendor scanners.Sci Rep. 2024 Oct 23;14(1):25014. doi: 10.1038/s41598-024-73709-w. Sci Rep. 2024. PMID: 39443535 Free PMC article.
-
Automated Opportunistic Osteoporosis Screening Using Low-Dose Chest CT among Individuals Undergoing Lung Cancer Screening in a Korean Population.Diagnostics (Basel). 2024 Aug 16;14(16):1789. doi: 10.3390/diagnostics14161789. Diagnostics (Basel). 2024. PMID: 39202277 Free PMC article.
References
-
- United Nations DoEaSA, Population Division. World Population Prospects 2019: Ten Key Findings. 2019 June [Cited 2022 August 11]. https://population.un.org/wpp/publications/Files/WPP2019_10KeyFindings.pdf
-
- Smith-Bindman R, Kwan ML, Marlow EC, Theis MK, Bolch W, Cheng SY, Bowles EJA, Duncan JR, Greenlee RT, Kushi LH, Pole JD, Rahm AK, Stout NK, Weinmann S, Miglioretti DL. Trends in use of medical imaging in US Health Care Systems and in Ontario, Canada, 2000–2016. JAMA. 2019;322:843–856. doi: 10.1001/jama.2019.11456. - DOI - PMC - PubMed
-
- Smith-Bindman R, Miglioretti DL, Johnson E, Lee C, Feigelson HS, Flynn M, Greenlee RT, Kruger RL, Hornbrook MC, Roblin D, Solberg LI, Vanneman N, Weinmann S, Williams AE. Use of diagnostic imaging studies and associated radiation exposure for patients enrolled in large integrated health care systems, 1996–2010. JAMA. 2012;307:2400–2409. doi: 10.1001/jama.2012.5960. - DOI - PMC - PubMed
MeSH terms
Grants and funding
- grant number S2844049/Ministry of Small and Medium-sized Enterprises (SMEs) and Startups (MSS, Korea)
- NTIS #1425142385/Ministry of Small and Medium-sized Enterprises (SMEs) and Startups (MSS, Korea)
- grant number S2844049/Ministry of Small and Medium-sized Enterprises (SMEs) and Startups (MSS, Korea)
- NTIS #1425142385/Ministry of Small and Medium-sized Enterprises (SMEs) and Startups (MSS, Korea)
- grant number IITP-2023-2020-0-01819/Ministry of Science and ICT, South Korea
- grant number IITP-2023-2020-0-01819/Ministry of Science and ICT, South Korea
- grant number 20010927/Ministry of Trade, Industry and Energy
- NTIS#1415169348/Ministry of Trade, Industry and Energy
- grant number 20010927/Ministry of Trade, Industry and Energy
- NTIS#1415169348/Ministry of Trade, Industry and Energy
LinkOut - more resources
Full Text Sources
Medical
